The Early (1 hr) Multi–Color Afterglow of GRB 050502a:
Possible Evidence for a Uniform Medium with Density Clumps
Abstract
The 2-m robotic Liverpool Telescope reacted promptly to the gamma–ray burst GRB 050502a discovered by INTEGRAL and started observing 3 min after the onset of the GRB. The automatic identification of a bright afterglow of triggered for the first time an observation sequence in the filters during the first hour after a GRB. Observations continued for 1 day using the RoboNet-1.0 network of 2-m robotic telescopes. The light curve in all filters can be described by a simple power law with index of . We find evidence for a bump rising at days in all filters. From the spectrum and the light curve we investigate different interpretative scenarios and we find possible evidence for a uniform circumburst medium with clumps in density, as in the case of GRB 021004. Other interpretations of such bumps, such as the effect of energy injection through refreshed shocks or the result of a variable energy profile, are less favored. The optical afterglow of GRB 050502a is likely to be the result of slow electron cooling with the optical bands lying between the synchrotron peak frequency and the cooling frequency.
Subject headings:
gamma rays: bursts1. Introduction
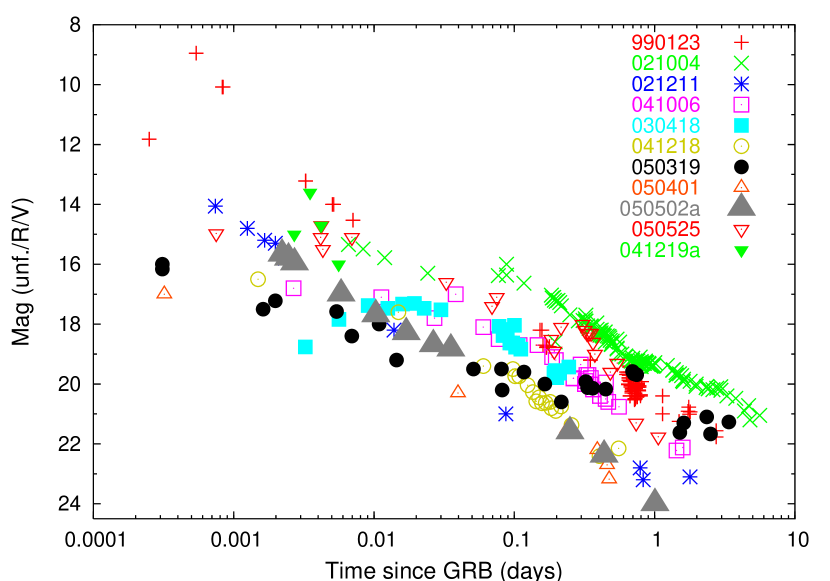
Although a considerable number of Gamma–Ray Bursts (GRBs) have detected optical counterparts, there are still few with optical afterglow measurements within minutes of the gamma rays: Figure 1 shows the early light curves (unfiltered, and ) for all of these. The early afterglow is particularly interesting as it carries information about the immediate surroundings of the GRB progenitor, concerning either the circumburst medium or the interaction between shells and the ISM in the fireball scenario. For two GRBs, an optical flash was detected simultaneously with the gamma rays: GRB 990123 and GRB 041219a: the former has been interpreted as the signature of a reverse shock (Akerlof et al., 1999), while for the latter a correlation between the gamma–ray and optical radiation light curves seems to favor a common origin (Vestrand et al., 2005). These early afterglows show considerable variety: e.g., in the case of GRB 030418 the optical emission was found to rise for the first 600 s, slowly vary for 1400 s and then faded as a power law. This was interpreted as due to the variable extinction by the local circumburst medium (Rykoff et al., 2004). In the cases of GRB 990123 and GRB 021211, the early light curve is described by a power law whose index varies from to a few min after the GRB: at 0.5 min and 2.7 min in the rest frame, respectively (Holland et al., 2004). This has been interpreted as due to the transition between reverse and forward shocks.
GRB 021004, one of the best observed GRBs in optical (Holland et al., 2003; Fynbo et al., 2005; de Ugarte Postigo et al., 2005), exhibited a number of bumps in its light curve, with all but the first bump being detected from radio to U band. Different interpretations have been suggested to explain the light curve features: Lazzati et al. (2002) modeled it using a variable density profile, most likely a uniform medium with clumps with density variations of the order of and size of cm. Other authors (Nakar et al., 2003; Björnsson et al., 2004; de Ugarte Postigo et al., 2005) account for the bumps with episodes of energy injections when inner shells catch up with the afterglow shock at late times. In addition, Nakar et al. (2003) show that the bumps could be also explained by a variable energy profile that is angularly-dependent on jet structure (“patchy shell” model).
In this Letter, we report the robotic detection and automatic identification of GRB 050502a using the 2-m Liverpool Telescope (LT) located in La Palma, Canary Islands: these observations represent one of the first observations of a multi–color light curve in the first hour since the burst. In addition, we report on late follow–up observations performed with LT and the 2-m Faulkes Telescope North (FTN) located at Maui, Hawaii, both members of the RoboNet-1.0 consortium111Funded by UK PPARC through a consortium of 10 UK universities. (Gomboc et al., 2005a).
2. Observations and Results
On 2005 May 02 INTEGRAL detected GRB 050502a at 02:13:57 UT and determined its position at =13:29:45.4 and =+42:40:26.8 (J2000) with an error radius of 2 arcmin (90% C.L.) (Götz et al., 2005). The GRB had a duration of 20 s. In the 20–200 keV band it had a peak flux of erg cm-2 s-1 and a fluence of erg cm-2 (Götz & Mereghetti, 2005), thus ranking among faint/intermediate fluence GRBs. ROTSE–IIIb started observing at 23.3 s after the GRB and detected a 14.3-mag (unfiltered) unknown fading source at =13:29:46.3 and =+42:40:27.7 (J2000) (, ) (Yost et al., 2005). Prochaska et al. (2005) acquired a spectrum with Keck–I 3.5 hr after the GRB and identified a strong absorption feature, which they interpret as SiII1260 at redshift .
The LT responded robotically to the INTEGRAL alert and started observing 3 min after the GRB onset (2.5 min after the notice time). Independently of ROTSE–IIIb it detected a bright fading source not present in the USNO–B1.0, 2MASS and GSC 2.3 catalogs, with a position consistent with that of the optical transient (OT) of ROTSE–IIIb (Gomboc et al., 2005b). The automatic identification of the bright and rapidly-fading OT by the LT GRB robotic pipeline (see Gomboc et al. (2005c) for technical details) resulted in the automatic triggering of a multi–color imaging sequence that provided light curves in filters from 3 min to 1 hr after the GRB onset. The robotic follow–up with LT ended after the first hour. Subsequent follow–up observations were triggered manually on both the LT and FTN (Table 1). Magnitudes in and have been calibrated using the SDSS DR3 photometric database222http://cas.sdss.org/astro/en/tools/chart/navi.asp. We obtained a consistent calibration using Landolt standard field stars (Landolt, 1992), for which Smith et al. (2002) provide SDSS calibration. For the and filters, we calibrated with Landolt standard field stars. The zero-points were stable during the night and fully consistent with the photometric values. This is also confirmed by the Carlsberg Meridian Telescope at La Palma333http://www.ast.cam.ac.uk/dwe/SRF/camc_extinction.html. Finally we corrected for the airmass and Galactic extinction. The Galactic extinction (Schlegel et al., 1998) towards GRB 050502a is low: . We evaluated the extinction in the other filters following Cardelli et al. (1989): , and . Magnitudes have been converted into flux densities (mJy) following Fukugita et al. (1995).
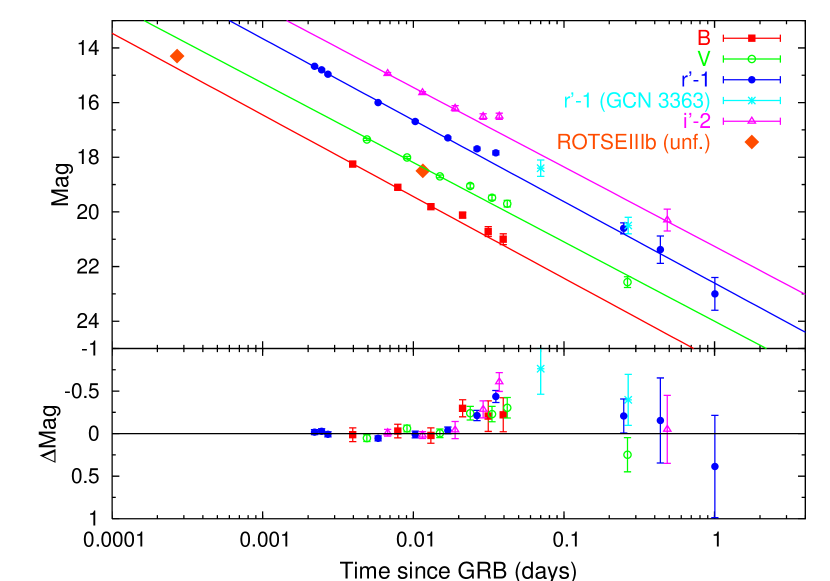
Figure 2 shows the multi–color light curve acquired by the LT during the first hour and the later points with both LT and FTN. An achromatic bump rising at d is evident. Fitting each light curve with a power law of the form , and excluding points d d, we obtain power–law indices consistent across all bands: , , , . By fitting only the points obtained during the detection mode within 3.8 min of the GRB onset time, we get a power–law index of , consistent with the slopes reported above.
Figure 3 shows the rest–frame Spectral Energy Distribution (SED) at two epochs: before the bump ( d), where no strong evidence for significant color change is observed (see Fig. 2), and at the bump ( d). Optical fluxes have been obtained by interpolation. During the bump, a linear interpolation between consecutive points has been adopted, considering that the variability timescales are much larger than the time difference between the pairs of data points used for interpolation. Moreover, we back-extrapolated to d a Swift X–ray upper limit determined around 1.3 d (Hurkett et al., 2005), assuming a power–law decay, , and two different slopes: i) (solid arrow in Fig. 3); ii) (dashed arrow in Fig. 3). The reasons for these choices are clarified in Sec. 3. In case (i) the power–law index between optical and X–rays must be: ; in case (ii) it must be: . However a word of caution is needed, particularly because we know from the Swift observation that during the first few hundred seconds the early X–ray afterglows can be characterized by a steep decline followed by a shallower decay (Tagliaferri et al., 2005). The back-extrapolation for the radio upper limits provided by van der Horst et al. (2005) between 0.6 d and 1.1 d is much more difficult, given that in general the behavior of the early radio afterglow is likely to be very different from the optical one. Hereafter, we do not consider these radio limits.
We note a possible marginal reddening of the spectrum at the time of the bump (see bottom panel of the inset in Fig. 3), albeit not statistically significant: the flux ratio between the bump and the pre-bump epochs does not vary significantly for different optical bands (see also GRB 000301C, Masetti et al. 2000). Due to the high , the Lyman- forest suppresses both and band fluxes. This accounts for the unusually-steep SED in the optical: by fitting all the four points with a power law, , the index is around with a poor (). However, if we assume a standard value of (see Sec. 3), we find that the flux deficiency at high can be ascribed to the Lyman- forest (see the top panel of the Inset in Fig. 3).
3. Discussion
The reality of the bump we find in the light curve at d is also supported by a rebrightening observed in the IR (Blake & Bloom, 2005): initially they observed a decay of 1.1 mag in the band between 47 min and 94 min (corresponding to a power–law decay index of , no error reported), followed by a rebrightening of between 94 min (0.065 d) and 121 min (0.084 d). In addition to our measurements, Fig. 2 also shows two unfiltered points by ROTSE–IIIb (Yost et al., 2005) and two other measures reported by Mirabal et al. (2005), which we converted to assuming (no uncertainty was reported, so we assumed the systematic of 0.3 of the USNO–B1.0 magnitudes, as they calibrated with a USNO–B1.0 field star). In particular, the latter points seem to confirm the presence of the bump in , despite the large uncertainties. Durig et al. (2005) report unfiltered observations of the bump. Since the conversion of unfiltered to standard magnitudes requires some assumptions and implies large uncertainties, we are not as confident about the proper intercalibration of those converted magnitudes and our data as we are at earlier epochs, when the decay is simply monotonic. Therefore, lacking a comparison dataset of unfiltered data covering both the monotonic early decay and the bump, we have not included Durig et al. (2005) data in Fig. 2.
Following Lazzati et al. (2002), if we interpret the bump as due to density variations of the ISM, this is possible only if the observation occurred at a frequency (let be the frequency of our optical bands) below the cooling break and above the peak synchrotron frequency : . In the following we consider the two cases of uniform ISM and wind environment, respectively.
In the case of uniform ISM, the expected power–law index of the light curve is , where is the electron energy distribution index (Sari et al., 1998). From our measure of we derive . We also note that when crosses the optical band we should expect a steepening in the light curve of . Since we do not find evidence for this before d, the only possibility is that at least until 1 d. The energy spectrum at frequency is a power law with index , i.e. . Figure 3 shows that this is consistent with our result. The cooling break must lie between the optical band and the X–ray : . The power–law index of the spectrum between and is expected to be . The X–ray power–law decay index, , is expected to be: (), after has crossed the X–ray band (), thus experiencing a steepening of . As this is expected to occur soon after the GRB, it is sensible to back-extrapolate the X–ray upper limit assuming for most of the time . From Fig. 3, as long as we assume the validity of the X–ray upper limit back-extrapolated to d assuming (solid arrow), we find that the shallowest power–law index allowed between optical and X–rays is . Thus, this is consistent with a broken power law with power–law indices from to . In summary, we conclude that the case of a uniform ISM is fully consistent with our observations.
In the case of wind environment and we must use the relation by Dai & Cheng (2001) for , which yields . The case of is incompatible with the data: from the relation by Chevalier & Li (1999) we derive a value of . From and , holding for and for , respectively, we derive: and . Concerning the back-extrapolation of the X–ray upper limit, is expected to be: (), after has crossed the X–ray band (), thus experiencing a steepening of . For the same reason as in the previous case, it is reasonable to assume for most of the time. The consequent limit on the spectrum is (dashed arrow in Fig. 3). This is compatible only with . Furthermore, should be very close to the optical bands: this implies that during our observation should cross the optical bands, producing a slope change in the power–law decay of , which is not observed. If we assume that for most of the time between d and the epoch of the X–ray observation ( d), we derive the X–ray upper limit assuming , yielding , which is not consistent with .
In contrast to GRBs 990123 and 021211, we find no evidence for a change in the temporal slope within the first few minutes of the onset of GRB 050502a, ruling out a transition from reverse to forward shock emission at this time. In GRB 050502a the bump rises at 6 min after the GRB in the rest-frame, to be compared with 0.5 min and 2.7 min of GRB 990123 and GRB 021211, respectively, when the above transition between reverse and forward shocks is supposed to occur. Should GRB 050502a have exhibited a similar transition, we should have detected it before the bump. We conclude that, despite the fact that a wind environment cannot be ruled out, the uniform ISM with clumps in density seems to better account for our observations.
The interpretation of the bump as the result of a refreshed shock catching up with the afterglow front shock seems more problematic, even if it cannot be ruled out. In fact, according to the original refreshed-shocks scenario (Kumar & Piran, 2000; Granot et al., 2003), we should expect that the duration of the bump is comparable with its start time: . In the case of GRB 050502a our measures and those by Mirabal et al. (2005) show that, in spite of the uncertainty, d and d. Following Kumar & Piran (2000), the impact between the two shells should produce a forward shock in the outer shell responsible for the bump and a reverse shock propagating in the inner shell. If and are the energy of the outer and inner shells, respectively, the increase in the emission due to the forward shock is expected to be . From Fig. 2 we measure a flux increase of (); from we obtain . The spectrum at the bump is expected to have two peaks: the lower peak is due to the reverse shock in the inner shell and its frequency should be times lower than the peak frequency of the outer shell, i.e. , which we know is below the optical bands at the time of the bump ( is the Lorentz factor of the outer shell at the time of impact). The increase of emission at this frequency due to the inner shell is expected to be a factor . Thus, the bump should have been more evident at low frequency: , i.e. IR or radio. Unfortunately, the lack of early radio observations prevents this prediction from being tested. In the -band Blake & Bloom (2005) report a rebrightening of mag, which however seems smaller than that observed by us in the optical. Moreover, according to Blake & Bloom (2005) the -band rebrightening occurs between 0.065 d and 0.084 d, i.e. later than 0.02 d of the optical bands.
In conclusion, although the refreshed-shock scenario cannot be completely ruled out due to the lack of early radio observations, our observations appear to be more difficult to reconcile with its predictions than with those of the variable density environment.
References
- Akerlof et al. (1999) Akerlof, C., et al. 1999, Nature, 398, 400
- Björnsson et al. (2004) Björnsson, G., Gudmundsson, E. H., & Jóhannesson, G. 2004, ApJ, 615, L77
- Blake & Bloom (2005) Blake, C., & Bloom, J. S. 2005, GCN Circ. 3327
- Cardelli et al. (1989) Cardelli, J. A., Clayton, G. C., & Mathis, J. S. 1989, ApJ, 345, 245
- Chevalier & Li (1999) Chevalier, R. A., & Li, Z.-Y. 1999, ApJ, 520, L29
- Dai & Cheng (2001) Dai, Z. G., & Cheng, K. S. 2001, ApJ, 558, L109
- Durig et al. (2005) Durig, D.T., et al. 2005, GCN Circ. 3340
- Fukugita et al. (1995) Fukugita, M., Shimasaku, K., & Ichikawa, T. 1995, PASP, 107, 945
- Fynbo et al. (2005) Fynbo, J. P. U. et al. 2005, ApJ, in press, preprint (astro-ph/0506101)
- Gomboc et al. (2005a) Gomboc, A., et al., 2005a, Proc. of the 4th Workshop Gamma–Ray Bursts in the Afterglow Era, Rome, 2004, Eds: Piro, L., Amati, L., Covino, S., & Gendre, B., Il Nuovo Cimento, in press, preprint (astro-ph/0502505)
- Gomboc et al. (2005b) Gomboc, A., Steele, I. A., Monfardini, A., Mottram, C. J., Guidorzi, C., Bode, M. F., & Mundell, C. G. 2005b, GCN Circ. 3325
- Gomboc et al. (2005c) Gomboc, A., et al., 2005c, Proc. of the 4th Workshop Gamma–Ray Bursts in the Afterglow Era, Rome, 2004, Eds: Piro, L., Amati, L., Covino, S., & Gendre, B., Il Nuovo Cimento, in press, preprint (astro-ph/0502506)
- Götz et al. (2005) Götz, D., Mereghetti, S., Mowlavi, N., Shaw, S., Beck, M., & Borkowski, J. 2005, GCN Circ. 3323
- Götz & Mereghetti (2005) Götz, D., & Mereghetti, S. 2005, GCN Circ. 3329
- Granot et al. (2003) Granot, J., Nakar, E., & Piran, T., 2003, Nature, 426, 138
- Holland et al. (2003) Holland, S. T. et al. 2003, AJ, 125, 2291
- Holland et al. (2004) Holland, S. T. et al. 2004, AJ, 128, 1955
- van der Horst et al. (2005) van der Horst, A. J., Wijers, R. A. M. J., & Wiersema, K. 2005, GCN Circ. 3341
- Hurkett et al. (2005) Hurkett, C., Page, K., Osborne, J. P., Zhang, B., Kennea, J., Burrows, D. N., & Gehrels, N. 2005, GCN Circ. 3374
- Kumar & Piran (2000) Kumar, P., & Piran, T. 2000, ApJ, 532, 286
- Landolt (1992) Landolt, A. U., 1992, AJ, 104, 340
- Lazzati et al. (2002) Lazzati, D., Rossi, E., Covino, S., Ghisellini, G., & Malesani, D. 2002, A&A, 396, L5
- Masetti et al. (2000) Masetti, N. et al. 2000, A&A, 359, L23
- Mirabal et al. (2005) Mirabal, N., Boettcher, M., Shields, J., Joshi, M., & Halpern, J. P. 2005, GCN Circ. 3363
- Nakar et al. (2003) Nakar, E., Piran, T., & Granot, J. 2003, New A, 8, 495
- Prochaska et al. (2005) Prochaska, J. X., Ellison, S., Foley, R. J., Bloom, J. S., & Chen, H.-W. 2005, GCN Circ. 3332
- Rykoff et al. (2004) Rykoff, E. S. et al. 2004, ApJ, 601, 1013
- Sari et al. (1998) Sari, R., Piran, T., & Narayan, R. 1998, ApJ, 497, L17
- Schlegel et al. (1998) Schlegel, D. J., Finkbeiner, D. P., & Davis, M. 1998, ApJ, 500, 525
- Smith et al. (2002) Smith, J. A. et al. 2002, AJ, 123, 2121
- Tagliaferri et al. (2005) Tagliaferri, G. et al. 2005, Nature, in press, preprint (astro-ph/0506355)
- de Ugarte Postigo et al. (2005) de Ugarte Postigo, A. et al. 2005, A&A, in press, preprint (astro-ph/0506544)
- Vestrand et al. (2005) Vestrand, W. T. et al. 2005, Nature, 435, 178
- Yost et al. (2005) Yost, S. A., Swam, H., Schaefer, B. A., & Alatalo, K. 2005, GCN Circ. 3322

| Telescope | Filter | Start aaThis corresponds to the time delay with respect to the GRB trigger time, UT. | Exposure | Mag. | Comment |
|---|---|---|---|---|---|
| (min) | (s) | ||||
| LT | SDSS-R | 3.1 | 10 | detection mode | |
| LT | SDSS-R | 3.5 | 10 | detection mode | |
| LT | SDSS-R | 3.8 | 10 | detection mode | |
| LT | Bessell-B | 5.4 | 30 | multi-color sequence | |
| LT | Bessell-V | 6.7 | 30 | multi-color sequence | |
| LT | SDSS-R | 8.1 | 30 | multi-color sequence | |
| LT | SDSS-I | 9.5 | 30 | multi-color sequence | |
| LT | Bessell-B | 10.8 | 60 | multi-color sequence | |
| LT | Bessell-V | 12.6 | 60 | multi-color sequence | |
| LT | SDSS-R | 14.3 | 60 | multi-color sequence | |
| LT | SDSS-I | 16.1 | 60 | multi-color sequence | |
| LT | Bessell-B | 17.8 | 120 | multi-color sequence | |
| LT | Bessell-V | 20.6 | 120 | multi-color sequence | |
| LT | SDSS-R | 23.4 | 120 | multi-color sequence | |
| LT | SDSS-I | 26.2 | 120 | multi-color sequence | |
| LT | Bessell-B | 29.1 | 180 | multi-color sequence | |
| LT | Bessell-V | 32.9 | 180 | multi-color sequence | |
| LT | SDSS-R | 36.6 | 180 | multi-color sequence | |
| LT | SDSS-I | 40.4 | 180 | multi-color sequence | |
| LT | Bessell-B | 44.2 | 120 | multi-color sequence | |
| LT | Bessell-V | 47.0 | 120 | multi-color sequence | |
| LT | SDSS-R | 49.8 | 120 | multi-color sequence | |
| LT | SDSS-I | 52.6 | 120 | multi-color sequence | |
| LT | Bessell-B | 55.3 | 180 | multi-color sequence | |
| LT | Bessell-V | 59.1 | 180 | multi-color sequence | |
| FTN | Bessell-R | 348 | 4x200 | late follow-up | |
| FTN | Bessell-V | 370 | 6x200 | late follow-up | |
| FTN | Bessell-R | 620 | 4x200 | late follow-up | |
| FTN | SDSS-I | 690 | 4x200 | late follow-up | |
| LT | SDSS-R | 1340 | 24x150 | late follow-up |
.