The extended H emitting filaments surrounding NGC 4696, the central galaxy of the Centaurus cluster
Abstract
We present images of NGC 4696, the central galaxy in the Centaurus cluster, showing the large extent of cool filaments which are bright in H line emission. These filaments share the detailed structure of both the central dust lane and the inner regions of the arc-like plumes seen in soft X-ray emission. The X-ray gas is at its coolest, and most absorbed in this same region. The smoothness of the features implies that the local environment is not strongly turbulent. We suggest that these filaments are either shaped by confinement due to a strong magnetic field, or by bulk flows within the intracluster medium. We propose that like similar filamentary systems in the core of clusters, these cooler components have been drawn out of the central galaxy behind buoyant gas bubbles from previous episodes of radio activity. We find a spur of low-frequency radio emission leading to a region of low X-ray pressure within the intracluster medium supporting this interpretation.
keywords:
galaxies: clusters: individual: Centaurus, NGC 4696 X-rays: galaxies: clusters1 Introduction
NGC 4696 is the central dominant galaxy of the rich, nearby Centaurus cluster of galaxies (A3526), lying at a redshift of . Line-emitting filaments were first discovered to extend out to the south-west of the galaxy over twenty years ago by Fabian et al (1982). NGC 4696 has also been long-known to harbour a distinctive dust lane sweeping around the core of the galaxy to the south and west (Shobbrook 1966; Jorgensen et al 1983; Sparks, Macchetto & Golombek 1989; Laine et al 2003). There is a close spatial correspondence between the structure in the extended line emission and the dust lane (Sparks et al 1989). Neutral gas has been detected as sodium D in absorption against the galaxy stellar continuum, and is assumed to be associated with the emission line system and dust lane (Sparks, Carollo, Macchetto 1997). High-resolution optical (HST) images show that the galaxy has a double morphology within the central arcsecond, presumably due to the active nucleus (Laine et al 2003).
NGC 4696 hosts the small steep-spectrum FR I-type radio source PKS 1246–410, which has a morphology distorted by confinement by the surrounding intracluster medium. The two radio lobes to the east and west of the core are compact, and sweep down to the south; they have excavated small cavities in the X-ray gas (Taylor, Fabian & Allen 2002; Taylor et al 2005).
The X-ray emission from the surrounding cluster is consistent with cooling flow of around ten solar masses a year (Sanders & Fabian 2002; Allen et al 2001; Ikebe et al 1999). Within an arcminute of the central cluster galaxy, the X-ray emission is disturbed, showing not only the radio cavities but also excess soft emission in the form of plume-like features that sweep from the south of the central cluster galaxy to trail out and off to the north-east (Sanders & Fabian 2002, Fabian et al 2005). The origin of these features is not known; the gas within the plumes is the same metallicity as, but cooler than the surrounding intra-cluster medium.
In this paper we present ground-based data and archival HST data with the aim of examining in detail the relationship between the dust lane, the optically-emitting filaments, the soft X-ray plumes, X-ray absorbing gas and central radio source. Throughout the paper we assume the cosmology of , and , for which 1 arcsec corresponds to 0.21 kpc at the distance of 44.3 Mpc for NGC 4696.
2 X-ray data
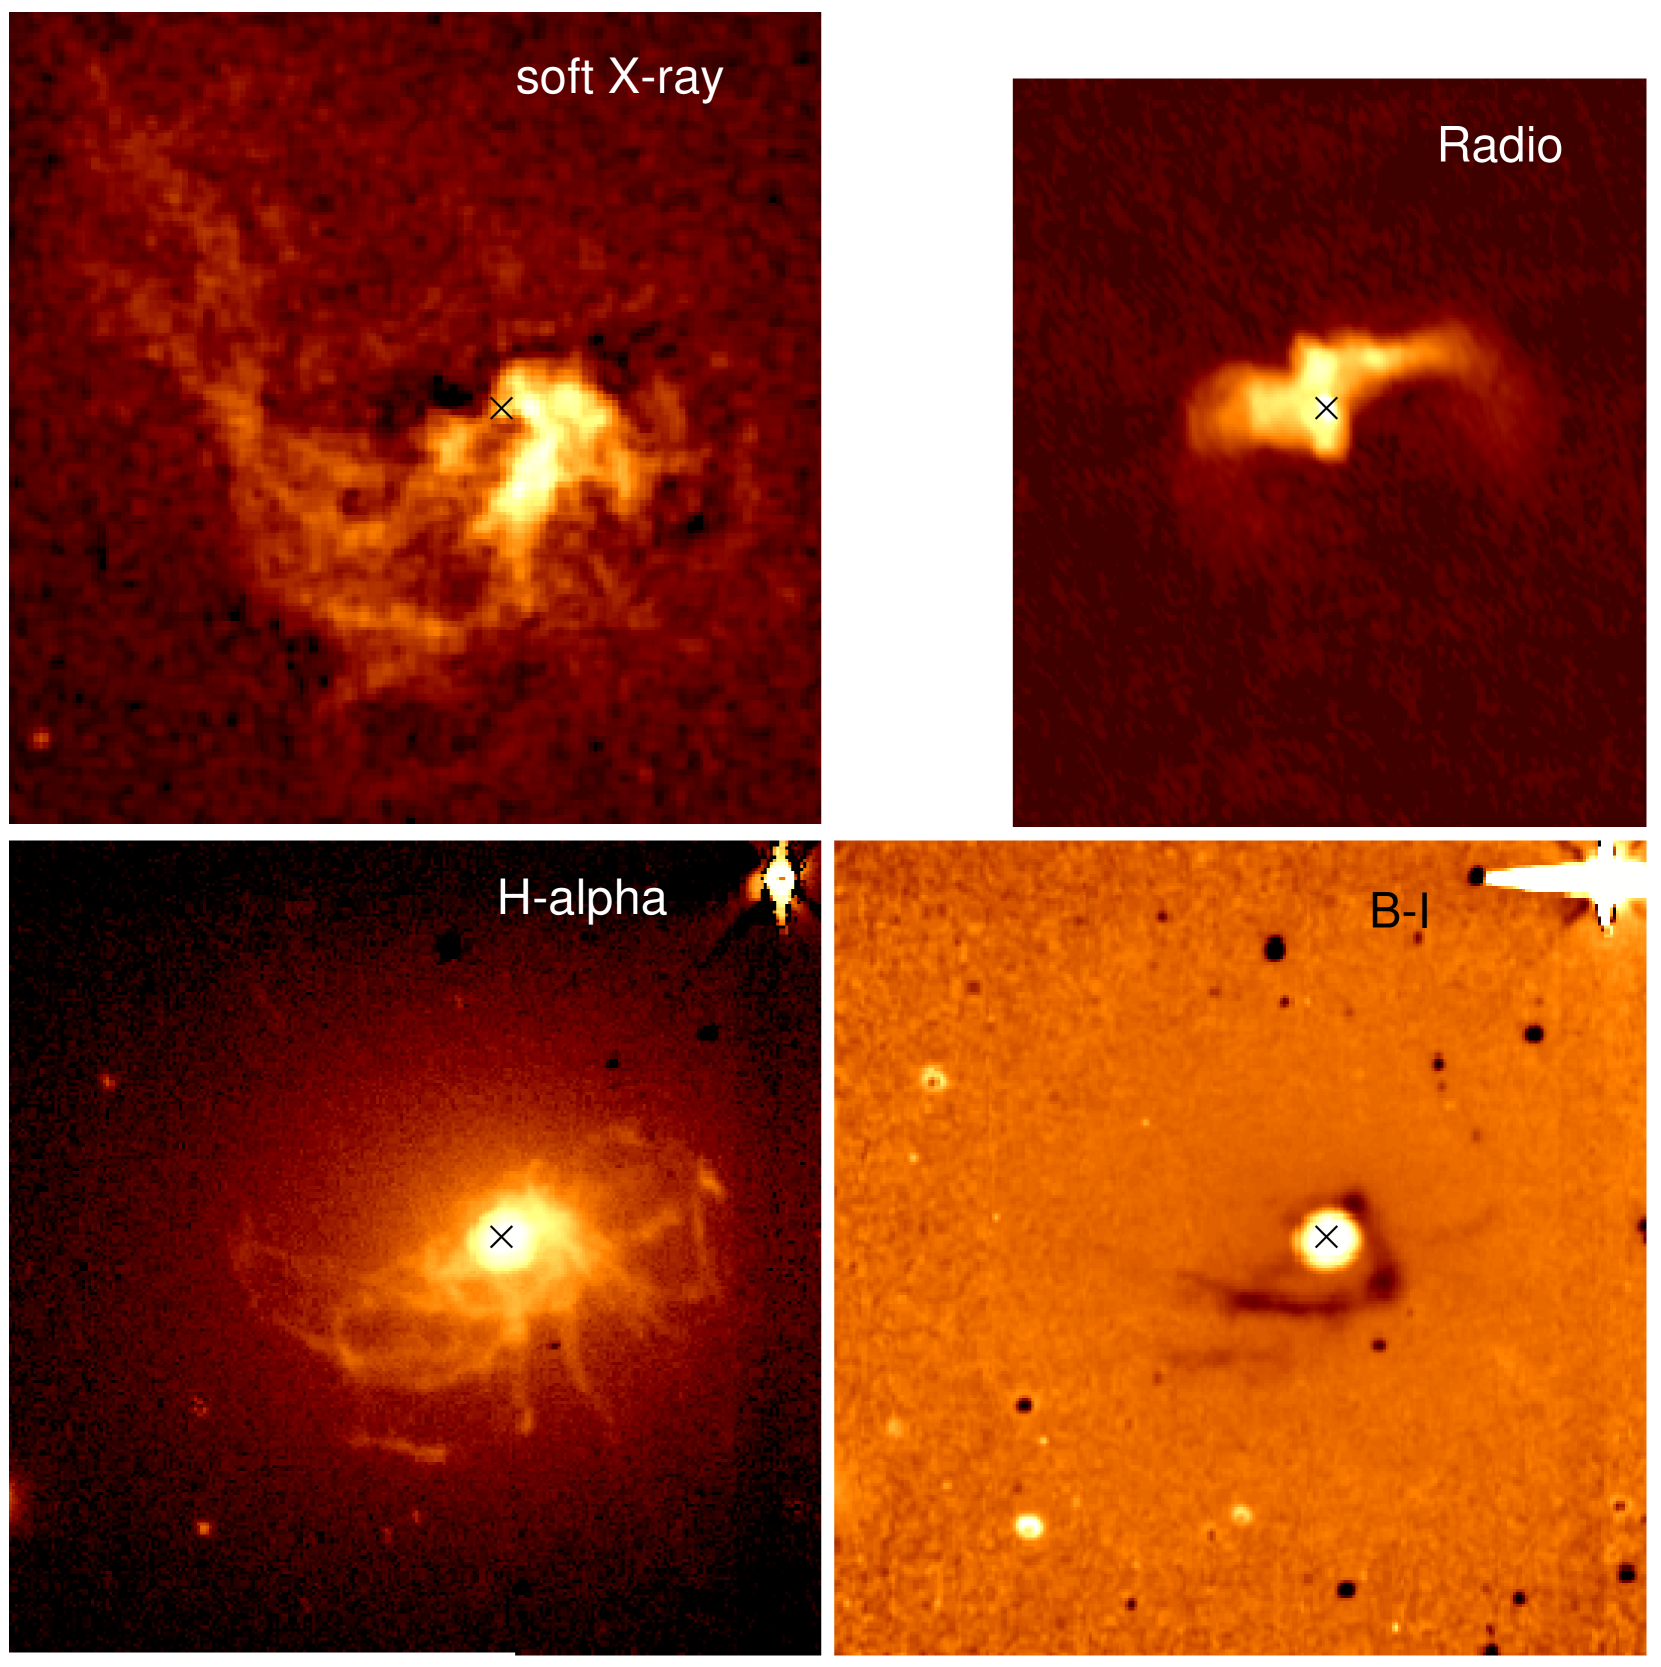
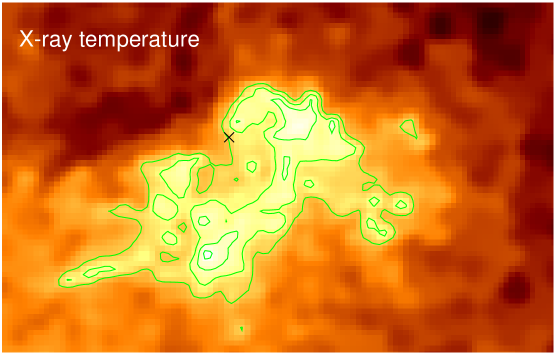
X-ray analysis was undertaken using the 199 ksec Chandra Centaurus dataset of Fabian et al (2005). The complicated structures in the soft X-ray emission (the radio cavities and the plumes), and the X-ray temperature map from these data are shown for reference in the first panels of Figs 1 and 2.
Regions containing counts between 0.5 and 7 keV were selected, using the bin accretion tessellation algorithm of Cappellari & Copin (2003). Spectra were extracted from each of the regions from each of the datasets, and were added together to form a total spectrum. A blank sky spectrum was obtained from a blank sky observation, tailored to the Centaurus observations, and extracted from a similar region of CCD to that of the regions examined. Responses and ancillary responses were generated for each of the regions and datasets using the standard CIAO mfwarf and mkacisrmf tools. The responses and ancillary responses for each of the datasets for a particular region were then averaged together, weighted according to the fraction of counts in a particular dataset for that region. The spectra were fit between 0.5 and 7 keV using a mekal emission model (Mewe, Gronenschild & van den Oord 1985; Liedahl, Osterheld & Goldstein 1995) absorbed with a phabs model (Balucinska-Church & McCammon 1992), minimising the C statistic (Cash 1979).
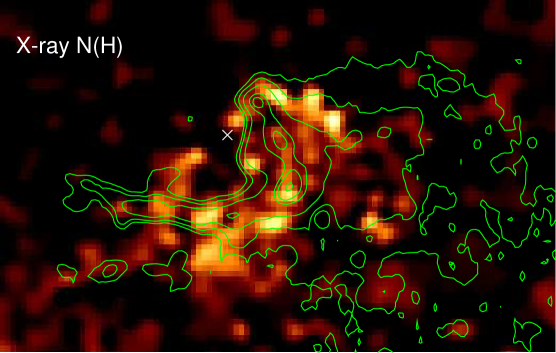
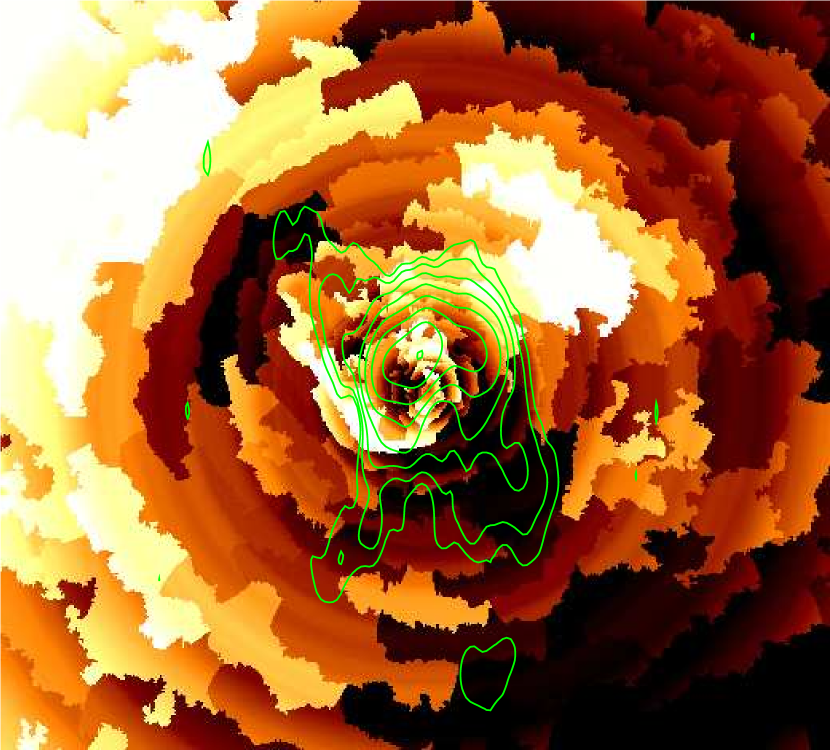
Values of the column density (NH) inferred vary from the Galactic column (around ) up to 5 ; the resulting column density distribution in the X-ray gas around NGC 4696 is shown in Fig 2. The statistical errors are around 5-10 per cent in regions where the NH is high, although there may be further errors from the approximation of fitting single temperature models in a region where there is evidence for multi-temperature gas. Although we applied a correction to the ancillary responses for the build up of contaminant at low energies on the ACIS-S3 detector, there may still be residual systematic uncertainties in the calibration here. We expect the relative trends in to be correct, even if the absolute normalisation is not. In addition we are concentrating on data taken from the centre of the CCD, well away from the edges where the contaminant is more significant.
An analogue to the X-ray thermal gas pressure in the intracluster medium was created by multiplying the X-ray temperature as a function of position by the square root of the emission measure per unit area. These were measured by fitting a mekal spectral model to X-ray spectra extracted from spatial regions. The spatial regions were chosen to contain approximately counts in total using a contour binning algorithm (Sanders in preparation). The method takes a smoothed X-ray image and chooses bins which group together pixels of similar smoothed flux. Here the raw X-ray image was smoothed using a top-hat circular kernel with a size which varied to ensure there was a signal to noise of 30 within the kernel, or over 900 counts. Starting from the brightest smoothed pixel, neighbouring pixels closest in smoothed flux to the original pixel are added to a bin until the signal to noise calculated from the unsmoothed data exceeds a threshold value (here 100). When this threshold is reached a new bin is created. An additional geometric criterion is used to ensure the bins are not too elongated. A pixel is not added if it lies at a distance of greater than 1.9 times the radius of a circle with the same area as the bin from the bin centroid. In order to look at deviations from symmetry within the X-ray gas surrounding NGC 4696, we calculated the mean value of the pressure analogue at each radius, and subtracted it from the pixels at that radius. The resulting map of relative thermal pressure are discussed later in context in section 6.
3 Ground-based Optical Observations
Optical observations of NGC 4696 were taken with the ESO Multi-Mode Instrument (EMMI) on the 3.58 m New Technology Telescope at La Silla, Chile on the nights of 2004 April 11 and 2004 May 20. Images were taken through the broadband (ESO #610) and (ESO #603) filters, and a narrowband H filter centred on with a full-width at half-maximum of 66 (ESO #597). The narrow-band filter covers the wavelength of the H emission line at the redshift of NGC 4696, but only allows in around half of the redshifted [Nii] line emission (although all of the weaker [Nii] line). Assuming a ratio of [NII]/H of 3.2 (consistent with Johnstone, Fabian & Nulsen 1987 and Lewis, Eracleous & Sambruna 2003), we obtain H-only fluxes assuming by dividing the observed (continuum-subtracted) line fluxes by three. The seeing conditions were constant at around 0.9 arcsec for both the - and H-band observations, and at around 1.2 arcsec for the -band observation.
The -band (taken as 5330 s exposures) and H images (7700 s+1680 s) were observed using the Red Imaging and Low Dispersion Spectroscopy (RILD) mode of EMMI, which has a field of view of square arcminutes. The EMMI Red 2K4K CCD detector has a pixel size of . The -band images (taken as 21100 s+11050 s exposures) were observed using the Blue Imaging Mode (BIMG), which has a square arcminute field of view, and a 1K1K Blue CCD detector with a pixel size of . Multiple bias frames and dome flat-fields were taken on each of the observing nights, as well as the Landolt standard star field PG1525 in all three bands, and the spectroscopic standards LTT 7379 and LTT 6248, in the -band and narrow-band H only. A summary of the observations is given in Table 1.
| Target | Filter | Seeing | Total Integration | pixel size |
|---|---|---|---|---|
| (ESO filter number) | arcsec | time (seconds) | (arcsec) | |
| NGC 4696 | I (ESO #610) | 0.9 | 1650 | 0.333 |
| NGC 4696 | H (ESO #597) | 0.9 | 5580 | 0.333 |
| NGC 4696 | B (ESO #603) | 1.15 | 3250 | 0.37 |
3.1 Data Reduction
The observations were bias-subtracted, flat-fielded, and normalised to a 1 second exposure time. The sky background was then removed from all NGC 4696 images by subtracting the mode of the background pixels furthest from the galaxy.
In order to flux-calibrate a galaxy-subtracted image of the H filaments, both the H and -band images were flux-calibrated from observations of the spectroscopic standards LTT 7379 and LTT 6248; the reference spectra of these standards are provided by Hamuy et al (1992). The observed spectra of the flux standard stars were convolved with the filter transmission functions to obtain an average calibrated flux of 1.25 erg s-1 cm-2 (counts s-1)-1 for the H image and 1.09erg s-1 cm-2 (counts s-1)-1 for the -band image. The -band image was divided by 35.9 to account for the difference between the -band and H filter transmission functions. The continuum was removed from the H image by subtracting the normalised -band image. Finally, the image was corrected for Galactic extinction assuming a Galactic E(B-V)=0.115 (AB=0.46) (Burstein & Heiles 1984) which increased the observed H flux by 33 percent.
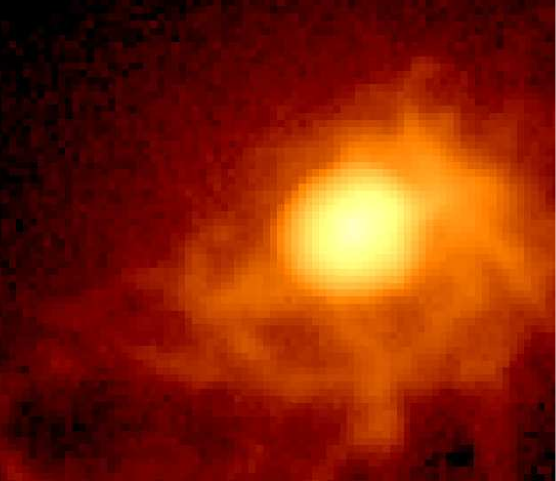
A colour image was also created to map out the distribution of the absorbing dust. The difference in pixel sizes required the -band image to be rebinned using the IRAF ‘drizzle’ program in order to make it compatible with the -band image. The -band image was divided by 2.4 to account for the difference between the - and -band filter transmission functions. To calibrate this image, both the - and -band filter images were flux-calibrated using the Landolt Standard field PG1525. Inspection of the colour image suggests that the Northeast quadrant of the galaxy is the least affected by dust absorption (although not entirely unaffected). We thus assume the intrinsic colour of the underlying galaxy can be best estimated as the average colour of the galaxy in this region, and subtract this from the individual - and -band images. The final continuum-subtracted H image is shown along with the colour map in Fig 1.
3.2 Dust absorption analysis
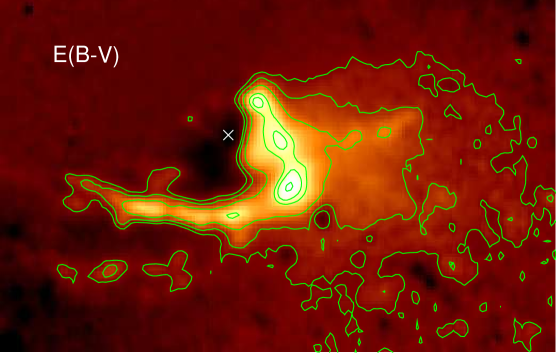
In order to determine the absolute levels of extinction we create an intrinsic galaxy model, assuming it follows the galaxy profile in the north-east quadrant and extending this into a azimuthally symmetric form for each of the and -band images. The model galaxy was Gaussian smoothed by two pixels and then subtracted from the - and -band images to create and extinction maps. These were transformed to maps of E(B-V) (eg Fig 2) assuming , (Zombeck 1992)
Due to the higher sensitivity of the -band to extinction, and the fact that the -band image is affected by saturation of the bright nuclear regions, we take the image as the more accurate representation of the extinction in the galaxy. Table 2 gives a quantitative description of the information from the –band image in Fig 2. The estimated column density, (HI+H2) assumes the same relation between column density and reddening as for our own Galaxy, as given by Bohlin, Savage, and Drake (1978), as (HI+H2).
| Extinction | Area | Estimate Hydrogen |
|---|---|---|
| (arcsec2) | Column Density () | |
| 0.010.02 | 310 | 8.5 |
| 0.020.04 | 135 | 1.7 |
| 0.040.08 | 65 | 3.5 |
| 0.080.1 | 14 | 5.2 |
| 0.10.14 | 7 | 6.9 |
4 Archival HST Observations
Three datasets of NGC 4696 were extracted from the HST archive. These are taken through the F555W (WFPC2 -band), F702W (WFPC -band) and F814W (WFPC -band) filters; the observations used are shown in Table 3. The dust lane is visible in all the data, and has been briefly remarked upon previously by Laine et al (2003). We attempt here to obtain a combined image that shows the dust lane structure in much more detail. The two raw frames in each band were co-added to remove cosmic rays, and the three resulting images summed to form an all-band image (after appropriate shifting of the F814W data to match the other datasets).
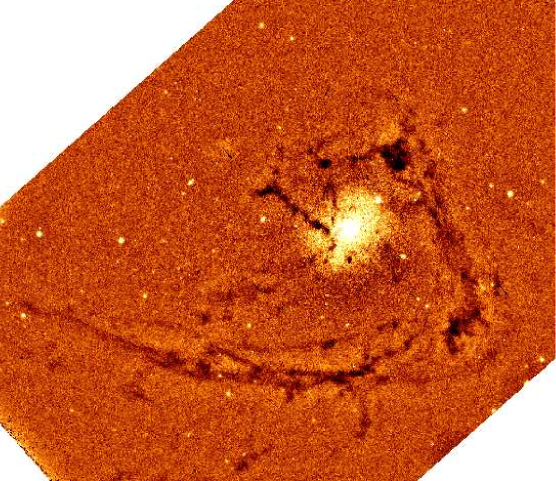
The summed image was unsharp-masked in order to reveal the dust lane, by subtracting from this image a version of itself Gaussian-smoothed by 13 pixels (corresponding to 0.6 arcsec). The unsharp-masked image shows considerable further structure in the dust absorption features at high resolution and is shown in Figure 3.
Our combined HST image confirms the double nucleus in the core of the galaxy (Laine et al 2003), with two components separated by 0.3 arcsecond along the north-east:south-west direction, and the brighter to the north-east.
| Name | Exposure | Filter |
|---|---|---|
| (sec) | ||
| U3560101B | 320 | F555W |
| U3560103B | 320 | F702W |
| U62G8401B | 1000 | F814W |
5 Results
5.1 Absorbing dust and gas
Both the EMMI (Fig 1) and HST (Fig 3) data show the primary dust lane structure in the form of the ‘horseshoe’ shape extending anti-clockwise from the south-east round to the north-west, as described by Jorgensen et al (1983). Both datasets also clearly show fainter, further structures such as a secondary lane to the south-east, about twice as far from the nucleus as the main dust lane and a radial lane to the west, again beyond the main dust lane structure. Such features were hinted at in the image of Sparks et al (1989).
However, the more detailed structure in the HST image now shows the horseshoe shape to appear more as a full spiral around the core, continuing further round the north and into a radial feature extending from the north-east into the centre of the galaxy at around 60 degrees east of north – the lane almost entirely encircles the nucleus (Fig 3). There are further radial structures near the core of the galaxy, at 20 and 120 degrees east of north (the latter is also apparent in the EMMI image). The HST data clearly resolve the main dust lane into an elongated network of several thin (ie spatially unresolved in the HST) filaments.
Our highest values for the extinction lie in the three prominent knots along the main dust lane, each with , in good agreement with estimates obtained by Jorgensen et al (1983), Sparks et al (1989) and Wills et al (2004).
The maps of the X-ray absorption column density and temperature (Fig 2) reveal that NH is highest, and the X-ray gas is coolest in a region that is a similar in extent and shape to that encompassed by the dust lane. The positions of discrete blobs of high extinction within the dust lane, however, do not seem to correspond in detail with the highest regions of X-ray absorption (right hand panel of Fig 2). Typical X-ray temperatures are 0.6-0.7 keV and column densities in this region vary between 2-5. Given the foreground X-ray absorption due to our Galaxy in the direction of Centaurus is , the values of excess (H) compare very well to those predicted from the optically-derived E(B-V) in Table 2. This suggests that the dust-to-gas ratio in this region is not very different from that in our Galaxy.
5.2 The structure of the H filaments
The narrow-band imaging resolves the emission-line nebula into a complex network of filaments extending primarily from the south-east through south to the west of the galaxy. At its widest, the nebula is approximately 1 arcminute across (corresponding to just over 12 kpc). The width of the H filaments is, at 0.9 arcsecond, spatially unresolved (0.2 kpc).
Filaments within 8 arcsecond of the radio core have a typical surface brightness of 3.5, whereas the outer filaments that stretch to over 27 arcsecond distant are fainter at 1.4. We correct for the contamination by the [NII] doublet in our filter, but an accurate estimate of the total H luminosity of the entire nebula is complicated by the saturation of the central regions in the -band image; a lower limit is obtained by excluding the central saturated regions to give a total H luminosity beyond a radius of 3.5 arcsec (0.75 kpc) of L1.5. The intrinsic luminosity (ie that not absorbed by the dust lanes) will be higher.
There is a clear and close spatial correspondence between the emission-line filaments and the inner regions of the long plumes of soft X-ray emission (Figs 1 and 4). They directly overlap where the radial filaments stretch south of the galaxy and where the three main filaments sweep to the south-east. The H filaments also seem to encircle the western radio lobe, outlining the X-ray cavity there (Fig 4). Apart from this region, most of the X-ray and H structures lie south of the diffuse radio emission.
The inner H filaments also directly trace the structures of the dust lane as seen in the HST and ground-based images (Figs 1 and 3), including such details as the radial spur at 120 degrees east of north, the faint western structure, and the fainter more southerly dust arm. The H also is encompassed in the coolest regions of the X-ray emission, and highest regions of X-ray-inferred column density.
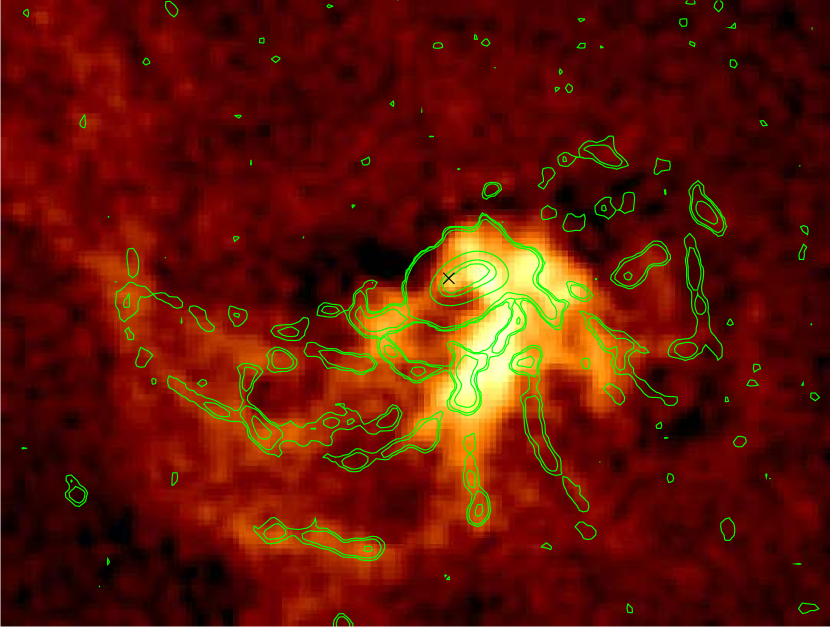
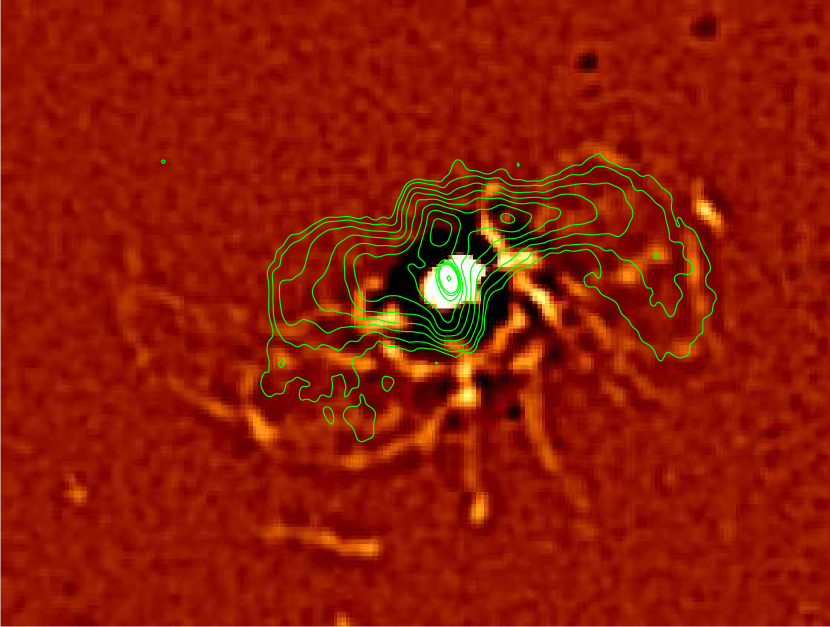
Right: Contours of the 5 GHz radio emission superposed on the unsharp-masked H line emission image of NGC 4696. The images are 6852 arcseconds The black cross in the left hand panel marks the position of the radio source core.
6 Discussion
The arc structures seen in both X-ray and the optical line emission are smooth, and like those seen in Perseus and A 1795 (Conselice et al 2001; Fabian et al 2003; Fabian et al 2001; Crawford, Sanders & Fabian 2005) show no indication on small (kiloparsec and less) scales of surrounding turbulence. This smoothness, and the fact that the dust lanes, emission-line and X-ray gas all share the same structure, suggests that these features have been shaped either by a strong magnetic field, or a bulk (and locally laminar) flow within the intracluster medium. Assuming that the filaments lie on the outside of the radio cavities (Fig 4), deeper and higher resolution radio rotation measurements over the region where the radio source and the filaments coincide spatially could quantify the strength of the magnetic field within the filaments.
If the filaments are all shaped by an external bulk flow, the way they appear to spiral out from NGC 4696 suggests that all these components have been dragged out from the central galaxy; the spiral appearance could be exaggerated if the plume is directed towards us. This is also supported by the fact that the densest, and coolest X-ray gas is located in this region (Fig 2). This extraction could be in the wake of a buoyant bubble from a past episode of radio activity in the galaxy. Examples of clusters where this phenomenon is well documented include M87 in Virgo (Böhringer et al 1995; Churazov et al 2001) and NGC 1275 in the Perseus cluster (Fabian et al 2003). The direction of the filaments would suggest that the past or ‘ghost’ bubble should lie to the north-east of the galaxy. There is a spur of low-frequency radio emission in this direction, ending at a noticeable deficit (at around –6 to –13 per cent) in a map of the X-ray-inferred thermal pressure in the intracluster medium (Fig 5). A very marginal deficit in X-ray intensity is seen in the same location. The pressure deficit is centred approximately at RA 12:48:54.0 DEC –41:18:13 J2000), has the thin linear morphology expected from a rising cap bubble, and is tangential to the cluster core. Despite showing up as a sharp dip in the X-ray pressure map it is not apparent in the X-ray temperature map, suggesting the deficit in X-ray emission is due to a true drop in density. Figure 5 also shows that the low-frequency radio emission to the south and south-west of the central cluster galaxy also completely occupies a similar pressure deficit.
The curve of the features (which may be partially due to projection effects) suggests that the bubble has not risen radially. This may be due to the central galaxy not being entirely in dynamical equilibrium with the cluster potential, but still moving around the core (a relative line-of-sight motion of 100-200 is possible: Sanders & Fabian 2002). The way the filaments appear to be pushed southward by the current radio emission (Fig 4) also points to their origin being within the central galaxy.
Although on a much smaller spatial scale, and of considerably lower luminosity, the H and X-ray filaments around NGC 4696 are very similar to those associated with the central galaxies in the Perseus and A 1795 clusters of galaxies. It is thus likely, by comparison to the filaments around Perseus (Hatch et al 2004) that the filaments around Centaurus also contain molecular hydrogen. The source of the excitation and ionization of such filaments is a matter of contraversy, with star formation being one possibility among many (see discussion in Crawford et al 1999, for example).
The X-ray filaments appear broader than the corresponding line-emitting components. We have measured the flux of the bright filament 22 arcsec to the SE of the nucleus. Its surface brightness is about in X-rays (0.1–10 keV, corrected for absorption) and in H (not corrected for intrinsic absorption). The total surface brightness implied by recombination, much of which emerges in the UV, is about 20 times the H brightness, which is still only about half the X-ray value. The filaments in the Centaurus cluster are therefore X-ray bright. In contrast, those in the Perseus cluster (Fabian et al 2003b) are UV bright (with a recombination flux brighter than the X-ray flux by up to two orders of magnitude). This may in part be due to the apparent high dust content of the Centaurus filaments suppressing the observed H flux. A simple equilibrium conduction model applied to the X-ray data from the filaments in the two different clusters implies that conductivity must be suppressed well below the Spitzer rate in the Perseus cluster (Fabian et al 2003b) but would need to be enhanced above the Spitzer rate in Centaurus. Since this last requirement is impossible we deduce that the Centaurus X-ray filaments are either not powered by conduction or represent gas which is out of equilibrium, either cooling down (the radiative cooling time is ) or heating up, perhaps by cool filament gas mixing in with the ambient hotter gas.
Acknowledgments
CSC and ACF thank the Royal Society for financial support, and we thank Greg Taylor for producing the 330MHz image. The archival HST data presented in this paper were obtained from the Multimission Archive at the Space Telescope Science Institute (MAST). STScI is operated by the Association of Universities for Research in Astronomy, Inc., under NASA contract NAS5-26555. Support for MAST for non-HST data is provided by the NASA Office of Space Science via grant NAG5-7584 and by other grants and contracts. The European Southern Observatory (Chile) data were taken under programme ID 073.A-0077. The Gemini Observatory data were obtained under programme ID GS-2004A-Q-79. The Gemini telescopes are operated by the Association of Universities for Research in Astronomy, Inc., under a cooperative agreement with the NSF on behalf of the Gemini partnership: the National Science Foundation (United States), the Particle Physics and Astronomy Research Council (United Kingdom), the National Research Council (Canada), CONICYT (Chile), the Australian Research Council (Australia), CNPq (Brazil) and CONICET (Argentina).
References
- (1) Allen SW,, Fabian AC, Johnstone RM, Arnaud KA, Nulsen PEJ, 2001, MNRAS 322 589
- (2) Balucinska-Church M, McCammon D, 1992, ApJ, 400, 699
- (3) Bohlin RC, Savage BD, Drake JF, 1978, ApJ, 224, 132
- (4) Böhringer H, Nusen PEJ, Braun R, Fabian AC, 1995, MNRAS, 274, L67
- (5) Burstein D & Heiles C, 1984, ApJS, 54, 33
- (6) Cappellari M, Copin Y, 2003, MNRAS, 342, 345
- (7) Cash W, 1979, ApJ, 228, 939
- (8) Churazov E, Brüggen M, Kaiser CR, Böhringer H, Forman W, 2001, ApJ, 554, 261
- (9) Conselice CJ, Gallagher JS, Wyse RFG, 2001, AJ, 122, 2281
- (10) Crawford CS, Allen SW, Ebeling H, Edge AC, Fabian AC, 1999, MNRAS, 306, 857
- (11) Crawford CS, Sanders JS, Fabian AC, 2005, MNRAS in press
- (12) Fabian AC, Atherton PD, Taylor K, Nulsen PEJ, 1982 MNRAS, 201, 17P
- (13) Fabian AC, Sanders JS, Ettori S, Taylor GB, Allen SW, Crawford CS, Iwasawa K, Johnstone RM, 2001, MNRAS, 321, L33
- (14) Fabian AC, Sanders JS, Crawford CS, Conselice CJ, Gallagher JS, Wyse RFG, 2003, MNRAS, 334, L43
- (15) Fabian AC, Sanders JS, Taylor GB, Allen SW, 2005, MNRAS submitted
- (16) Hamuy M, Walker AR, Suntzeff NB, Gigoux P, Heathcote SR, Phillips MM, 1992, PASP, 104, 533
- (17) Hatch NA, Crawford CS, Fabian AC, Johnstone RM, 2005, MNRAS, 358, 765
- (18) Ikebe Y, Makishima K, Fukazawa Y, Tamura T, Xu H, Ohashi T, Matsushita K, 1999, ApJ, 525, 58
- (19) Johnstone RM, Fabian AC, Nulsen PEJ, 1987, MNRAS, 224, 75
- (20) Jorgensen HE, Norgaard-Nielsen HU, Pedersen H, Rasmussen IL, Schnopper H, 1983, A&A, 122, 301
- (21) Laine S, van der Marel RP, Lauer TR, Postman M, O’Dear CP, Owen FN, 2003, ApJ, 125, 478
- (22) Lewis KT, Eracleous M, Sambruna RM, 2003, ApJ, 593, 115
- (23) Liedahl DA, Osterheld AL, Goldstein WH, 1995, ApJ, 438, L115
- (24) Mewe R, Gronenschild EHBM, van den Oord GHJ, 1985, A&AS, 62, 197
- (25) Sanders JS, Fabian AC, 2002, MNRAS, 331, 273
- (26) Shobbrook, 1966, MNRAS, 131, 351
- (27) Sparks WB, Macchetto F, Golombek D, 1989, ApJ, 345, 153
- (28) Sparks WB, Carollo CM, Macchetto F, 1997, ApJ, 486, 253
- (29) Taylor GB, Fabian AC, Allen SW, 2002, MNRAS, 334, 769
- (30) Taylor GB, Sanders JS, Fabian AC, Allen SW, 2005, submitted to MNRAS
- (31) Wills KA, Morganti R, Tadhunter CN, Robinson TG, Villar-Martin M, 2004, MNRAS, 347, 771
- (32) Zombeck MV, 1992, Handbook of space astronomy and astrophysics, Cambridge University Press