Pierre Auger Collaboration
Pierre Auger Observatory, av. San Martín Norte 304, (5613)
Malargüe, Argentina
Presenter: B. Revenu (revenu@iap.fr), fra-revenu-B-abs1-he14-oral
Search for localized excess fluxes in Auger sky maps and prescription results
Abstract
Using the first surface detector data of the Pierre Auger Observatory, we present the results of a blind search for overdensities in the cosmic ray flux with respect to isotropic expectations. We consider two energy bands: EeV and EeV at two angular scales: 5∘ and 15∘. We also report the results of searches for excesses in target directions already defined in a set of prescriptions presented at the ICRC in 2003. Both analyses give results that are compatible with isotropy.
1 Introduction
Since the beginning of the year 2004, the Pierre Auger Observatory has achieved a long period of stable data acquisition which has allowed systematic data analysis. One of the main scientific goals of the experiment is the study of the arrival directions of cosmic rays. Statistically significant deviations from isotropy would give valuable information on cosmic rays sources. The AGASA [1] and SUGAR [2] experiments have reported excesses in directions close to the galactic center within a limited energy range. In this article, we will focus on a blind search over the whole sky and on targeted searches as defined in the prescription presented at the ICRC in 2003 (see [3]). To detect an excess of events coming from any particular region of the sky, we have to compare the observed number of events with that expected from an isotropic flux of cosmic rays, taking into account the relative exposure of the different sky directions. The significance of the resulting excess and deficit map has to be determined and the distribution of significances has to be compared with that obtained for a large number of isotropic simulations.
2 The dataset
We are considering the surface detector data only, without making use of fluorescence data and without using a constant intensity cut as it is done in the spectrum paper (see [4]) and in the Galactic center studies paper (see [5]).
In the prescription, the data period is defined as the time interval between 8 August 2003 to 16 May 2004. In this work, because of some trigger instability, we use actually data from 1 January 2004 to 16 May 2004. This represents 6046 events with zenith angles within 60∘ of vertical and that have passed all quality reconstruction cuts. The angular accuracy is always smaller than 2.2∘ (see [6]) allowing us to search for fluctuations on scales of a few degrees. For the blind search, we use the data from 1 January 2004 to 11 May 2005 with the same cuts on zenith angle and quality criteria. We have events, in the range EeV and above 5 EeV. The energy of 5 EeV corresponds approximately to the ankle in the cosmic ray spectrum, which may represent the transition from a galactic to extragalactic component. We choose to explore the data in angular scales of 5∘ and 15∘ radius since excess events from point sources may have arrival directions spread by intervening magnetic fields and because the statistics is still not that large to justify a blind search at the scale of our angular resolution.
3 Methods
3.1 Coverage map
The coverage map gives the relative number of expected events arriving to the detector from any direction in the sky for an isotropic incoming CR flux. Various methods exist to estimate it, such as the shuffling method consisting of exchanging arrival times and azimuths of real events to generate fake data sets that are averaged on the sky to obtain the coverage map. There is the semi-analytic one based on a smooth fit of the zenith angle distribution of the real events. The semi-analytic method takes into account the geometrical acceptance modulation, the zenith angle cutoff and the right-ascension modulation due to the non uniformity of the surface detector deployment and running. These methods are discussed in [7]. Note that for small angular scales both methods lead to comparable results since the error induced is always smaller than the Poisson noise of the event sample.
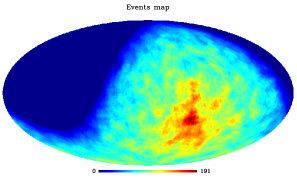
In Fig. 1 we present the sky coverage map (left) and the actual events map (right) for the energy range [1-5] EeV smoothed with a top-hat 111Selects data satisfying where is the direction of the center of the window and is the direction of the data and is the radius of the window. beam of radius 5∘. We use the Healpix [8] pixellisation of the sphere.
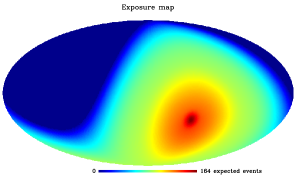
The coverage map depends on the energy range. The appropriate map is used for each particular search, either blind search for a particular energy range or prescription search.
3.2 The significance map
For each pixel of the sky, we compute the number of expected events integrating the semi-analytical coverage map in a given window (top-hat, gaussian…) centered on this pixel. Then the signal is obtained by applying the same filtering but on the event map. The significance of the signal with respect to the expected background is computed following [9] in the case of a top-hat window and will be referred hereafter by the expression : ”Li-Ma significance”.
4 Blind search for overdensities
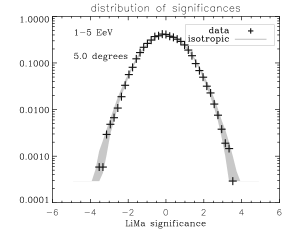
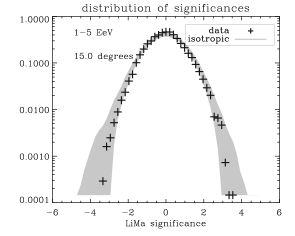
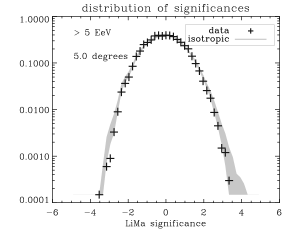
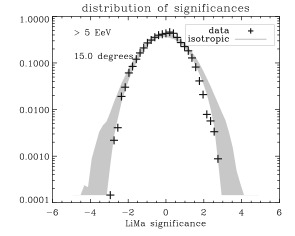
In order to see if the largest overdensities found are compatible with those expected from an isotropic CR flux, we compare the distribution of the significances obtained with those obtained for a large number of isotropic Monte Carlo simulations. These distributions are shown in Fig. 2. The shaded areas correspond to the 1 dispersion of the isotropic simulations. In all the cases the distribution is consistent with isotropic expectations.
5 Prescription results
At the 2003 ICRC, the Pierre Auger Collaboration presented a prescription in order to properly compute the probability for a local anisotropy to be compatible with isotropic expectations. Please refer to [3] for the detail. This procedure avoids uncertainties coming from the “penalty factors” due to a posteriori probability estimations, which can overestimate the significance of a source candidate.
The prescription targets are the galactic center and the AGASA-SUGAR location for the low energy data. For the highest energy events, targets are three nearby violent extragalactic objects: NGC0253, NGC3256 and Centaurus A.
The properties of the prescription targets and the results are shown in Table 1.
| Target | Radius | Found | Exp. | Prob | Req. Prob | |||
|---|---|---|---|---|---|---|---|---|
| GC 1 | 0.00 | 0.00 | 155 | 167.3 | - | 0.0035 | ||
| GC 2 | 0.00 | 0.00 | Point () | 2 | 2.5 | - | 0.00025 | |
| AGASA SUGAR | 7.00 | 0.00 | Point () | 3 | 2.69 | 0.43 | 0.00025 | |
| NGC0253 | 88.92 | -87.80 | 0 | 0.01 | - | 0.00005 | ||
| NGC3256 | 277.56 | 11.49 | 0 | 0.01 | - | 0.00005 | ||
| Centaurus A | 309.43 | 19.44 | 0 | 0.01 | - | 0.00005 |
It can be seen that none of the prescription targets leads to a positive detection. No excess is found from the Galactic Center region (see [5] for a complete analysis).
6 Conclusion
We have presented searches for localized excesses in the first Auger sky maps, with an unprecedented accumulated statistics at ultra-high energies in the Southern hemisphere. Blind source searches did not reveal any remarkable excess in any of the two energy bands EeV and EeV. We presented the results of the prescription which had been set in 2003 for the first Auger dataset. None of the prescribed targets leads to a significant excess. Studies are underway on larger datasets.
References
- [1] N. Hayashida et al, Astroparticle Physics 10, 303 (1999)
- [2] J.A. Bellido et al, Astroparticle Physics 15, 167 (2001)
- [3] R. Clay, proceedings of the 28th ICRC, astro-ph/0308494 (2003)
- [4] P. Sommers, Pierre Auger Coll., Proc. 29th ICRC, 2005, usa-sommers-P-he14-oral
- [5] A. Letessier-S., Pierre Auger Coll., Proc. 29th ICRC, 2005, fra-letessier-selvon-A-abs1-he14-oral
- [6] C.Bonifazi, Pierre Auger Coll., Proc. 29th ICRC, 2005, bra-bonifazi-C-abs1-he14-oral
- [7] J.-Ch. Hamilton, Pierre Auger Coll., Proc. 29th ICRC, 2005, fra-hamilton-JC-abs1-he14-oral
- [8] K.M. Gorski et al, Proc. MPA/ESO Cosmology Conf. Garching, (1998)
- [9] T-P. Li and Y-Q. Ma: ApJ 272, 317-324 (1983)