Paolo Padovani
11email: Paolo.Padovani@eso.org
High-energy Astrophysics and the Virtual Observatory
Abstract
The Virtual Observatory (VO) will revolutionise the way we do Astronomy by allowing easy access to all astronomical data and by making the handling and analysis of datasets at various locations across the globe much simpler and faster. I report here on the need for the VO and its status in Europe, concentrating on the recently started EURO-VO project, and then give two specific applications of VO tools to high-energy astrophysics.
keywords:
Methods: miscellaneous — techniques: miscellaneous — astronomical data bases: miscellaneous — quasars: general — X-rays: galaxies1 Astronomy in the XXI century
Astronomy is facing the need for radical changes. When dealing with surveys of up to sources, one could apply for telescope time and obtain an optical spectrum for each one of them to identify the whole sample. Nowadays, we have to deal with huge surveys (e.g., the Sloan Digital Sky Survey [SDSS; [Abazajian et al. 2004]], the Two Micron All Sky Survey [2MASS; [Cutri et al. 2003]], the Massive Compact Halo Object [MACHO; e.g., [Alcock et al. 2001]] survey), reaching (and surpassing) the 100 million objects. Even at, say, 3,000 spectra at night, which is only feasible with the most efficient multi-object spectrographs and for relatively bright sources, such surveys would require more than 100 years to be completely identified, a time which is clearly much longer than the life span of the average astronomer! But even taking a spectrum might not be enough to classify an object. We are in fact reaching fainter and fainter sources, routinely beyond the typical identification limits of the largest telescopes available (approximately 25 magnitude for 2 - 4 hour exposures), which makes “classical” identification problematic. These very large surveys are also producing a huge amount of data: it would take almost three months to download at 1 Mbytes/s (an extremely good rate for most astronomical institutions) the Data Release 4 (DR4; http://www.sdss.org/dr4/) SDSS images, more than a month for the catalogues. The images would fill up 1,700 DVDs ( 800 if using dual-layer technology). And the final SDSS will be about 50 as large as the DR4. These data, once downloaded, need also to be analysed, which requires tools which may not be available locally and, given the complexity of astronomical data, are different for different energy ranges. Moreover, the breathtaking capabilities and ultra-high efficiency of new ground- and space-based observatories have led to a “data explosion”, with astronomers world-wide accumulating Terabyte of data per night. For example, the European Southern Observatory (ESO)/Space Telescope European Coordinating Facility (ST-ECF) archive is predicted to increase its size by two orders of magnitude in the next seven years or so, surpassing Terabytes. Finally, one would like to be able to use all of these data, including multi-million-object catalogues, by putting this huge amount of information together in a coherent and relatively simple way, something which is impossible at present.
All these hard, unescapable facts call for innovative solutions. For example, the observing efficiency can be increased by a clever pre-selection of the targets, which will require some “data-mining” to characterise the sources’ properties before hand, so that less time is “wasted” on sources which are not of the type under investigation. One can expand this concept even further and provide a “statistical” identification of astronomical sources by using all the available, multi-wavelength information without the need for a spectrum. The data-download problem can be solved by doing the analysis where the data reside. And finally, easy and clever access to all astronomical data worldwide would certainly help in dealing with the data explosion and would allow astronomers to take advantage of it in the best of ways.
2 The Virtual Observatory
The name of the solution is the Virtual Observatory (VO). The VO is an innovative, evolving system, which will allow users to interrogate multiple data centres in a seamless and transparent way, to utilise at best astronomical data. Within the VO, data analysis tools and models, appropriate to deal also with large data volumes, will be made more accessible. New science will be enabled, by moving Astronomy beyond “classical” identification with the characterisation of the properties of very faint sources by using all the available information. All this will require good communication, that is the adoption of common standards and protocols between data providers, tool users and developers. This is being defined using new international standards for data access and mining protocols under the auspices of the recently formed International Virtual Observatory Alliance (IVOA: http://ivoa.net), a global collaboration of the world’s astronomical communities.
One could think that the VO will only be useful to astronomers who deal with colossal surveys, huge teams, and Terabytes of data. That is not the case, for the following reason. The World Wide Web is equivalent to having all the documents of the world inside one’s computer, as they are all reachable with a click of a mouse. Similarly, the VO will be like having all the astronomical data of the world inside one’s desktop. That will clearly benefit not only professional astronomers but also anybody interested in having a closer look at astronomical data. Consider the following example: imagine one wants to find all data at all wavelengths for a given high-energy source. One also needs to know which ones are in raw or processed format, one wants to retrieve them and, if raw, one wants also to have access to the tools to reduce them on-the-fly. At present, this is extremely time consuming, if at all possible, and would require, even to simply find out what is available, the use a variety of search interfaces, all different from one another and located at different sites. The VO will make it possible very easily.
3 The Virtual Observatory in Europe
The status of the VO in Europe is very good. In addition to seven current national VO projects, the European funded collaborative Astrophysical Virtual Observatory initiative (AVO: http://www.euro-vo.org) had the task of creating the foundations of a regional scale infrastructure by conducting a research and demonstration programme on the VO scientific requirements and necessary technologies. The AVO had been jointly funded by the European Commission (under the Fifth Framework Programme [FP5]) with six European organisations participating in a three year Phase-A work programme (2001 – 2004). The partners included ESO, the European Space Agency (ESA), AstroGrid (funded by PPARC as part of the United Kingdom’s E-Science programme), the CNRS-supported Centre de Données Astronomiques de Strasbourg (CDS), the TERAPIX astronomical data centre at the Institut d’Astrophisique in Paris, and the Jodrell Bank Observatory of the Victoria University of Manchester. The AVO project is now formally concluded. Links to various documents and to the software download page can be found at http://www.euro-vo.org/twiki/bin/view/Avo/.
3.1 AVO’s Main Achievements
AVO’s main achievements can be thus summarised:
-
1.
Science demonstrations. The AVO project was driven by its strategy of regular scientific demonstrations of VO technology. These were held on an annual basis for its Science Working Group (SWG), established to provide scientific advice to the project, in coordination with the IVOA. Three very successful demonstrations were held in January 2003 (Jodrell Bank), 2004 (ESO, Garching), and 2005 (ESAC, Madrid).
-
2.
First VO paper. The extragalactic case of the January 2004 demonstration was so successful that it turned into the first published science result fully enabled via end-to-end use of VO tools and systems (Padovani et al. 2004). The paper, which resulted in the discovery of high-power, supermassive black holes in the centres of apparently normal looking galaxies, was also publicised by an ESA/ESO press release (see http://www.euro-vo.org/pub/articles/AVO1stSciencePressRelease.html).
-
3.
VO tools. For the purpose of the demonstrations progressively more complex AVO demonstrators have been constructed. The current one is an evolution of Aladin, developed at CDS, and has become a set of various software components, provided by AVO and international partners, which allows relatively easy access to remote data sets, manipulation of image and catalogue data, and remote calculations in a fashion similar to remote computing. The AVO prototype is a VO tool which can be used now for the day-to-day work of astronomers. A Java application, it can be downloaded from the AVO Web site at http://www.euro-vo.org/twiki/bin/view/Avo/SwgDownload.
-
4.
Science Reference Mission. The Science Reference Mission is a definition of the key scientific results that the full-fledged EURO-VO should achieve when fully implemented. It consists of a number of science cases, with related requirements, against which the success of the EURO-VO will be measured. It was put together by the AVO Science Working Group.
3.2 The EURO-VO
The EURO-VO work program is the logical next step from AVO as a Phase-B deployment of an operational VO in Europe. Building on the development experience gained within the AVO Project, in coordination with the European astronomical infrastructural networks OPTICON and RADIONET, and through membership and support of the IVOA, EURO-VO will seek to obtain the following objectives: 1) technology take-up and full VO compliant data and resource provision by astronomical data centres in Europe; 2) support to the scientific community to utilise the new VO infrastructure through dissemination, workshops, project support, and VO facility-wide resources and services; 3) building of an operational VO infrastructure in response to new scientific challenges via development and refinement of VO components, assessment of new technologies, design of new components and their implementation. EURO-VO is open to all European astronomical data centres. Initial partners include ESO, ESA, and six national nodes: AstroGrid (UK), French-VO, GAVO (Germany), INAF (Italy), INTA (Spain), and NOVA (The Netherlands).
EURO-VO will seek to obtain its objectives by establishing three new interlinked structures.
The EURO-VO Data Centre Alliance (DCA): An alliance of European data centres who will populate the EURO-VO with data, provide the physical storage and computational fabric and who will publish data, metadata and services to the EURO-VO using VO technologies.
The EURO-VO Facility Centre (VOFC): An organisation that provides the EURO-VO with a centralised registry for resources, standards and certification mechanisms as well as community support for VO technology take-up and dissemination and scientific program support using VO technologies and resources.
The EURO-VO Technology Centre (VOTC): A distributed organisation that coordinates a set of research and development projects on the advancement of VO technology, systems and tools in response to scientific and community requirements.
The DCA will be a persistent alliance of data centre communities represented at a national level. Through membership in the DCA, a nation’s community of data curators and data service providers will be represented in a forum that will facilitate the take-up of VO standards, share best practice for data providers, consolidate operational requirements for VO-enabled tools and systems and enable the identification and promotion of scientific requirements from programs of strategic national interest that require VO technologies and services. Funds for the DCA will be requested in an FP6 proposal to be submitted in September 2005.
The VOFC will provide a ”public face” to the EURO-VO. Through outreach, support of VO-enabled science projects in the community, workshops and schools, the VOFC will represent a central support structure to facilitate the broad take-up of VO tools by the community. The VOFC will also support the EURO-VO Science Advisory Committee (SAC) to ensure appropriate and effective scientific guidance from the community of leading researchers outside the mainstream VO projects. The SAC will provide an up-to-date stream of high-level science requirements to the EURO-VO. The VOFC will further provide central services to the DCA for resource registry, metadata standards and EURO-VO access. Funding for the VOFC has yet to be fully defined but will come partially from ESO and ESA with activities ramping up in 2006.
The first VOFC activity was the organisation of a EURO-VO workshop at ESO Headquarters in Garching from June 27 to July 1, 2005. The workshop was explicitly designed for data centres and large projects to acquire the knowledge and experience necessary to allow them to become ”publishers” in the VO. In tutorials and lectures, participants were instructed in the use of VO analysis tools, libraries, and the existing web service infrastructure to build VO compliant services. The workshop was aimed at software engineers and designers building archive interfaces, writing applications accessing remote data, or designing archive facilities and data flows for future instruments and missions. More than 120 participants, coming from 47 different institutions and 16 countries, attended the workshop, with representatives from 11 out of 15 IVOA members. The tutorial material is a collection of software which, although still not in a final state, represents a unique and up-to-date snapshot of ”state of the art” VO technology. The workshop agenda and contributions are available at http://www.euro-vo.org/workshop2005.
The VOTC will consist of a series of coordinated technology research and development projects conducted in a distributed manner across the member organisations. The first project under the VOTC is the VO-TECH project, funded through the EC FP6 Proposal and contributions from the Universities of Edinburgh, Leicester, and Cambridge in the United Kingdom, ESO, CNRS (France), and INAF (Italy). It is envisioned that additional projects will be brought to the VOTC via other member organisations. The VOTC provides a mechanism to coordinate and share technological developments, a channel for DCA and VOFC requirements to be addressed and for technological developments to be distributed to the community of data centres and individual scientists in a coordinated and effective manner.
The EURO-VO project will be proactive in reaching out to European astronomers. As a first step, the EURO-VO will be making regular appearances at Joint European and National Astronomy Meetings (JENAM), starting with the one in Liege in 2005.
4 The VO and high-energy astrophysics
I present now two applications of the usage of Virtual Observatory tools to the field of high-energy astrophysics, namely: an example of ”data discovery” for a given astronomical source; and a specific science case, the discovery of optically faint, obscured quasars in the Great Observatories Origin Deep Survey (GOODS) fields.
4.1 Data discovery in high-energy astrophysics: NGC 1068
To give a (small) flavour of the possibilities offered by VO tools I have used the AVO prototype (v. 2.002) (see Sect. 3.1) to look for astronomical data for the prototype Seyfert 2 galaxy NGC 1068.
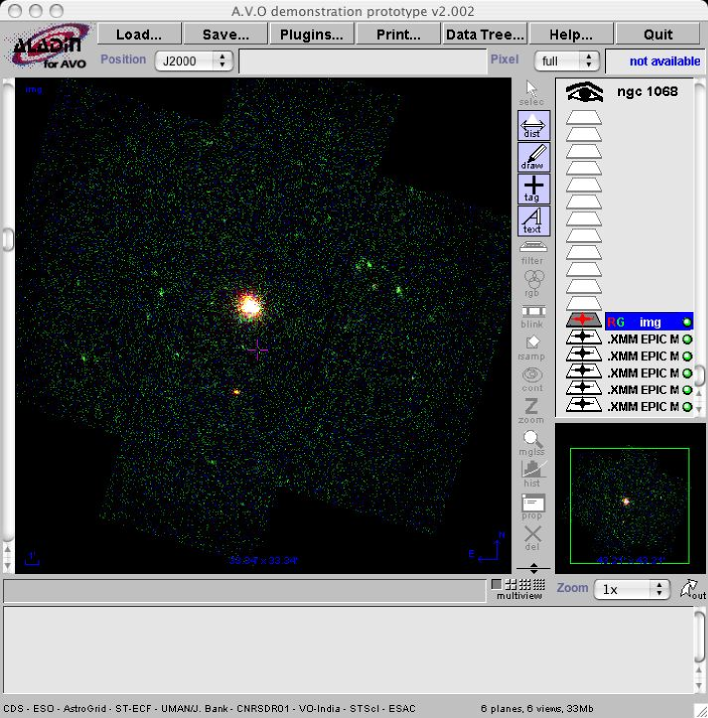
We start by looking for X-ray Multi Mirror (XMM) data for this source. We do that by using the ”VOdemo” button (which appears after clicking on ”Load”) and then by selecting the ”SIA server for XMM-Newton archive” (where ”SIA” stands for ”Simple Image Access”, an IVOA standard to access images). After typing the name of our source we are presented with a list of XMM images available directly from the XMM archive. We select five of them in five different bands: , , , , and keV. These can then be downloaded and displayed individually or at the same time using the ”multiview” feature of the prototype. Three of them can then be combined using the ”rgb” button to create a colour composite image of the field around our source to put into evidence, for example, the softest or hardest sources in the field (Fig. 1).
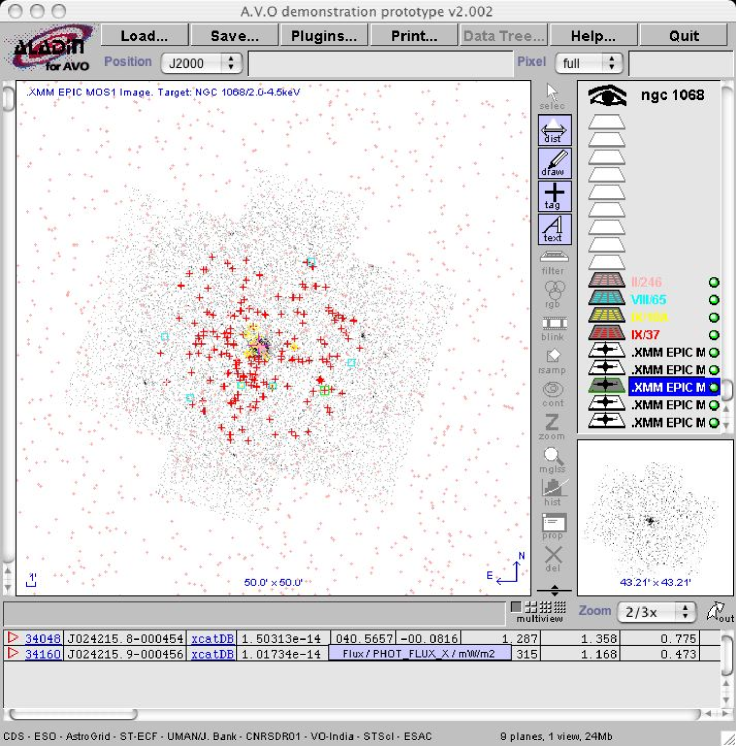
One can then look for various astronomical data for NGC 1068 and neighbouring sources. The AVO prototype has a direct link to VizieR (http://vizier.u-strasbg.fr/), a service which provides access to the most complete library of published astronomical catalogues and data tables available on-line. We can then search for all VizieR catalogues by wavelength, mission, keyword, or simply author name. For example, we might want to look for 2MASS, NRAO-VLA Sky Survey (NVSS), ROSAT All-Sky Survey (RASS), and 1XMM sources in a region around NGC 1068 (Fig. 2). The corresponding catalogues get loaded into the prototype and the sources are automatically overlaid on the selected image with different symbols and colours corresponding to different catalogues. By selecting some sources with the cursor these get highlighted and the catalogue parameters appear in the window below the image. At this point one might want to plot catalogue entries, which can be done by using VOPlot, the graphical plug-in of the prototype, or create new columns by doing numerical manipulations on the existing ones. Or one can also cross-correlate the catalogues to find out, for example, which of the 2MASS sources have, or do not have, an XMM counterpart by using the catalogue cross match tool.
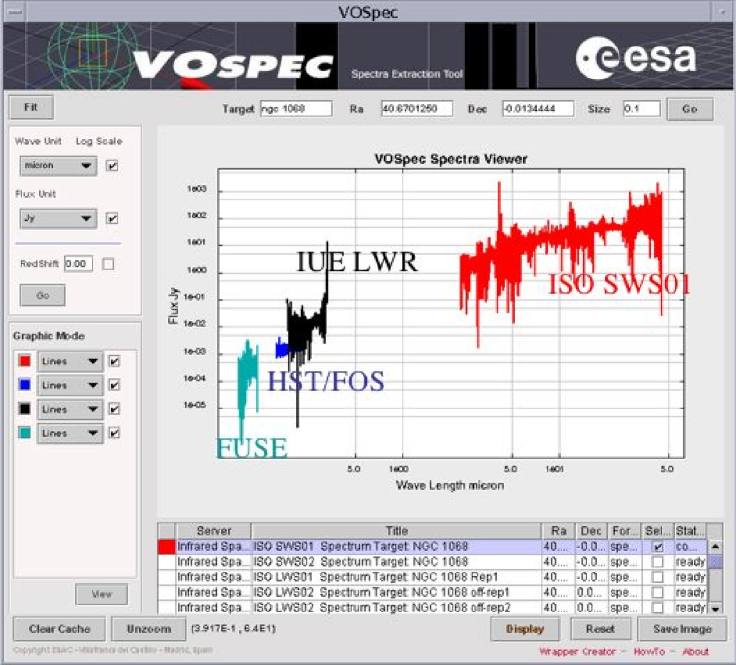
Finally, one might want to look for available spectra of NGC 1068 in various bands. This can be accomplished using VOSpec, a standalone tool which is also one of the plug-ins of the prototype. At present, VOSpec looks for spectra for a selected astronomical object (or around a position) in various archives which follow the Simple Spectrum Access (SSA) protocol, an IVOA standard for spectra. These include: the Infrared Space Observatory (ISO), the Hubble Space Telescope (HST) archive at the Space Telescope European Coordinating Facility (ST-ECF) (for re-calibrated Faint Object Spectrograph [FOS] spectra), the HyperLeda archive, the IUE Newly Extracted Spectra (INES) archive, the Far Ultraviolet Spectroscopic Explorer (FUSE) archive in Paris, the GIRAFFE archive, and the SDSS archive. Once the spectra are located VOSpec presents the user with a list of them. The selected files are then retrieved and plotted to build a Spectral Energy Distribution (SED). VOSpec manages to superimpose spectra coming from different instruments and energy bands by converting all spectra to the same units, using the information provided by the archives as part of the SSA protocol.
Figure 3 gives an example of a composite spectrum of NGC 1068 built using, going from shorter to longer wavelengths (left to right), FUSE, HST/FOS, IUE Long Wavelength Redundant (LWR), and ISO Short Wavelength Spectrometer (SWS) data. Obviously astronomers need to be cautious when merging spectra coming from different instrument and taken with different apertures but VOSpec gives a very nice overview of the SED of astronomical objects. This tool will obviously become even more useful when more archives adopt the SSA protocol.
4.2 Discovering optically faint, obscured quasars with VO tools
The AVO held its second demonstration, ’AVO 1st Science’, on January 27 - 28, 2004 at ESO. The demonstration was truly multi-wavelength, using heterogeneous and complex data covering the whole electromagnetic spectrum. These included: MERLIN, VLA (radio), ISO [spectra and images] and 2MASS (infrared), USNO, ESO 2.2m/WFI and VLT/FORS [spectra], and HST/ACS (optical), XMM and Chandra (X-ray) data and catalogues. Two cases were dealt with: an extragalactic case on obscured quasars, centred around the the two GOODS fields (Giavalisco et al. 2004), namely the Hubble Deep Field-North (HDF-N) and the Chandra Deep Field-South (CDF-S), the most data-rich, deep survey areas on the sky; and a Galactic scenario on the classification of young stellar objects.
The extragalactic case was so successful that it turned into the first published science result fully enabled via end-to-end use of VO tools and systems, the discovery of high-power, supermassive black holes in the centres of apparently normal looking galaxies (Padovani et al. 2004).
Black holes lurk at the centres of active galaxies (AGN) surrounded by dust which is thought to be, on theoretical and observational grounds (see, e.g., Urry & Padovani 1995; Jaffe et al. 2004), distributed in a flattened configuration, torus-like. When we can look down the axis of the dust torus and have a clear view of the black hole and its surroundings these objects are called “type 1” AGN, and display the broad lines and strong UV emission typical of quasars. “Type 2” AGN, on the other hand, lie with the dust torus edge-on as viewed from Earth so our view of the black hole is totally blocked by the dust over a range of wavelengths from the near-infrared to soft X-rays.
While many dust-obscured low-power black holes, the Seyfert 2s, have been identified, until recently few of their high-power counterparts were known. This was due to a simple selection effect: when the source is a low-power one and therefore, on average, closer to the observer, one can very often detect some features related to narrow emission lines on top of the emission from the host galaxy, which qualify it as a type 2 AGN. But when the source is a high-power one, a so-called QSO 2, and therefore, on average, further away from us, the source looks like a normal galaxy.
Our approach was to look for sources where nuclear emission was coming out in the hard X-ray band, with evidence of absorption in the soft band, a signature of an obscured AGN, and the optical flux was very faint, a sign of absorption. One key feature was the use of a correlation discovered by Fiore et al. (2003) between the X-ray-to-optical ratio and the X-ray power, which allowed us to select QSO 2s even when the objects were so faint that no spectrum, and therefore no redshift, was available.
We used a large amount of data: deep X-ray (Chandra) and optical (HST/ACS) catalogues, and identifications, redshifts, and spectra for previously identified sources in the CDF-S and HDF-N based on VLT and Keck data. Using the AVO prototype made it much easier to classify the sources we were interested in and to identify the previously known ones, as we could easily integrate all available information from images, spectra, and catalogues at once. One interesting feature was the prototype catalogue cross-matching service, which can access all entries in Vizier, at CDS, and allowed us to cross-correlate a variety of catalogues very efficiently.
Out of the 546 X-ray sources in the GOODS fields we selected 68 type 2 AGN candidates, 31 of which qualify as QSO 2 (estimated X-ray power erg/s). Our work brings to 40 the number of QSO 2 in the GOODS fields, an improvement of a factor when compared to the only nine such sources previously known. These sources are very faint () and therefore spectroscopical identification is not possible, for the large majority of objects, even with the largest telescopes currently available. By using VO methods we are sampling a region of redshift - power space so far unreachable with classical methods. For the first time, we can also assess how many QSO 2 there are down to relatively faint X-ray fluxes. We find a surface density deg-2 for erg cm-2 s-1, higher than some previous estimates.
The identification of a population of high-power obscured black holes and the active galaxies in which they live has been a key goal for astronomers and will lead to greater understanding and a refinement of the cosmological models describing our Universe.
This result is proof that VO tools have evolved beyond the demonstration level to become respectable research tools, as the VO is already enabling astronomers to reach into new areas of parameter space with relatively little effort.
5 Conclusions
The main conclusions are as follows:
-
1.
We need to change the way we do Astronomy if we want to take advantage of the huge amount of data we are being flooded with. The way to do that is through the Virtual Observatory.
-
2.
The Virtual Observatory will make the handling and analysis of astronomical data and tools located around the world much easier, enabling also new science.
-
3.
Everybody will benefit, including high-energy astrophysics researchers!
-
4.
Virtual Observatory tools are available now to facilitate astronomical research and, as I have shown, can also be applied to high-energy astrophysics.
Visit http://www.euro-vo.org/twiki/bin/view/Avo/SwgDownload to download the AVO prototype. I encourage astronomers to download the prototype, test it, and use it for their own research. For any problems with the installation and any requests, questions, feedback, and comments you might have please contact the AVO team at twiki@euro-vo.org. (Please note that this is still a prototype: although some components are pretty robust some others are not.)
Acknowledgements.
I thank the Astrophysical Virtual Observatory team for their superb work. I have made extensive use of the CDS VizieR catalogue tool, SIMBAD and the Aladin sky atlas service, and of the VOSpec tool developed at the European Space Astronomy Centre (ESAC). The Astrophysical Virtual Observatory was selected for funding by the Fifth Framework Programme of the European Community for research, technological development and demonstration activities, under contract HPRI-CT-2001-50030. The EURO-VO VO-TECH project was selected for funding by the Sixth Framework Programme of the European Community.References
- [Abazajian et al. 2004] Abazajian K. et al., 2004, AJ, 128, 502
- [Alcock et al. 2001] Alcock C. et al., 2001, ApJS, 136, 439
- [Cutri et al. 2003] Cutri R. M. et al., 2003, Explanatory Supplement to the 2MASS Second Incremental Data Release available at http://www.ipac.caltech.edu/2mass/releases/allsky/doc/explsup.html
- [] Fiore F., Brusa M., Cocchia F. et al., 2003, A&A, 409, 79
- [] Giavalisco M., Ferguson H. C., Koekemoer A. M. et al., 2004, ApJ, 600, L93
- [] Jaffe W., Meisenheimer K., Röttgering H. J. A. et al., 2004, Nature, 429, 47
- [Padovani et al. (2004)] Padovani P., Allen M. G., Rosati P., Walton N. A., 2004, A&A, 424, 545
- [] Urry C. M., Padovani P., 1995, PASP, 107, 803