Dust-enshrouded giants in clusters in the Magellanic Clouds
We present the results of an investigation of post-Main Sequence mass loss from stars in clusters in the Magellanic Clouds, based around an imaging survey in the L′-band (3.8 m) performed with the VLT at ESO. The data are complemented with JHKs (ESO and 2MASS) and mid-IR photometry (TIMMI2 at ESO, ISOCAM on-board ISO, and data from IRAS and MSX). The goal is to determine the influence of initial metallicity and initial mass on the mass loss and evolution during the latest stages of stellar evolution. Dust-enshrouded giants are identified by their reddened near-IR colours and thermal-IR dust excess emission. Most of these objects are Asymptotic Giant Branch (AGB) carbon stars in intermediate-age clusters, with progenitor masses between 1.3 and 5 M⊙. Red supergiants with circumstellar dust envelopes are found in young clusters, and have progenitor masses between 13 and 20 M⊙. Post-AGB objects (e.g., Planetary Nebulae) and massive stars with detached envelopes and/or hot central stars are found in several clusters. We model the spectral energy distributions of the cluster IR objects, in order to estimate their bolometric luminosities and mass-loss rates. The IR objects are the most luminous cluster objects, and have luminosities as expected for their initial mass and metallicity. They experience mass-loss rates in the range from a few up to M⊙ yr-1 (or more), with most of the spread being due to evolutionary effects and only a weak dependence on progenitor mass and/or initial metallicity. About half of the mass lost by 1.3–3 M⊙ stars is shed during the superwind phase, which lasts of order yr. Objects with detached shells are found to have experienced the highest mass-loss rates, and are therefore interpreted as post-superwind objects. We also propose a simple method to measure the cluster mass from L′-band images.
Key Words.:
Stars: AGB and post-AGB – Stars: evolution – Stars: mass-loss – supergiants – Magellanic Clouds – Infrared: stars1 Introduction
Near the end of their life, stars of initial mass 1–8 M⊙ and many of the more massive stars become cool and luminous giants, through evolution along the first ascent Red Giant Branch (RGB) and Asymptotic Giant Branch (AGB), or as a red supergiant (RSG), respectively. As such, they become a powerful tracer of the underlying stellar population in clusters and galaxies. In these final stages of evolution the red giant loses a significant fraction of its mass at rates of to M⊙ yr-1 in a ”superwind” driven as a result of stellar pulsation and circumstellar dust formation. These stars thus enrich the interstellar medium with dust and products of nuclear burning on timescales from 10 Myr for the most massive RSGs up to 10 Gyr for stars like the Sun.
Progress in the theoretical understanding of evolution and mass loss of red giants is hampered by the difficulty to empirically chart the results of stellar evolution (e.g., luminosity, mass-loss rate, chemical abundances) onto the boundary conditions of initial mass and initial metallicity. It is very difficult to measure the mass of a red giant and its metallicity, let alone its initial mass and metallicity. A powerful way around this problem is to study red giants in clusters for which the age (and hence the mass of the red giant) and initial metallicity can often be obtained with reasonable ease and accuracy.
Studies of clusters in the Magellanic Clouds (Mould & Aaronson 1979; Lloyd-Evans 1980, 1983; Frogel & Cohen 1982; Aaronson & Mould 1985; Frogel, Mould & Blanco 1990; Ferraro et al. 1995; Marigo, Girardi & Chiosi 1996) confirm some of the main features of stellar evolution models for AGB stars, such as the transition from oxygen-rich M stars, through S stars when carbon and oxygen are equally abundant, into carbon stars. In each cluster, the carbon stars are more luminous than the M stars, with the S stars in between. The transition luminosity M-S and S-C is higher in younger and/or more metal-rich clusters. These studies could not reach the phases of high mass loss, where circumstellar reddening becomes important. Observations at thermal-IR wavelengths to detect circumstellar dust emission are essential to measure the mass-loss rate from these stars.
Only a few cluster IR objects are known. These include the M⊙ OH/IR star IRAS 052986957 (van Loon et al. 2001a) and the M⊙ carbon star LI-LMC 1813 (van Loon et al. 2003). Tanabé et al. (2004) surveyed clusters in the Magellanic Clouds with the ISOCAM instrument onboard ISO. They detected two dust-enshrouded AGB stars in each of the populous intermediate-age clusters NGC 419 (SMC) and NGC 1783 and NGC 1978 (LMC), four of which were already known from near-IR data.
We here present results from a systematic survey for dust-enshrouded red giants in clusters in the Magellanic Clouds. The investigation is built around L′-band imaging obtained at the ESO-VLT, supplemented by near-IR imaging photometry and a collection of mid-IR data from IRAS, ISO, MSX and the ESO 3.6m telescope. We find 30 dusty stars, of which 26 are likely cluster members. We determine their nature, luminosity and mass-loss rate, and investigate the dependence on progenitor mass and metallicity.
2 Cluster selection, properties, and bias
We have attempted to select clusters across a wide range of ages and metallicities (Table 1, criterion “C”). Although the more populous clusters are attractive targets to survey for rare objects such as dust-enshrouded stars, small clusters of Gyr are much more numerous and many of the IR-object selected clusters (Table 1, criterion “I”) turn out to be associated with this type of cluster. The drawback of these less conspicuous clusters is that they have not usually been studied in detail and ages and metallicities are often inaccurate — if at all available. Due to the smaller stellar over-density with respect to the field, membership of small clusters is also more ambiguous. We added from the literature (Table 1, criterion “L”) another two clusters in which IR objects had been found.
The cluster ages and metallicities — for which we take the commonly used relative iron abundance [Fe/H] — are collected from a variety of recent sources in the literature, and are listed in Table 1. For some clusters, average values were taken from multiple sources. In the case of NGC 1978 the disagreement between the individual sources is rather large, with Olszewski et al. (1991) and Hill et al. (2000) disagreeing over the metallicity by 0.5 dex for the spectroscopic determinations of two stars in common.

The clusters show a clear correlation between age and metallicity (Fig. 1), which is observed for both the SMC and the LMC (e.g., Olszewski et al. 1991; Geisler et al. 1997; Da Costa & Hatzidimitriou 1998; de Freitas Pacheco, Barbuy & Idiart 1998). The turnover to lower metallicities of the youngest clusters is intriguing, with young, fairly massive clusters as metal-poor as [Fe/H] observed in both clouds (Hill et al. 2000). There is sufficient spread in the cluster properties that one cannot assume that every LMC cluster is more metal-rich than an SMC cluster of the same age.

| Cluster | RA | Dec | r | r | log(t) | [Fe/H] | log(M) | N>RGB | Ref | Sel |
| (h m s) | (∘ ′ ′′) | ( ′ ) | (pc) | (yr) | (M⊙) | |||||
| Small Magellanic Cloud | ||||||||||
| ESO 28-19 | 0 24 46.0 | 72 47 37 | 1.70 | 29.7 | 1 | 7 | C | |||
| NGC 121 | 0 26 49.0 | 71 32 10 | 1.73 | 30.2 | 1 | 1 | 7 | C | ||
| NGC 152 | 0 32 56.0 | 73 06 59 | 1.50 | 26.2 | 5 | 7 | C | |||
| NGC 330 | 0 56 20.0 | 72 27 44 | 1.33 | 23.2 | 15 | 7 | C | |||
| HW 32 | 0 57 24.0 | 71 11 00 | 0.33 | 5.8 | 7.85 | 3.7 | 0 | 5 | C | |
| NGC 416 | 1 07 58.0 | 72 21 25 | 0.85 | 14.8 | 2 | 7 | C | |||
| NGC 419 | 1 08 19.5 | 72 53 03 | 1.40 | 24.4 | 5.1 | 23 | 3 | C | ||
| NGC 458 | 1 14 54.0 | 71 32 58 | 1.23 | 21.5 | 0 | 7 | C | |||
| ESO 30-4 | 1 49 30.0 | 73 43 40 | 2.20 | 38.4 | 5.6 | 1 | 9 | C | ||
| Large Magellanic Cloud | ||||||||||
| NGC 1651 | 4 37 31.1 | 70 35 02 | 1.35 | 19.6 | 1 | 6 | C | |||
| HS 33 | 4 49 17.0 | 69 52 40 | 0.40 | 5.8 | 3.9 | 4 | y | I | ||
| KMHK 292 | 4 55 35.0 | 69 26 50 | 0.53 | 7.7 | 3.6 | 3 | y | I | ||
| KMHK 285 | 4 55 39.0 | 67 49 11 | 0.29 | 4.2 | 9.00 | 4.1 | 1 | y | I | |
| NGC 1783 | 4 59 08.0 | 65 59 18 | 2.50 | 36.4 | 5.5 | - | 3 | L | ||
| NGC 1818 | 5 04 13.8 | 66 26 02 | 1.45 | 21.1 | 13 | 6 | C | |||
| NGC 1831 | 5 06 17.4 | 64 55 11 | 1.75 | 25.5 | 4 | 6 | C | |||
| NGC 1852 | 5 09 23.0 | 67 46 42 | 0.95 | 13.8 | 5.0 | 6 | 1 | I | ||
| NGC 1866 | 5 13 38.9 | 65 27 52 | 2.75 | 40.0 | 8 | 6 | C | |||
| SL 349 | 5 16 54.4 | 68 52 36 | 0.46 | 6.7 | 4.2 | 0 | 13 | I | ||
| NGC 1903 | 5 17 22.4 | 69 20 16 | 0.95 | 13.8 | 4.2 | 19 | 13 | I | ||
| HS 270 | 5 23 52.0 | 71 34 42 | 0.60 | 8.7 | 4.5 | 1 | y | I | ||
| SL 453 | 5 25 01.1 | 69 26 03 | 0.63 | 9.2 | 4.2 | 4 | 11 | I | ||
| SL 482 | 5 27 17.9 | 66 22 06 | 0.34 | 4.9 | 3.4 | 1 | 2 | I | ||
| NGC 1984 | 5 27 40.8 | 69 08 05 | 0.68 | 9.9 | 6 | 6 | C | |||
| BSDL 1837 | 5 27 51.0 | 69 13 20 | 0.30 | 4.4 | 4.1 | 4 | y | I | ||
| NGC 1994 | 5 28 22.0 | 69 08 30 | 0.78 | 11.3 | 3.8 | 5 | 10 | I | ||
| NGC 1978 | 5 28 45.0 | 66 14 14 | 1.68 | 24.4 | 5.2 | 18 | x | C | ||
| HS 327-E | 5 29 23.3 | 69 55 10 | 0.45 | 6.5 | 4.0 | - | 14 | L | ||
| SL 519 | 5 30 01.7 | 69 57 02 | 0.33 | 4.8 | 3.8 | 8 | 12 | I | ||
| NGC 2002 | 5 30 21.0 | 66 53 02 | 0.90 | 13.1 | 3.9 | 8 | 4 | I | ||
| NGC 2010 | 5 30 34.6 | 70 49 10 | 0.90 | 13.1 | 4.3 | 0 | 8 | C | ||
| NGC 2004 | 5 30 40.9 | 67 17 09 | 1.45 | 21.1 | 6 | 6 | I | |||
| NGC 2100 | 5 42 08.6 | 69 12 44 | 1.25 | 18.2 | 11 | 6 | I | |||
| NGC 2121 | 5 48 11.6 | 71 28 51 | 1.23 | 17.9 | 4 | 6 | C | |||
| NGC 2155 | 5 58 33.3 | 65 28 35 | 1.20 | 17.5 | 2 | 6 | C | |||
| ESO 121-3 | 6 02 02.0 | 60 31 20 | 1.05 | 15.3 | 1 | 5.2 | 0 | 11 | C | |
| KMHK 1603 | 6 02 30.0 | 67 12 54 | 0.75 | 10.9 | 4.6 | 2 | 15 | I | ||
| NGC 2210 | 6 11 31.5 | 69 07 17 | 1.65 | 24.0 | 1 | 0 | 6 | C | ||
Mackey & Gilmore (2003a,b) estimated the cluster masses for 10 clusters in the SMC and 53 clusters in the LMC, some of which are in common with our sample. We collected the radii for all their clusters from Bica & Schmitt (1995) and Bica et al. (1999). We thus find a weak correlation between the mass and volume (Fig. 2, top panel):
| (1) |
with a standard deviation of 0.7 in . The scatter can be reduced by a parameterization in both radius and cluster age (Fig. 2, bottom panel):
| (2) |
where , and . We use the relation to estimate the mass of clusters that were not included in the analysis of Mackey & Gilmore (Table 1).
Throughout this paper we use distance moduli to the SMC and LMC of 19.0 and 18.5 mag, respectively.
3 Observations
3.1 J and Ks-band imaging
Images were obtained through the J (1.25 m) and Ks (2.2 m) bands with the SOFI instrument on the ESO 3.5m NTT at La Silla, Chile, on the first half of the night of 7 November 2000. At a scale of pixel-1, the field-of-view was . The images were constructed through combination of 9 frames which were obtained at slightly different (few arcsec) ”jitter” positions to allow for the construction and subtraction of the (bright and variable) sky background. The seeing was typically around 1′′, but some of the images were distorted because the delay time to allow the telescope to recover from its movement to a new jitter position was set too short. The weather conditions deteriorated shortly after completion of the cluster-selected subsample, and consequently the J and Ks-band data obtained for the IR-object-selected subsample are often quite poor and in several cases not obtained at all. The total integration time per final image is 90 seconds except where images were discarded because no stars were visible due to cloud cover.
The data were reduced using the ESO Eclipse and MIDAS software packages. First, electronic ghosts were removed with help of the Eclipse tool is_ghost. Then, a flatfield frame was constructed from the differences between the pair-wise observations of an illuminated and dark screen, to correct for transmission, vignetting and detector response variations across the frame. Next, each frame was sky-subtracted by first (for each pixel) subtracting the minimum value of the set of 9 jittered frames (after having scaled each frame to its median value), and then subtracting the pixel value obtained by median-averaging along the columns of the frame. The resulting frames were shift-added to create the final image.
Photometry was obtained for all the stars detected in the L′-band images described below, using (software) apertures with a diameter of . A few stars in NGC 419, NGC 1984 and NGC 2210 were measured through -diameter apertures in the case of exceptional crowding, and their magnitudes were corrected for the aperture difference. The magnitudes were calibrated against those of known 2MASS sources in the images to a systematic accuracy of 0.1 mag, but relative photometry within the images themselves is generally better.
2MASS data are used where ESO J and Ks-band data are absent, as well as to complement the analysis with H-band (1.65 m) photometry. The J-band magnitude of NGC 1994-IR1 and the K-band magnitudes of two other bright stars in the same cluster were reconstructed by differential aperture photometry on the 2MASS image. The 2MASS data are problematic for clusters in the Magellanic Clouds though, as many 2MASS sources are in fact blends of stars. Also, the 2MASS data were obtained more than two years before the L′-band data whilst the ESO J and Ks-band data were obtained within a few weeks after the L′-band data. Many of the dust-enshrouded red giants are large-amplitude variables with periods of around 400–1000 days and hence, where the ESO photometry can be considered near-simultaneous with the L′-band photometry, the 2MASS photometry have random phase differences with respect to the L′-band photometry.
Some objects have been detected in the DENIS survey of the Magellanic Clouds (Cioni et al. 2000). Although less deep than 2MASS, it provides an I-band magnitude for some of the (optically) brighter, relatively isolated objects. This is useful in constraining the spectral energy distributions of hot stars such as post-AGB objects and PNe. The DENIS catalogue also lists B and/or R-band magnitudes in some cases. Crowding is more severe in the optical, though, which could render the optical colours of intrinsically red objects bluer due to the contribution at short wavelengths of other, less red stars.
3.2 L′-band imaging
Images were obtained through the L′ band (3.78 m, bandwidth m) with the ISAAC instrument on the ESO VLT at Paranal, Chile, in service mode during a total of three hours spread over the nights of 12, 17 and 18 October 2000. At a scale of pixel-1, the field-of-view was . The images were obtained following the usual chop-and-nod procedure for thermal-IR observations, where both the chop and the nod throw were in the North-South direction. The total exposure time per target is two minutes, with a detector integration time of 0.104 sec. The conditions were photometric, with a seeing of typically around .
The data were reduced using the ESO Eclipse and MIDAS software packages. First, electronic ghosts were removed with help of the Eclipse tool is_ghost. A flatfield frame was constructed by imaging the twilight sky and using the Eclipse tool is_twflat. After flatfielding the science frames obtained at each nod position, the resulting pair of frames were subtracted and then shift-added to produce a frame with stellar images that contain all of the observed light. Photometric measurements were obtained through a software aperture, and were calibrated against the measurements of the standard stars HD 22686, HD 19904 and HR 2354.
Additional photometry was obtained from acquisition images for L-band spectroscopy for the clusters NGC 1903, SL 453, NGC 1984, NGC 1978 and SL 519 (7 & 8 December 2003; van Loon et al., in preparation) and for KMHK 1603 (14 December 2001; van Loon et al. 2003). These images were obtained through the L′-band filter except for NGC 1978 and the standard star HIP 020020 A+B that were observed through narrow-band filters centred at 3.8 and 3.28 m, respectively. Detector integration times were 0.025 sec for the clusters and 0.28 sec for NGC 1978 and the standard star. The same zeropoints were assumed for all images, which by cross-correlation with our dedicated L′-band photometry seemed to be accurate to within a few 0.1 mag.
3.3 N-band imaging
Images were obtained in the N band (8–13 m) with the TIMMI2 instrument on the ESO 3.6m at La Silla, Chile, on the nights of 19–21 January 2001, of the clusters NGC 330 and KMHK 1603 through the N2 filter (central wavelength 10.6 m, 9.7–11.3 m at 50% transmission) and of the clusters NGC 419, NGC 1984 and NGC 1994 through the 11.9 m filter (11.0–12.2 m at 50% transmission). At a scale of pixel-1 ( pixel-1 for NGC 330), the field-of-view was ( for NGC 330). Standard chopping and nodding procedures were followed, with a throw of . Total effective exposure times amounted to 4–9 minutes per cluster, using detector integration times of 22 to 27 msec.
The data were reduced using the ESO MIDAS software package. After inspection of all individual frames and rejection of saturated data, the frames belonging to the same nod position were averaged and then subtracted from the average frame at the complementary nod position. The thus obtained images were shift-added to construct the final image, from which by additional shift-adding an image was produced with stellar images that contain all the observed light. On these stellar images photometry was obtained through a (software) aperture and which was calibrated against measurements of the standard stars Tuc, Hya, Pic, Ret and Dor. An early result for LI-LMC 1813 (KMHK 1603-IR1) has already been presented in van Loon et al. (2003).
3.4 Additional mid-IR imaging
For the identified cluster IR objects, additional mid-IR data was obtained from the IRAS and MSX surveys and in some cases from ISO survey data. Like 2MASS, these data are not contemporary with the L′-band data, however they are important in constraining the spectral energy distribution to estimate the bolometric luminosity and mass-loss rate.
For each IR object we collected the corresponding IRAS scans from the IRAS data server111http://www.astro.rug.nl/IRAS-Server/ and used the GIPSY software with the scanaid tool to reconstruct a cut through the emission on the exact position. This is preferred over using the IRAS Point Source Catalogue values and works well for isolated sources, for which often reliable flux densities can be estimated down to a level of a few 0.01 Jy at 12 and 25 m and 0.1 Jy at 60 m, but where clusters contain more than one IR-bright source the flux densities can become quite unreliable and should often be regarded as upper limits.
Most cluster IR objects have reliable MSX band A (8.3 m) flux densities in the MSX Point Source Catalogue (Version 2.3). However, the flux densities for NGC 419-IR1 and IR2, NGC 1903-IR1 and IR2, NGC 1978-IR3 and IR4, HS 327-E-IR2, SL 519-IR2 and NGC 2121-IR1 were estimated by differential aperture photometry on the MSX images with respect to nearby moderately-bright sources listed in the MSX Point Source Catalogue. The SMC cluster objects NGC 419-IR1 and IR2 were also measured on the original MSX images. Only a few objects are bright enough to have reliable MSX measurements in bands C (12.1 m), D (14.7 m) or E (21.3 m).
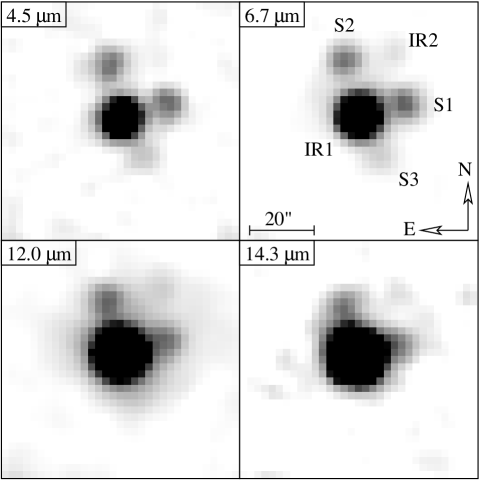
Three of the clusters, BSDL 1837, HS 327 and SL 519 were covered by the ISO mini-survey of the Magellanic Clouds (Loup et al., in preparation), performed with the ISOCAM instrument and filters LW1 (4.5 m) and LW10 (12.0 m). SL 519 is located in the prime calibration field for the survey, which is also one of the calibration fields for the ISOGAL survey (Omont et al. 2003), and was therefore also observed twice with the LW2 (6.7 m) filter, a second time with the LW10 filter and once with the LW3 (14.3 m) filter. Flux densities were measured through differential aperture photometry with respect to moderately-bright objects in the ISO mini-survey and/or ISOGAL Point Source Catalogues. Time-averaged images were created for SL 519 by rotate-shift-adding the images taken at the different epochs.
4 Results
| Name | RA | Dec | Identification(s) | MSX | IRAS | … | … | References | ||
|---|---|---|---|---|---|---|---|---|---|---|
| Cluster | IR# | (h m s) | (∘ ′ ′′) | IRAS | MSX | 8.3 | 12 | 25 | 60 | |
| Small Magellanic Cloud | ||||||||||
| NGC 419 | 1 | 1 08 12.97 | 72 52 44.0 | 0.058 | 0.10 | 0.14 | 12,15,17 | |||
| … | 2 | 1 08 17.52 | 72 53 09.2 | LI-SMC 182 | 0.183 | 0.24 | 0.19 | 0.2 | 16,17 | |
| Large Magellanic Cloud | ||||||||||
| HS 33 | 1 | 4 49 18.49 | 69 53 14.5 | 044966958 | 1130 | 0.404 | 0.31 | 0.22a | 0.1 | 18,19,20,22,23,31 |
| KMHK 292 | 1 | 4 55 34.85 | 69 26 55.7 | 045596931 | 1329 | 0.298 | 0.32 | 0.18 | 0.2 | 30 |
| … | 2 | 4 55 41.83 | 69 26 24.3 | 0.171 | 0.20: | 0.08: | 19,23,30 | |||
| KMHK 285 | 1 | 4 55 38.98 | 67 49 10.7 | 045576753 | 1238 | 0.157 | 0.24 | 0.15 | 0.3 | 10,19,22,31 |
| NGC 1783 | 1 | 4 59 01.11 | 65 58 30.3 | 1273 | 0.116 | 0.05 | 0.03 | 12,15,16,17 | ||
| NGC 1852 | 1 | 5 09 20.22 | 67 47 25.0 | 050946751 | 66 | 0.065 | 0.13 | 0.45 | 0.5 | 6,11,13,14,29 |
| NGC 1903 | 1 | 5 17 16.33 | 69 20 29.8 | 0.104 | 0.20 | 0.20 | 28 | |||
| … | 2 | 5 17 17.38 | 69 20 54.6 | 0.052 | 0.20 | 0.20 | 28 | |||
| … | 3 | 5 17 22.62 | 69 20 15.5 | 051766922 | 344 | 0.301 | 0.22: | 0.09: | ||
| HS 270 | 1 | 5 23 53.93 | 71 34 43.9 | 052467137 | 423 | 0.161 | 0.19 | 0.40 | 2.0 | |
| SL 453 | 1 | 5 25 03.26 | 69 26 17.0 | 484 | 0.156 | 0.10 | 0.10 | 28 | ||
| SL 482 | 1 | 5 27 17.84 | 66 22 05.6 | 052736624 | 562 | 0.233 | 0.10 | 0.12 | 8,13 | |
| NGC 1984 | 1 | 5 27 40.83 | 69 08 05.4 | 052806910 | 1.370 | 3.90 | 23.50 | 12.6 | 9,25,28,32,33 | |
| … | 2 | 5 27 40.11 | 69 08 04.5 | 1.370 | 2,28,30 | |||||
| … | 3 | 5 27 35.67 | 69 08 56.3 | 0.157 | 0.10: | 1.00 | 5,6,11,14 | |||
| BSDL 1837 | 1 | 5 27 47.48 | 69 13 20.5 | 052816915 | 588 | 0.320 | 0.30 | 0.20 | 30 | |
| NGC 1994 | 1 | 5 28 21.98 | 69 08 33.7 | 052876910 | 583 | 0.962 | 1.07 | 1.40 | 1.0 | |
| NGC 1978 | 1 | 5 28 40.17 | 66 13 54.2 | 0.077 | 0.07: | 0.05 | 4,12,17,28 | |||
| … | 2 | 5 28 47.20 | 66 14 13.6 | 052876616 | 0.124 | 0.08: | 0.10 | 3,16,17,28 | ||
| … | 3 | 5 29 02.41 | 66 15 27.8 | 052896617 | 0.080 | 0.16 | 0.38 | 0.3: | 13,19,23,27 | |
| … | 4 | 5 28 44.50 | 66 14 04.0 | 0.070: | 0.10: | 0.10: | 4,7,17 | |||
| HS 327-E | 1 | 5 29 24.60 | 69 55 13.4 | 052986957 | 653 | 0.292 | 0.85b | 1.38b | 3.0 | 9,19,22,23,24,25,33 |
| … | 2 | 5 29 25.46 | 69 54 52.3 | 0.030: | 0.85 | 24 | ||||
| SL 519 | 1 | 5 30 04.87 | 69 56 45.2 | 654 | 0.152 | 0.20: | 0.10: | 28 | ||
| … | 2 | 5 30 02.15 | 69 56 17.2 | 0.030 | 0.15: | 0.10: | ||||
| NGC 2100 | 1 | 5 42 11.57 | 69 12 48.8 | 054256914 | 1435 | 0.167 | 0.30 | 0.22 | 1 | |
| NGC 2121 | 1 | 5 48 16.81 | 71 28 39.3 | 0.028: | 0.02: | 0.05 | 7,4,17 | |||
| KMHK 1603 | 1 | 6 02 31.06 | 67 12 47.0 | 060256712 | 1652 | 0.251 | 0.39 | 0.28 | 0.2 | 21,26 |
Notes: a ISOPHOT Jy (Trams et al. 1999b); b ISOPHOT Jy and Jy (Trams et al. 1999b).
| Cluster | IR# | |||||||
|---|---|---|---|---|---|---|---|---|
| Small Magellanic Cloud | ||||||||
| NGC 419 | 1 | |||||||
| … | 2 | |||||||
| Large Magellanic Cloud | ||||||||
| HS 33 | 1 | |||||||
| KMHK 292 | 1 | |||||||
| … | 2 | |||||||
| KMHK 285 | 1 | 16.18 | ||||||
| NGC 1783 | 1 | |||||||
| NGC 1852 | 1 | |||||||
| NGC 1903 | 1 | |||||||
| … | 2 | |||||||
| … | 3 | |||||||
| HS 270 | 1 | 16.18 | ||||||
| SL 453 | 1 | 15.16 | 14.65 | |||||
| SL 482 | 1 | |||||||
| NGC 1984 | 1 | |||||||
| … | 2 | |||||||
| … | 3 | |||||||
| BSDL 1837 | 1 | |||||||
| NGC 1994 | 1 | |||||||
| NGC 1978 | 1 | 13.75 | ||||||
| … | 2 | 13.56 | 12.38 | |||||
| … | 3 | |||||||
| … | 4 | |||||||
| HS 327-E | 1 | 13.86 | 12.99 | a | b | |||
| … | 2 | a | ||||||
| SL 519 | 1 | 14.43 | 13.83 | |||||
| … | 2 | |||||||
| NGC 2100 | 1 | |||||||
| NGC 2121 | 1 | |||||||
| KMHK 1603 | 1 | 17.85 | ||||||
Notes: a earlier observation with SOFI at ESO (van Loon et al. 2001a); b SAAO mag (Trams et al. 1999b).
4.1 Identification of IR objects
The cluster IR objects and their identification with known mid-IR sources, IR photometry and classification, and the (expected) availability of 3–4 m spectroscopy and/or Spitzer Space Telescope IRS observations are listed in Tables 2–7. Table 2 includes literature references for the individual IR objects, on a few of which we comment here:
-
•
The variable M1.5 supergiant HV 12501 (WOH S 78) has been held responsible for the mid-IR emission in KMHK 292 (Trams et al. 1999b). However, another supergiant in the cluster, WOH S 76 is brighter than HV 12501 both in the near-IR and in MSX band A.
-
•
NGC 1852-IR1 is identified with the low-excitation PN SMP LMC 31 (Morgan 1984).
-
•
NGC 1984 is associated with the bright IR source IRAS 052806910 as well as a source of OH (Wood et al. 1992) and H2O (van Loon et al. 2001b) maser emission. ATCA observations (mentioned by Wood et al. 1992, but unpublished) locate the OH maser with RA and Dec (J2000) very near the M1 red giant WOH G 347. However, our L′-band images reveal a very red object at only a few arcseconds from WOH G 347. Our mid-IR image taken with TIMMI2 at a wavelength of m clearly identifies this red star with the IRAS source: WOH G 347 contributes only 5 per cent to the total emission at this wavelength. The IRAS source and the cluster itself have been mis-identified in the past (e.g, in Simbad) with SMP LMC 64, a very low excitation PN almost an arcmin away.
-
•
SL 519-IR1 dominates the IR emission seen in the ISOCAM images (Fig. 3). Another very faint, somewhat red object is visible too: SL 519-IR2. There are three other not very red mid-IR sources which however are each blends of at least 2–3 bright individual stars.
The cumulative near-IR colour-(absolute)magnitude diagrams (Fig. 4) of all L′-band detected stars in and around all observed clusters in the SMC (open symbols) and LMC (dots) are quite similar for both Magellanic Clouds. They show the prominent branches of RGB (up to mag), AGB (up to mag), massive main-sequence stars and RSGs (the latter dominating the IR light, at mag). In the J–Ks colour, a separate branch of massive hot stars stands out, which is however difficult to distinguish in the Ks–L′ colours. At first glance it seems that the SMC supergiants are bluer than similar LMC supergiants by about 0.2 mag in both J–Ks and Ks–L′, yet the upper AGB sequences seem to coincide in the SMC and LMC.
The bright ( mag) stars with negative Ks–L′ colours are all from the clusters NGC 1994 and NGC 2004 for which only 2MASS Ks-band magnitudes are available: crowding is a severe problem for these compact clusters, and several of the brightest cluster members become blended in the 2MASS data leading to overestimates in the individual stars’ Ks-band magnitudes. The L′-band data do not suffer from the crowding and hence the Ks–L′ colours are being under-estimated. Because the blending of similar stars does not affect their 2MASS colours the effect is not apparent in the J–Ks colours.
Stars with colours or mag are considered to be ”IR objects”. These have been reddened compared to normal photospheric colours by circumstellar or interstellar selective extinction (notably affecting the J–Ks colour) or by circumstellar emission giving rise to excess emission at thermal IR wavelengths (e.g., L′). It is worth pointing out that the reddest SMC object, NGC 419-IR1 is as red as the reddest LMC objects. All objects with mag and mag are undetected in the J-band. This includes four out of five objects that form a clump in the colour-magnitude diagram around , mag. A few objects are included in our analysis that are not very red but dominate the cluster’s light at mid-IR wavelengths.
| Cluster | IR# | |||
|---|---|---|---|---|
| HS 33 | 1 | 14.26 | 11.94 | 8.79 |
| KMHK 292 | 1 | 10.05 | 8.42 | 7.14 |
| … | 2 | 10.08 | 8.62 | 7.51 |
| KMHK 285 | 1 | 15.92 | 11.28 | |
| NGC 1852 | 1 | 16.53 | 15.32 | |
| NGC 1903 | 2 | 15.17 | 13.12 | 10.32 |
| … | 3 | 10.92 | 9.78 | 8.55 |
| SL 482 | 1 | 12.50 | 12.20 | 10.72 |
| NGC 1984 | 2 | 10.42 | 8.20 | |
| … | 3 | 15.66 | 14.61 | |
| BSDL 1837 | 1 | 10.61 | 8.84 | 7.51 |
| NGC 1978 | 3 | 15.99 | 14.32 | 12.77 |
| SL 519 | 2 | 15.72 | 15.81 |
| Cluster | IR# | 10.6 | 11.9 | 12.1 | 14.7 | 21.3 |
|---|---|---|---|---|---|---|
| NGC 1984 | 1 | 6.80.7 | 5.28 | 9.9 | 19.8 | |
| … | 2 | 0.390.08 | ||||
| BSDL 1837 | 1 | 0.37: | ||||
| NGC 1994 | 1 | 1.590.21 | 1.04 | 0.9 | 1.1 | |
| HS 327-E | 1 | 0.44 | ||||
| KMHK 1603 | 1 | 0.540.06 |
| Cluster | IR# | 4.5 | 6.7 | 12.0 | 14.3 | Reference |
|---|---|---|---|---|---|---|
| Small Magellanic Cloud | ||||||
| NGC 419 | 1 | 71 | 49 | 37 | 1 | |
| … | 2 | 29 | 56 | 103 | 1 | |
| Large Magellanic Cloud | ||||||
| HS 33 | 1 | 269 | 2 | |||
| NGC 1783 | 1 | 95 | 75 | 55 | 1 | |
| BSDL 1837 | 1 | 212 | 236 | 4 | ||
| NGC 1978 | 1 | 59 | 50 | 36 | 1 | |
| … | 2 | 61 | 71 | 71 | 1 | |
| … | 4 | 40 | 15 | 1 | ||
| HS 327-E | 1 | 187 | 544 | 433 | 698 | 3 |
| … | 2 | 15 | 9.5 | 5.7 | 6.6 | 3 |
| SL 519 | 1 | 118 | 138 | 155 | 135 | 4 |
| … | 2 | 1.0 | 4.6 | 2.6 | 1.9 | 4 |
| NGC 2121 | 1 | 51 | 34 | 17 | 1 | |
4.2 IR colour-magnitude diagrams of selected clusters
The best example in our sample of an old (10 Gyr), genuine globular cluster is the very metal-poor cluster NGC 2210 in the outskirts of the LMC (Fig. 5). It shows a richly populated RGB sequence, terminating abruptly at mag. There is no sign whatsoever of an AGB sequence, nor does it contain any IR objects.
The populous intermediate-age (0.1–10 Gyr) clusters in our sample show an AGB sequence which generally continues up to mag and mag (Fig. 6). As mentioned earlier, the AGB sequences in the SMC clusters do not appear to be much bluer than those in the LMC. A good example is the SMC cluster NGC 419 of which the AGB is well populated up to mag, which is redder than some LMC clusters. NGC 1978 is a good example where the RGB can be distinguished from the AGB: the stellar density is high up to mag but then drops sharply as the RGB terminates and only the AGB continues: the AGB evolution is much more rapid than the RGB phase. Compared to NGC 2210 the RGB of more metal-rich intermediate-age clusters is redder in J–Ks.
Many of the intermediate-age clusters contain one or more IR carbon stars (Fig. 6). The most extremely dust-enshrouded IR objects are much fainter in the Ks-band than optically bright tip-AGB stars, as their dust envelopes become optically thick even at 2 m (e.g., NGC 419-IR2 at mag). Hot objects such as post-AGB objects and PNe are also fainter than tip-AGB stars at near-IR wavelengths, because they shine mostly at optical and UV wavelenghts.
The 25 Myr young SMC cluster NGC 330 displays a bright RSG branch at mag, and massive Main Sequence stars at mag (Fig. 7). The older, 130 Myr LMC cluster NGC 1866 also contains at least three very bright red giants. These must be massive ( M⊙) AGB stars. Such oxygen-rich M giants have near-IR colours that resemble those of red supergiants rather than the (redder) AGB carbon stars. The circumstellar dust shells of very luminous AGB stars and supergiants become optically thick only at much higher mass-loss rates than envelopes of lower luminosity AGB stars (cf. van Loon et al. 1997, 1998). The dearth of reddened stars in young clusters does not however mean that no mass-losing giants are present. For instance, KMHK 292-IR1 and IR2 clearly show emission from circumstellar dust despite not being much reddened by it.

NGC 1903 displays two sequences, separated in J–Ks by a few tenths of a magnitude (Fig. 8). The bluer of these sequences probably traces a young population of massive AGB stars or red supergiants, whilst the redder sequence traces an intermediate-age AGB. The brightest star, IR3 is located near the cluster centre and seems to be associated with the bluer sequence. IR1 and IR2 are both located at the fringes of the cluster and, being carbon stars (van Loon et al., in preparation), must be associated with the older AGB sequence. Hence it is likely that NGC 1903 is young and that IR1 and IR2 are associated with an intermediate-age field population or a super-imposed cluster. This is confirmed in the spatial distribution of the stars (Fig. 9): the blue Main Sequence stars with mag and the “blue”, luminous red giants with mag or mag form the cluster NGC 1903, whereas the redder, fainter red giants with mag and mag are concentrated towards the SW of the field.
In NGC 1984 we see a similar superposition of a young cluster and an intermediate-age field population (Fig. 8). The bright red supergiant WOH G 347 (IR2) and the highly obscured object IR1 are both located near the cluster centre. But IR3, located further out, is thought to be a PN and thus belongs to an intermediate-age population unrelated to the cluster.
4.3 Cluster age determinations


For the LMC clusters HS 33, KMHK 292, KMHK 285, HS 270 and BSDL 1837 no age estimates could be found in the literature. We can make crude estimates of their ages on the basis of the IR colour-magnitude diagrams, where we adopt [Fe/H] (Table 1). BSDL 1837 is thus found to be of intermediate age. Because BSDL 1837-IR1 is with L⊙ (see Table 8) twice as bright as an intermediate-age AGB star would ever be, it must be much younger than the cluster and therefore it is probably not a cluster member.
For HS 33 we had already obtained Johnson V and Cousins I-band images with the 0.9m Dutch telescope at ESO La Silla, Chile, on New Year’s Eve 1996. Multi-object photometry was obtained using DAOphot within MIDAS, and calibrated against standard stars observed in the SA 98 and T PHE fields. The I versus V–I colour-magnitude diagram (Fig. 10) is compared with isochrones from Bertelli et al. (1994) for ages of 0.1, 0.2, 1 and 10 Gyr and a metallicity of [Fe/H]. The cluster appears to have an age of 130 Myr, populating much more of the upper Main Sequence around 0 mag than of the red clump around 1.0 and mag. The 1 Gyr old RGB and AGB above the red clump are almost entirely devoid of stars in the direction of HS 33, whilst these sequences and the red clump are heavily populated with field stars surrounding the cluster. HS 33-IR1 appears to lie on the red extension of the 1 Gyr isochrone, but this is misleading as the object suffers from severe circumstellar extinction and its colour and magnitude can be traced back to the upper AGB of at most a few 100 Myr old. This is supporting evidence, both for the age of HS 33 and for IR1’s association with the cluster.

4.4 Photometric classification of cluster IR objects
The locations of dusty stars in IR colour-magnitude and colour-colour diagrams may clarify their nature. For instance, dust-enshrouded stars delineate a sequence in a J–H versus H–Ks or Ks–L′ versus J–Ks diagram (Fig. 11). Oxygen-rich star are found at the blue end of this sequence and carbon stars at the red end (cf. Frogel & Cohen 1982). The confirmed PNe, NGC 1852-IR1 and NGC 1984-IR3 lie in a disparate region of the near-IR colour-colour diagram, “below” the sequence in the J–H versus H–Ks diagram (cf. Fig. 7 in Ferraro et al. 1995) and “above” the sequence in the Ks–L′ versus J–Ks diagram. Whitelock (1985) shows that PNe can assume negative J–H colours if the He i 1.083 m line is included in the J-band filter. This is the case in the SAAO filter suite but the 2MASS and ESO (SOFI) J-band filters do not include this line.

In the Ks–[12] and Ks–[8.3] versus J–Ks and versus Ks–L′ diagrams (Fig. 12), carbon stars and oxygen-rich red giants follow unique sequences chiefly as a function of optical depth. These sequences intersect each other and identification is therefore not always conclusive. We draw the sequences for oxygen-rich AGB stars (solid line) and carbon stars (dotted line) from van Loon et al. (1997) and Trams et al. (1999b), after small adjustments to account for differences in photometric systems. Post-AGB objects stand out prominently in the Ks–[12] versus J–Ks diagram (van Loon et al. 1997) as they have strong dust emission but little extinction. Carbon stars also tend to occupy a distinct region in the [12]–[25] versus J–Ks and versus Ks–L′ diagrams (Fig. 12) because their circumstellar envelopes are warmer and become optically thick more easily, and when oxygen-rich envelopes become optically thick at mid-IR wavelengths the silicate absorption causes a reddening of the [12]–[25] colour.
The IR diagrams suggest that NGC 1903-IR3, NGC 1994-IR1 and NGC 2100-IR1 are oxygen-rich stars. HS 270-IR1, NGC 1984-IR1, NGC 1978-IR3 and SL 482-IR1 have IR colours similar to the known low-excitation PNe NGC 1852-IR1 and NGC 1984-IR3, and might have a detached dust shell.
5 Luminosities and mass-loss rates
5.1 Modelling the spectral energy distributions
The spectral energy distributions of the IR objects were modelled with the radiative transfer code dusty (Ivezić, Nenkova & Elitzur 1999). The density distribution is based upon a hydrodynamic computation of a dust-driven wind at constant mass-loss rate. The model was then scaled to match the overall observed SED, knowing the distances to the SMC and LMC objects, which then yields an accurate measurement of the bolometric luminosity.
A blackbody was used to represent the underlying stellar radiation field, with a temperature of K in the case of carbon stars and K in the case of oxygen-rich, M-type stars unless the actual temperatures were known or the fit required a hotter star.
For almost all objects the chemistry is known, and by default we chose amorphous carbon dust (Henning & Mutschke 1997) or astronomical silicate (Draine & Lee 1984) for carbon-rich and oxygen-rich objects, respectively. The extreme OH/IR objects NGC 1984-IR1 and HS 327-E-IR1 were better fit with warm, oxygen-deficient silicate from Ossenkopf, Henning & Mathis (1992), and the peculiar carbon-rich object NGC 1978-IR3 required the inclusion of 20 per cent silicon carbide (SiC, from Pégourié 1988). A fit to SL 482-IR1 was obtained with cold, oxygen-rich silicate from Ossenkopf et al. (1992) and a very thin shell geometry to mimic an isothermal dust envelope at K. We used either a single dust grain size, or a standard MRN grain size distribution (a power-law with exponent ; Mathis, Rumpl & Nordsieck 1977).
To obtain the mass-loss rate one has to know the dust grain density, for which we adopt g cm-3, and the gas-to-dust mass ratio. Very little is known about the latter, which may vary according to the environmental conditions — metallicity and chemistry, radiation field, and evolutionary state. We adopt a reference value of for solar metallicity, and scale this value according to the cluster metallicity (Table 1) as .
The input parameters and output results are summarised in Table 8. Here we also list the initial mass for the cluster member descended from the heaviest Main-Sequence progenitor, , which is taken from the Bertelli et al. (1994) isochrones. These masses are representative for the cluster IR objects that are expected to be the most evolved stars in the clusters. For comparison we also list the Main-Sequence Turn-Off masses, defined here as the mass of the Main Sequence star that has reached its (first) maximum in effective temperature as its core becomes depleted in hydrogen.
| Cluster | IR# | Classification | Lspec | SST |
| Small Magellanic Cloud | ||||
| NGC 419 | 1 | AGB carbon | 3505 | |
| … | 2 | AGB carbon | 3505 | |
| Large Magellanic Cloud | ||||
| HS 33 | 1 | AGB carbon star | 1,2 | 1094 |
| KMHK 292 | 1 | M supergiant | ||
| … | 2 | M1.5 supergiant | ||
| KMHK 285 | 1 | AGB carbon star | 2 | 3505 |
| NGC 1783 | 1 | AGB carbon star | ||
| NGC 1852 | 1 | PN | 103 | |
| NGC 1903 | 1 | AGB carbon star | 4 | |
| … | 2 | AGB carbon star | 4 | |
| … | 3 | RSG? Oxygen AGB? | ||
| HS 270 | 1 | (post-)AGB star? | ||
| SL 453 | 1 | AGB carbon star | 4 | |
| SL 482 | 1 | Hot and dusty? | ||
| NGC 1984 | 1 | OH/IR star | 4 | 1094 |
| … | 2 | M1 (super)giant | 4 | |
| … | 3 | PN | ||
| BSDL 1837 | 1 | M1 (super)giant | ||
| NGC 1994 | 1 | RSG? Oxygen AGB? | ||
| NGC 1978 | 1 | AGB carbon star | 4 | 3505 |
| … | 2 | AGB carbon star | 4 | 3505 |
| … | 3 | (post-)AGB carbon star | ||
| … | 4 | C? Oxygen-rich? | 3505 | |
| HS 327-E | 1 | OH/IR star | 1 | |
| … | 2 | AGB carbon star | ||
| SL 519 | 1 | AGB carbon star | 4 | |
| … | 2 | Post-AGB? Carbon star? | ||
| NGC 2100 | 1 | RSG? Oxygen AGB? | ||
| NGC 2121 | 1 | AGB carbon star? | ||
| KMHK 1603 | 1 | AGB carbon star | 3 | |
= SST #3725 of P. Goudfrooij maps NGC 1783 with IRAC
5.2 Luminosities and nature of cluster IR objects
Not surprisingly, all cluster IR objects are luminous (Fig. 13b). Where the cluster has a RGB, the cluster IR objects were always more luminous than the RGB tip. The only exception is the faint object SL 519-IR2, of which the exact nature is uncertain. Most objects straddle along the maximum luminosity reached within a cluster (the curve in Fig. 13b, derived from Bertelli et al. 1994).
It is especially interesting to note that the luminous carbon star HS 33-IR1 matches very well the expected luminosity at the tip of the AGB for the cluster HS 33. This lends support to the interpretation of it having evolved from a massive AGB star progenitor ( M⊙).
All dust-enshrouded stars with progenitors of M⊙ are carbon stars, whilst stars with progenitor masses of M⊙ are always oxygen-rich.
Our sample includes four clusters with M⊙. No IR-excess objects were found in the SMC cluster NGC 458, despite its richness and rather high metallicity. The LMC cluster objects SL 453-IR1, HS 327-E-IR2 and SL 519-IR1 are carbon stars. These are the only cluster IR objects that have luminosities that are significantly lower than the maximum possible luminosity. However, the brightest IR object in these clusters, HS 327-E-IR1 is an oxygen-rich object of which the luminosity is right at the tip of the AGB for that cluster age. It has been argued (van Loon et al. 2001a) that the coincidence of carbon stars and more luminous oxygen-rich stars in populations with an age of yr suggests that M⊙ is the threshold of Hot Bottom Burning (HBB; Boothroyd & Sackmann 1992), with the luminous oxygen-rich AGB star descendent from a progenitor with a slightly larger mass than this threshold and the carbon star having a slightly lower mass. Alternatively, a second parameter might be involved, such as rotation or a metallicity spread.
The late stages in the evolution of stars with progenitor masses in the range –8 M⊙ (shaded regime in Fig. 13) are uncertain, with the Bertelli et al. (1994) models suggesting that the maximum progenitor mass of an AGB star is M⊙. The oxygen-rich red giant NGC 1903-IR3 is the only cluster IR object found in the three clusters in this mass range. It is more luminous than expected, which may be due to HBB (the Bertelli tracks do not include HBB).
Unfortunately we did not find cluster IR objects in our sample around M⊙. Such stars are believed to become “super-AGB” stars that follow a thermal-pulsing AGB evolution but go on to ignite core-carbon burning (Ritossa, Garcia-Berro & Iben 1996). The supergiants of –19 M⊙ that we did find have luminosities that match very well the expected luminosities for the clusters they are associated with.
| Cluster | IR# | [Fe/H] | dust | cluster | |||||||
| (M⊙) | (M⊙) | (K) | (K) | type | (m) | (L⊙) | (M⊙/yr) | member | |||
| Small Magellanic Cloud | |||||||||||
| NGC 419 | 1 | 0 | 1.98 | 1.57 | 2800 | 1000 | AmC | 0.2 | 4.00 | 5.00 | yes |
| … | 2 | … | … | … | 2800 | 700 | AmC | 0.1 | 3.85 | 4.34 | yes |
| Large Magellanic Cloud | |||||||||||
| HS 33 | 1 | 4.8 | 4.0 | 2500 | 720 | AmC | 0.01–0.1 | 4.61 | 4.54 | yes? | |
| KMHK 292 | 1 | 15.0 | 11.9 | 3000 | 400 | Sil-DL | 0.1 | 5.37 | 4.62 | yes | |
| … | 2 | … | … | … | 3000 | 350 | Sil-DL | 0.1 | 5.17 | 5.20 | yes |
| KMHK 285 | 1 | 2.21 | 1.73 | 2800 | 600 | AmC | 0.01–0.1 | 3.99 | 4.57 | yes | |
| NGC 1783 | 1 | 5 | 1.32 | 1.16 | 2800 | 1100 | AmC | 0.1 | 3.93 | 4.90 | yes |
| NGC 1852 | 1 | 5 | 1.31 | 1.16 | 28600 | 500 | AmC | 10 | 4.29 | 4.25 | yes |
| NGC 1903 | 1 | 6.3 | 5.3 | 2800 | 1300 | AmC | 0.01–0.1 | 3.99 | 5.11 | no | |
| … | 2 | … | … | … | 2800 | 1500 | AmC | 0.01–0.1 | 3.84 | 5.43 | no |
| … | 3 | … | … | … | 3000 | 1200 | Sil-DL | 0.01–0.1 | 4.66 | 4.87 | yes |
| HS 270 | 1 | 2.21 | 1.73 | 2500 | 225 | AmC | 0.01–0.3 | 3.94 | 4.15 | yes | |
| SL 453 | 1 | 4.0 | 3.3 | 2500 | 1100 | AmC | 0.01–0.1 | 3.70 | 4.75 | yes | |
| SL 482 | 1 | 13.7 | 11.1 | 20000 | 750 | Sil-Oc | 0.1 | 5.19 | 4.02 | yes | |
| NGC 1984 | 1 | 0 | 19.1 | 14.3 | 15000 | 400 | Sil-Ow | 0.01–0.1 | 5.39 | 2.38 | yes |
| … | 2 | … | … | … | 4000 | 1000 | Sil-DL | 0.1 | 5.10 | 4.25 | yes |
| … | 3 | … | … | … | 31000 | 650 | AmC | 0.1–0.2 | 4.47 | 4.91 | no |
| BSDL 1837 | 1 | 2.21 | 1.73 | 2500 | 1000 | Sil-DL | 0.1 | 5.04 | 5.03 | no | |
| NGC 1994 | 1 | 4 | 14.1 | 11.7 | 2500 | 600 | Sil-DL | 0.1 | 4.90 | 4.02 | yes |
| NGC 1978 | 1 | 6 | 1.42 | 1.30 | 2500 | 1000 | AmC | 0.1 | 3.73 | 5.05 | yes |
| … | 2 | … | … | … | 2500 | 1100 | AmC | 0.1 | 3.77 | 4.80 | yes |
| … | 3 | … | … | … | 2500 | 300 | AmC+SiC | 0.01–5.0 | 3.70 | 4.39 | yes? |
| … | 4 | … | … | … | 2500 | 1000 | AmC | 0.1 | 4.19 | 5.46 | yes |
| HS 327-E | 1 | 0.4 | 4.0 | 3.3 | 2500 | 800 | Sil-Ow | 0.01–0.1 | 4.45 | 3.90 | yes |
| … | 2 | … | … | … | 2500 | 200 | AmC | 0.1 | 3.89 | 5.83 | yes |
| SL 519 | 1 | 4.0 | 3.3 | 2500 | 650 | AmC | 0.01–0.1 | 3.84 | 4.67 | yes | |
| … | 2 | … | … | … | 2500 | 830 | AmC | 0.2 | 2.58 | 6.26 | yes? |
| NGC 2100 | 1 | 2 | 14.3 | 11.7 | 2500 | 300 | Sil-DL | 0.1 | 4.87 | 4.69 | yes |
| NGC 2121 | 1 | 1 | 1.31 | 1.15 | 2500 | 1200 | AmC | 0.2 | 3.95 | 5.36 | yes |
| KMHK 1603 | 1 | 0 | 2.17 | 1.68 | 2500 | 600 | AmC | 0.1 | 4.09 | 4.33 | yes |
5.3 The contribution of dust-enshrouded red giants to the integrated cluster IR brightness
Dust-enshrouded giants do not contribute to the optical brightness of the cluster they are in, but they dominate the integrated cluster brightness at mid-IR wavelengths of m even in populous clusters. Thus, the mid-IR brightness of a cluster cannot be reliably predicted as the rare occurrence of a dust-enshrouded red giant is a stochastic event. However, if the combined effect of many clusters is considered, then a sufficient number of dust-enshrouded red giants will always be present and the fluctuations will be small. Computations of Single Stellar Populations (Bressan, Granato & Silva 1998; Piovan, Tantalo & Chiosi 2003) may therefore yield reliable predictions for elliptical galaxies but not for star clusters.
With a central wavelength of 3.5 m, IRAC channel 1 on-board the Spitzer Space Telescope is similar to the L-band; what is the contribution of the dust-enshrouded red giants to the cluster brightness in the L′-band? Consider the example of NGC 419, a populous cluster with two very red dust-enshrouded carbon stars. The combined brightness of these two IR objects is mag. The combined brightness of all other stars in the ISAAC fields above the RGB tip ( mag; see Section 5.5) is mag. Including all fainter stars down to mag the cluster brightness becomes mag. This estimate excludes the (small) contribution of even fainter cluster members as well as stars outside of the ISAAC field of view. Thus, the two IR objects contribute per cent to the integrated cluster brightness. For smaller clusters the contribution can be much larger and the cluster L′-band brightness becomes completely stochastic.

5.4 Mass-loss rates of cluster IR objects
Most cluster IR objects are fairly evenly distributed over more than a decade in mass-loss rate with a maximum of M⊙ yr-1 (Fig. 13c). The spread in mass-loss rates for a given progenitor mass is due to evolutionary effects, as the stars are not always captured at the highest mass-loss rate. This effect can be traced by the position of the star in the Hertzsprung-Russell diagram, and van Loon et al. (1999b, 2005) indeed show empirical evidence for a dependence of the mass-loss rate on the bolometric luminosity and stellar effective temperature.
However, upon closer inspection it seems that the lower mass progenitors, M⊙, reach mass-loss rates that are lower than those of somewhat higher mass progenitors, M⊙, whilst the highest mass-loss rate occurs at an even higher progenitor mass of M⊙. A similar tendency is seen amongst the massive progenitors of M⊙. As both the (maximum) luminosity and cluster metallicity increase with increasing progenitor mass, it is difficult to ascertain the physical cause for the dependence of the mass-loss rate on progenitor mass.
Objects with detached shells (triangles in Fig. 13) are always the stars with the highest mass-loss rate at a given progenitor mass. For these stars the mass-loss rate refers to the detached dust shell and is thus a historic account of the mass loss experienced some time in the past (typically a few centuries ago). Hence the most likely explanation is that these are stars which have just emerged from the most intense superwind phase in their evolution. Amongst these, the luminous OH/IR object NGC 1984-IR1 had an extremely high mass-loss rate of M⊙ yr-1. Modelling the SED using a cool star of 2500 K hardly affects the estimate of its luminosity but the mass-loss rate would be even higher by 50 per cent.
| (M⊙) | (Gyr) | (M⊙) | (M⊙ yr-1) | (Gyr) | (M⊙) | (M⊙) | |||
|---|---|---|---|---|---|---|---|---|---|
| 10 | 0.03 | 0.03 | 68 | 7 | 0.10 | ||||
| 3–10 | 0.03–0.4 | 1 | 48 | 7 | 0.15 | ||||
| 1.8–3 | 0.4–1.4 | 1 | 31 | 5 | 0.16 | ||||
| 1.3–1.8 | 1.4–3 | 10 | 36 | 7 | 0.19 | ||||
| 1.3 | 3 | 10 | 5 | 0 | 0.00 |
No cluster IR objects are found in clusters with either M⊙ or [Fe/H] (Fig. 13a). The L′-band observations were sensitive enough to have detected all AGB stars and stars on the top magnitude of the RGB even if they had no L′-band excess, and the old clusters included some populous globular clusters with plenty of red giants. The threshold for identification as an IR object is M⊙ yr-1 (Table 8). Lower mass-loss rates, a lower dust content or a shorter duration of the mass-loss episode (or a combination of these) might explain the dearth of cluster IR objects with M⊙.
Unfortunately, there is an age-metallicity degeneracy in the sense that there are no old metal-rich clusters or young metal-poor clusters. Galactic globular clusters, that are all old but span a metallicity range from [Fe/H] to solar, show a clear threshold around [Fe/H] below which no large-amplitude (Mira-type) pulsating stars are found (Frogel & Elias 1988). With pulsation believed to be an essential first stage in the mass-loss of red giants, failure to pulsate strongly enough might explain the absence of dust-enshrouded red giants at [Fe/H].
5.5 Timescales of mass-loss
To estimate the impact of mass loss in the superwind stage relative to the total stellar mass, we could compare the total mass-loss rate with the total cluster mass (Table 9). We do this for different ranges in the initial mass of the mass-losing stars, corresponding to different ranges in cluster ages (these are approximate as they also depend somewhat on initial metallicity). The older clusters in our sample comprise an order of magnitude more mass than the younger clusters, but the total mass-loss rate is much higher in the younger clusters. This results in a very strong age dependence of the timescale for the cluster mass to decrease, .
In principle this timescale is the time it takes for the entire cluster mass to be dissipated if the current mass-loss rate were sustained. For stellar systems in general (such as galaxies) it is the timescale for the feedback mechanism to return all mass back into the ISM. It is remarkable that although the estimated timescales span a range of more than two orders of magnitude, they are always about 2 to 3 times the cluster age.
Another approach to quantify the timescale for mass loss is to compare the number of cluster IR stars to the number of stars in an evolutionary stage for which the timescale is known. For the latter we choose to count the number of stars in our L′-band images that are brighter than the RGB tip, which occurs at mag (Table 1). This has a different meaning for clusters of different ages, for instance young clusters do not contain any RGB stars, and will need to be calibrated against stellar evolutionary models. But for a wide range of cluster age it does provide a rough measure for the number of AGB stars on the thermal-pulsing AGB, whilst for the younger clusters it provides a measure for the number of post-Main Sequence supergiants. The latter is a consequence of our definition of the RGB tip in the L′-band which, coupled with large bolometric corrections for blue Main Sequence stars discriminates between massive Main Sequence stars and redder post-Main Sequence supergiants.
The ratio of IR objects to the total number of stars above the RGB tip is the same within a factor two for all clusters except the oldest clusters, in which we did not find any IR object and which anyhow contain very few stars above the RGB tip. The ratios indicate that the superwind timescales are 10–20 per cent of the time stars spend at mag. There is a hint of a trend for this timescale to be longer for older clusters (up to 20 per cent) compared to younger clusters with AGB stars (15 per cent) and the youngest clusters with red supergiants (10 per cent). Intermediate-mass stars spend about yr above the RGB tip, which implies a timescale of 1–2 yr for the superwind phase in which the stars become bright IR objects. This corresponds to only a few thermal pulses, presumably the final ones, and is consistent with the fact that the IR objects are found within a magnitude from the AGB tip: this magnitude range can be fully accounted for by luminosity variations over the thermal pulse cycle of a factor three (the evolutionary timescale for an AGB star to increase in luminosity by a magnitude is about yr). These timescales and timing at the end of AGB evolution confirm model predictions (e.g., Vassiliadis & Wood 1993).
For the low- and intermediate-mass AGB stars one can estimate the importance of the superwind phase compared to the more moderate AGB mass loss. Stars of initial masses 1.3–1.8 M⊙ will loose about 1 M⊙ on the AGB. We find 36 stars above the RGB tip in the cluster sample (Table 9), which should therefore loose 36 M⊙ in total. The ratio of this mass lost and the integrated mass-loss rate of M⊙ yr-1 yields a duration of yr required for this mass to be lost exclusively during the superwind phase. The same exercise for stars in the 1.8–3 M⊙ range, which loose about 2 M⊙ on average, yields an identical estimate for this timescale. Given the above derived superwind timescale of 1–2 yr this implies that a significant fraction of the mass loss (30–70 per cent) indeed occurs during the superwind phase, again confirming model predictions (e.g., Wachter et al. 2002).
The underlying cluster mass associated with each super-RGB-tip star increases as the cluster ages. This can be turned around and used to estimate the underlying cluster mass when the brightest (in L′) cluster members can be counted, provided that the cluster age is known. We thus obtain a first crude estimate of such relation:
| (3) |
6 Summary of conclusions
We present the results of a search for dusty evolved stars in star clusters in the Magellanic Clouds. The survey was performed in first instance through imaging in the near-IR L′ band (at 3.8 m) with ISAAC at the ESO-VLT. Comparison with imaging photometry at shorter (J, H and/or Ks) and longer (MSX, IRAS, ISO and groundbased mid-IR) wavelengths allowed the identification of objects that are surrounded by dust causing extinction in the optical and near-IR and excess emission in the thermal IR. Targets were selected to include populous clusters spanning a range in age and metallicity, and clusters that were already known or suspected to be associated with sources of bright IR emission.
Out of 9 clusters in the SMC and 29 clusters in the LMC, 19 clusters (of which one in the SMC) were found to contain a total of 30 stars with IR excess emission. Of these, 4 stars are probably not physically associated with the cluster. We establish the nature of the majority of the cluster IR objects (i.e. their spectral class and evolutionary state). They are all highly evolved, and include post-superwind objects such as Planetary Nebulae. No dusty stars are found for initial masses M⊙ or initial metallicities [Fe/H]. All objects in the range M⊙ are carbon stars, and all objects with M⊙ are oxygen-rich giants or supergiants.
We estimate the bolometric luminosities and mass-loss rates by modelling the spectral energy distributions with the dusty code. The IR objects are the most luminous cluster objects, nearly always at the maximum luminosity expected for their initial mass and metallicity. The mass-loss rate increases with larger progenitor mass, which may be due to a dependence on the initial metallicity or simply the luminosity. Post-superwind objects always have the highest mass-loss rates associated with them, where these mass-loss rates refer to the previous superwind stage.
Stars brighter than the RGB tip in the L′-band spend 10–20 per cent of their time ( yr) as IR objects with mass-loss rates that exceed a few M⊙ yr-1. About half of the mass lost by low- and intermediate-mass AGB stars occurs during this superwind phase.
The number of stars above the RGB tip (in L′) can be used to estimate the cluster mass, a relation for which we present a first crude estimate.
Acknowledgements.
We thank all telescope operators who have been involved in the observations, and the anonymous referee for her/his very positive remarks. JRM acknowledges support through a PPARC studentship. This publication makes use of data products from the Two Micron All Sky Survey, which is a joint project of the University of Massachusetts and the Infrared Processing and Analysis Center/California Institute of Technology, funded by the National Aeronautics and Space Administration and the National Science Foundation. This research also made use of data products from the Midcourse Space Experiment. Processing of the data was funded by the Ballistic Missile Defense Organization with additional support from NASA Office of Space Science. This research has also made use of the NASA/ IPAC Infrared Science Archive, which is operated by the Jet Propulsion Laboratory, California Institute of Technology, under contract with the National Aeronautics and Space Administration. We also acknowledge the use of the SIMBAD database and VizieR, operated at Centre de Données astronomiques de Strasbourg, France.References
- (1) Aaronson M., Mould J. 1985, ApJ 288, 551
- (2) Beasley M.A., Hoyle F., Sharples R.M. 2002, MNRAS 336, 168
- (3) Bertelli G., Bressan A., Chiosi C., Fagotto F., Nasi E. 1994, A&AS 106, 275
- (4) Bica E.L.D., Schmitt H.R. 1995, ApJS 101, 41
- (5) Bica E., Clariá J.J., Dottori H., Santos J.F.C., Piatti A.E. 1996, ApJS 102, 57
- (6) Bica E.L.D., Schmitt H.R., Dutra C.M., Oliveira H.L. 1999, AJ 117, 238
- (7) Boothroyd A.I., Sackmann I.-J. 1992, ApJ 393, L21
- (8) Bressan A., Granato G.L., Silva L. 1998, A&A 332, 135
- (9) Cioni M.-R.L., Loup C., Habing H.J. 2000, A&AS 144, 235
- (10) Da Costa G.S., Hatzidimitriou D. 1998, AJ 115, 1934
- (11) de Freitas Pacheco J.A., Barbuy B., Idiart T. 1998, A&A 332, 19
- (12) Draine B.T., Lee H.M. 1984, ApJ 285, 89
- (13) Egan M.P., Van Dyk S.D., Price S.D. 2001, AJ 122, 1844
- (14) Elias J.H., Frogel J.A., Humphreys R.M. 1985, ApJS 57, 91
- (15) Elson R.A.W. 1991, ApJS 76, 185
- (16) Ferraro F.R., Fusi Pecci F., Testa V., et al. 1995, MNRAS 272, 391
- (17) Frogel J.A., Cohen J.G. 1982, ApJ 253, 580
- (18) Frogel J.A., Elias J.H. 1988, ApJ 324, 823
- (19) Frogel J.A., Mould J., Blanco V.M. 1990, ApJ 352, 96
- (20) Geisler D., Bica E., Dottori H., et al. 1997, AJ 114, 1920
- (21) Henning Th., Mutschke H. 1997, A&A 327, 743
- (22) Hill V., François P., Spite M., Primas F., Spite F. 2000, A&A 364, L19
- (23) Israel F.P., Koornneef J. 1991, A&A 248, 404
- (24) Ivezić Ž., Nenkova M., Elitzur M. 1999, User manual for dusty. University of Kentucky Internal Report
- (25) Kontizas M. 1980, A&AS 40, 151
- (26) Leisy P., Dennefeld M., Alard C., Guibert J. 1997, A&AS 121, 407
- (27) Lloyd-Evans T. 1980, MNRAS 193, 87
- (28) Lloyd-Evans T. 1983, MNRAS 204, 985
- (29) Loup C., Zijlstra A.A., Waters L.B.F.M., Groenewegen M.A.T. 1997, A&AS 125, 419
- (30) Mackey A.D., Gilmore G.F. 2003a, MNRAS 338, 85
- (31) Mackey A.D., Gilmore G.F. 2003b, MNRAS 338, 120
- (32) Marigo P., Girardi L., Chiosi C. 1996, A&A 316, L1
- (33) Marshall J.R., van Loon J.Th., Matsuura M., et al. 2004, MNRAS 355, 1348
- (34) Mateo M. 1988, ApJ 331, 261
- (35) Mathis J.S., Rumpl W., Nordsieck K.H. 1977, ApJ 217, 425
- (36) Matsuura M., Zijlstra A.A., van Loon J.Th., et al. 2002, ApJ 580, L133
- (37) Mighell K.J., Sarajedini A., French R.S. 1998, AJ 116, 2395
- (38) Morgan D.H. 1984, MNRAS 208, 633
- (39) Mould J., Aaronson M. 1979, ApJ 232, 421
- (40) Nishida S., Tanabé T., Nakada Y., et al. 2000, MNRAS 313, 136
- (41) Oliva E., Origlia L. 1998, A&A 332, 46
- (42) Olszewski E., Schommer R., Suntzeff N., Harris H. 1991, AJ 101, 515
- (43) Omont A., Gilmore G.F., Alard C., et al. 2003, A&A 403, 975
- (44) Ossenkopf V., Henning Th., Mathis J.S. 1992, A&A 261, 567
- (45) Pégourié B. 1988, A&A 194, 335
- (46) Pietryński G., Udalski A. 2000, Acta Astronomica 50, 337
- (47) Piovan L., Tantalo R., Chiosi C. 2003, A&A 408, 559
- (48) Reid N., Tinney C., Mould J. 1990, ApJ 348, 98
- (49) Ritossa C., Garcia-Berro E., Iben I. Jr. 1996, ApJ 460, 489
- (50) Sanduleak N., MacConnell D.J., Philip A.G.D. 1978, PASP 90, 621
- (51) Tanabé T., Nishida S., Matsumoto S., et al. 1997, Nature 385, 509
- (52) Tanabé T., Nishida S., Nakada Y., et al. 1999, in: Asymptotic Giant Branch Stars, IAU Symposium #191, Eds. T. Le Bertre, A. Lèbre & C. Waelkens. p573
- (53) Tanabé T., Kučinskas A., Nakada Y., Onaka T., Sauvage M. 2004, ApJS 155, 401
- (54) Trams N.R., van Loon J.Th., Zijlstra A.A., et al. 1999a, A&A 344, L17
- (55) Trams N.R., van Loon J.Th., Waters L.B.F.M., et al. 1999b, A&A 346, 843
- (56) Vallenari A., Bettoni D., Chiosi C. 1998, A&A 331, 506
- (57) van Loon J.Th., Zijlstra A.A., Groenewegen M.A.T. 1999a, A&A 346, 805
- (58) van Loon J.Th., Zijlstra A.A., Whitelock P.A., et al. 1997, A&A 325, 585
- (59) van Loon J.Th., Zijlstra A.A., Whitelock P.A., et al. 1998, A&A 329, 169
- (60) van Loon J.Th., Groenewegen M.A.T., de Koter A., et al. 1999b, A&A 351, 559
- (61) van Loon J.Th., Zijlstra A.A., Kaper L., et al. 2001a, A&A 368, 239
- (62) van Loon J.Th., Zijlstra A.A., Bujarrabal V., Nyman L.-Å. 2001b, A&A 368, 950
- (63) van Loon J.Th., Marshall J.R., Matsuura M., Zijlstra A.A. 2003, MNRAS 341, 1205
- (64) van Loon J.Th., Cioni M.-R.L., Zijlstra A.A., Loup C. 2005, A&A 438, 273
- (65) Vassiliadis E., Wood P.R. 1993, ApJ 413, 641
- (66) Villaver E., Stanghellini L., Shaw R.A. 2003, ApJ 597, 298
- (67) Wachter A., Schröder K.-P., Winters J.M., Arndt T.U., Sedlmayr E. 2002, A&A 384, 452
- (68) Westerlund B.E., Olander N., Hedin B. 1981, A&AS 43, 267
- (69) Whitelock P.A. 1985, MNRAS 213, 59
- (70) Whitelock P.A., Feast M.W., van Loon J.Th., Zijlstra A.A. 2003, MNRAS 342, 86
- (71) Wood P.R., Cohen M. 2001, in: Post-AGB Objects as a Phase of Stellar Evolution, Eds. R. Szczerba & S. K. Górny. Ap&SS Library Vol. 265. Kluwer Academic Publishers. p71
- (72) Wood P.R., Whiteoak J.B., Hughes S.M.G., et al. 1992, ApJ 397, 552