Measuring the Growth of Structure with Spectroscopically Identified Galaxy Groups and Clusters
Number counts of galaxy clusters offer a very promising probe of the Dark Energy (DE) equation-of-state parameter, . The basic goal is to measure abundances of these objects as a function of redshift, compare this to a theoretical prediction, and infer the values of cosmological parameters. Various teams have proposed such a measurement, including the South Pole Telescope, the Dark Energy Survey and the Red-Sequence Cluster Survey. The specific study discussed here detects clusters and smaller galaxy groups in the three-dimensional distribution of galaxies inferred from a large spectroscopic redshift survey. This method allows the abundance, , of groups and clusters to be measured as a function of velocity dispersion, as well as of redshift, permitting a more sensitive test of cosmology.
This test is one of the principal science goals of the DEEP2 Galaxy Redshift Survey, a spectroscopic survey of galaxies over a primary redshift range of , using the DEIMOS spectrograph on the ten-meter Keck II telescope. The survey, which is now nearly complete, has surveyed square degrees on the sky to a limiting magnitude of , with a sampling rate of in the targeted redshift range. The full survey required 80 nights of observation at Keck.
In addition, a multiwavelength suite of observations is ongoing in a subregion of the DEEP2 area, the Extended Groth Strip (RA: 14 17, Dec: +52 30). Possible systematic errors in both DEEP2 and other cluster samples could be controlled by comparing to these data. Observations in this region with potential application to clusters include Chandra X-ray observations, infrared photometry with Spitzer and ground-based telescopes for stellar masses, optical space- (HST) and ground-based (CFHT Legacy Survey) imaging for weak lensing studies, many-band photometric redshifts, and SZ observations.
We discuss here the DE constraints expected from DEEP2, as well as the projected constraints for a similar survey with times as much sky coverage. DEEP2 has the power to constrain to (1) without combining with other dark energy constraints; the larger survey could constrain to .
1 The Measurement
By counting the abundance of groups and clusters as a function of their redshift and velocity dispersion , we can probe the dark energy in two ways. The measured quantity in this test is
The comoving volume element, , has a strong dependence on , as does the comoving number density of dark matter halos, . The former dependence can be written down in analytic terms, while the latter can be computed via N-body simulations or by semi-analytic methods [1] (since the velocity dispersion of galaxies in a cluster reflects the cluster’s potential well depth, a directly predictable quantity in spherical-collapse models). Cluster counts as a function of and are a more sensitive probe of DE than is the abundance as a function of alone.
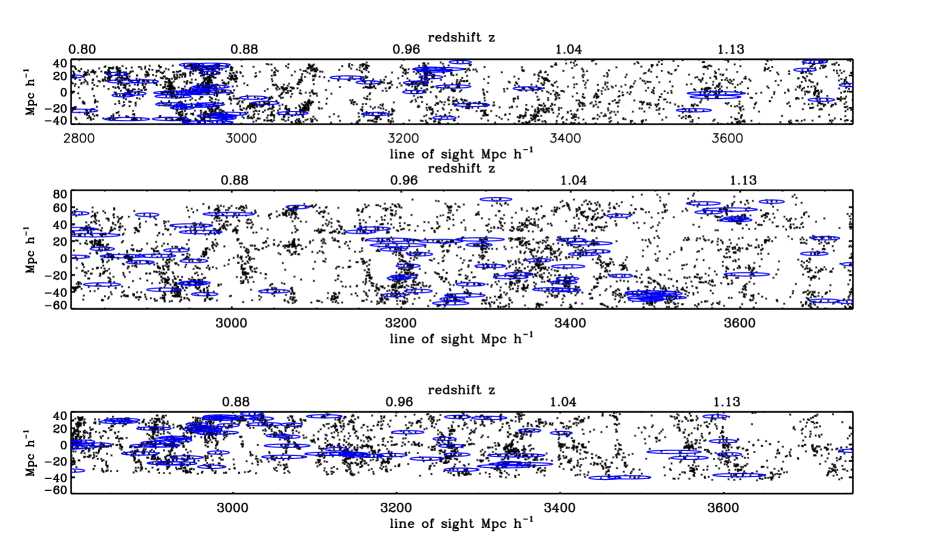
Groups and clusters of galaxies in the DEEP2 survey are detected with an automated cluster-finding algorithm that searches for overdensities of galaxies in redshift space [2, 3]. Importantly, this algorithm detects clusters regardless of the properties of their member galaxies, so it does not require knowledge of the evolution of those properties. We have already applied this algorithm to the DEEP2 data; the positions of some DEEP2 groups and clusters are shown in Figure 1.
Since this cosmological test relies on the evolution of cluster abundance, it is useful to have a local sample of groups and clusters against which to compare the sample detected in DEEP2. Existing data from 2dF and SDSS should be sufficient for this purpose.
2 Necessary Precursors
The crucial DEEP2 and SDSS data for this test are already in hand; no further observations are required. The developments needed now lie in the realms of simulation and data analysis.
First, it is necessary that we understand how the velocity dispersion of galaxies, which we can measure, relates to the velocity disperison of dark matter, which is what we can most easily predict. There is reason to believe that the two are not equal—i.e., that there is a so-called “velocity bias” in galaxy clusters. Attempts are underway to model this using N-body and hydrodynamic simulations [4, 5, 6]; if it is not constrained, the velocity bias could be a significant source of systematic error in the DEEP2 cosmological constraints.
Second, because constraints on are strongly degenerate with other cosmological parameters that are measurable at low redshift, the power of DEEP2 to constrain DE would be greatly improved if these parameters could be fixed elsewhere. For example, it is expected that the Sloan Digital Sky Survey (SDSS) will be able to constrain independent of galaxy cluster searches; great progress is now being made on techniques for this [7, 8]. Because the local cluster abundance primarily depends on a degenerate combination of and , fixing will then provide a tight constraint in the direction (with modest degeneracy) from SDSS clusters. The high-redshift cluster abundance depends sensitively on these two parameters; if they are poorly known, the constraints on DE available from DEEP2 will be greatly degraded. In all parameter constraint plots shown, we assume that is known and that a cluster sample has been obtained over the entire SDSS volume with systematic errors equal to those in DEEP2; constraints would be slightly different if both and were simply fixed.
Finally, looking to the future, we expect that a potential twentyfold larger future survey modeled on DEEP2 would require a preliminary deep, wide-field photometric survey, covering tens of square degrees in at least three photometric bands, to allow selection of spectroscopic targets at high redshift.
3 Error Budget
3.1 Statistical Errors
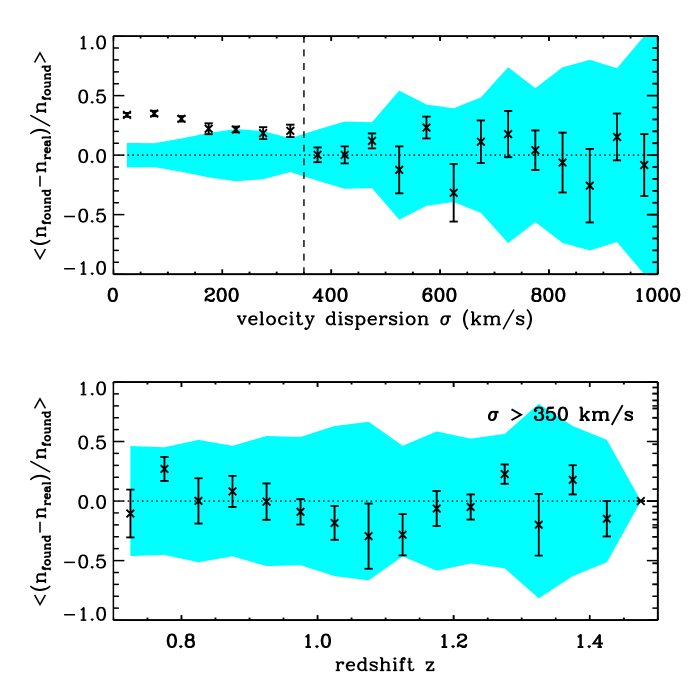
There are two sources of statistical error in this experiment—Poisson error and cosmic variance. The former is just the uncertainty expected in counting objects, while the latter is the excess variance in that arises because galaxy clusters are themselves clustered together, rather than being randomly distributed in space, so that no finite volume of space constitutes a completely fair sample. The fractional effect of these two types of error on the measured cluster abundance is shown by the shaded region in Figure 2.
3.2 Systematic Errors
In addition, there are three principal sources of systematic error. The first is a measurement bias in due to errors in cluster detection. Any automated cluster-finding algorithm in redshift space is subject to some level of contamination from false detections and incompleteness due to missed clusters. Furthermore, the membership of individual clusters is often imperfectly reconstructed, which leads to errors in measured velocity dispersions. These errors can lead to systematically incorrect measurements of .
To guard against this source of error, we have calibrated our cluster-finding algorithm for DEEP2 by applying it to a set of twelve mock galaxy catalogs [9] with the same geometry as the DEEP2 survey. These have been created by populating dark-matter-only N-body simulations with galaxies according to the so-called “halo model.” This model places galaxies in dark matter halos according to a halo-occupation distribution (HOD), which specifies the average number of galaxies occupying a halo of mass . As shown in Figure 2, when the cluster finder has been properly calibrated, measurement bias errors are substantially smaller than the expected statistical error in the DEEP2 sample for velocity dispersions km/s.
This calibration method leads to a second potential source of systematic error, however. The HOD used to create the DEEP2 mock catalogs is chosen to be consistent with the two-point correlation function and number density of DEEP2 galaxies, but it is not uniquely specified by these statistics. If the HOD we use for calibration does not perfectly reflect the real universe, it is possible that our cluster-finder will be mis-calibrated. We have explored the systematic errors introduced by changing the HOD, and we find that, for HODs that are consistent with DEEP2, such errors are substantially smaller than the expected statistical error.
The final major potential source of systematic error in this experiment is the velocity bias discussed in Section 2. This parameter is defined as the ratio of the velocity dispersion of galaxies in clusters to the velocity dispersion of the dark matter particles: . There is evidence from simulations [4, 5, 6] that differs from unity by , but so far there is debate about the magnitude of this effect. Because varies rapidly with , a systematic error in could translate to a much larger () error in the abundance. Hence, unless the value of can be better constrained by simulations, it will be a dominant source of uncertainty in this experiment. Fortunately, as N-body and hydrodynamical simulations improve, it should be possible to determine the value of separately from measurements of .
Finally, it is important to note how the error budget would change in the case of a significantly larger survey. If it were possible to cover an area 20 times larger than DEEP2, the cosmic variance would be reduced by a factor of (in the most pessimistic scenario in which a single large field is surveyed, cosmic variance errors will only will be reduced by ). In such a scenario, the systematic errors discussed above would dominate the measurement. A large survey would therefore necessitate a more accurate cluster-finding method, as well as a more well-constrained HOD and velocity bias parameter.
3.3 Assumed Priors
We assume two priors in parameter space when we estimate parameter constraints that will be possible with DEEP2. We first assume that the universe is flat, i.e., that at late times. We further assume that SDSS will fix the value of to high precision (i.e., well enough that uncertainty in is subdominant to the other uncertainties in the measurement; roughly, a 5% error in leads to a 10% error in in this method).
4 Expected Constraints on Dark Energy
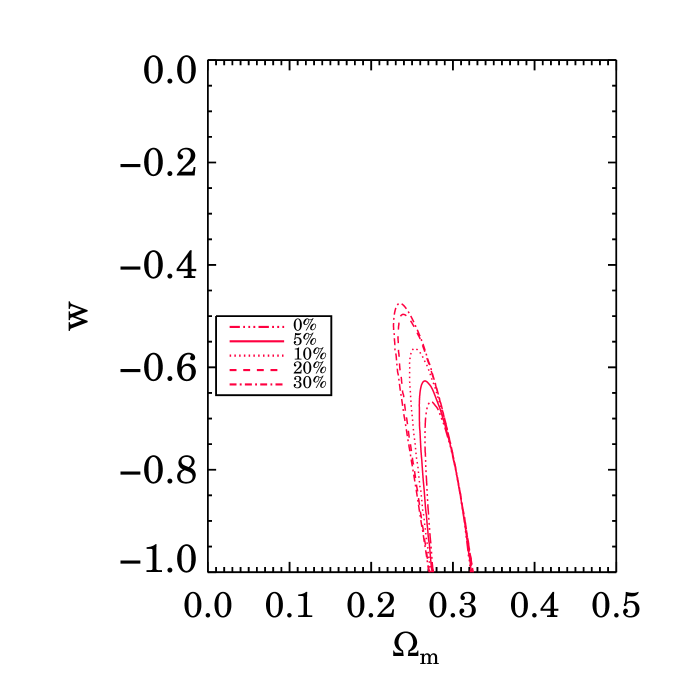
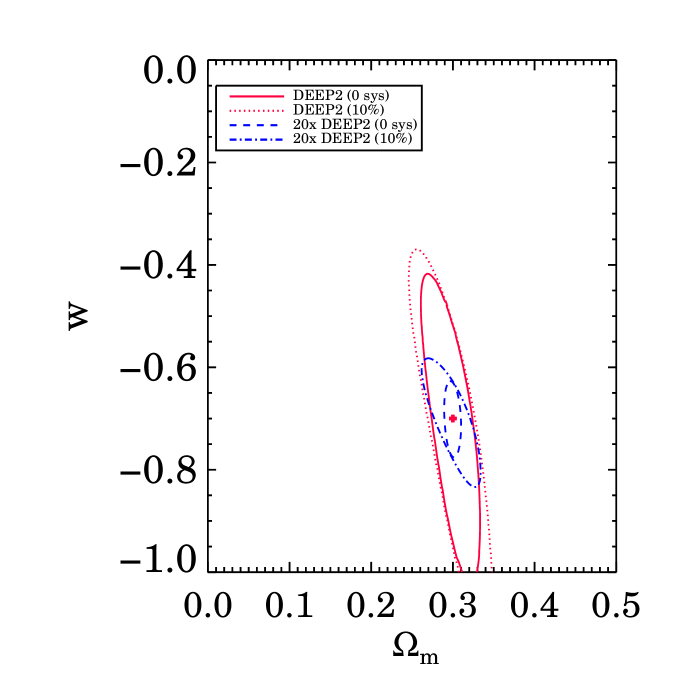
The constraints that will be possible by combining measurements of the cluster velocity function from DEEP2 and SDSS are shown in Figure 3. In this figure, we show the effect of various levels of systematic uncertainty on the strength of the test, based on the assumption that systematics are completely covariant amongst all redshift and velocity bins (i.e., the most pessimistic sort of systematic effect possible). As shown, if systematic errors can be controlled well (to the percent level), then DEEP2 can constrain to (). For a survey covering times the area of DEEP2, these constraints can be improved by a factor of if systematic effects can be controlled well enough that statistical errors dominate and appropriate prior constraints on are available. As shown in Figure 4, DEEP2 will not be sufficient to distinguish a cosmology with from a CDM model with high conficence, but the larger survey would easily distinguish the two. We have not projected constraints on models with varying here because the main subject of this paper, DEEP2, has no hope of constraining such models. In these figures, we have used the absolute abundance of groups at low redshift and high redshift as separate constraints. If we instead use the ratio of abundance at high to low , along with the absolute abundance at low redshift, to measure cosmological parameters we get constraints of very similar strength, but slightly different orientation in the plane. This ratio method can potentially reduce the impact of systematics if they are similar at low and high redshift.
5 Risks and Strengths
The principal risks for the cluster-abundance method relate to the improved theoretical understanding of galaxy formation in clusters that is required. As mentioned above, uncertainty in the velocity bias will be a dominant source of systematic error unless simulations can constrain its value well. Furthermore, uncertainty in the HOD may be a problem for a larger survey with smaller statistical errors. Fortunately, both of these issues are areas of active theoretical study and observational constraints on each are improving quickly, so it is reasonable to suppose that the situation will improve in the near future.
The most obvious strength of the method proposed here is that the necessary data are already in hand from the DEEP2 survey. An additional manifest strength is the existence of supplementary data that will allow cross-calibration of the DEEP2 data and other methods (e.g., by comparing velocity dispersions to X-ray temperatures and S-Z decrements). More generally, most algorithms for detecting groups and clusters in spectroscopic surveys make no assumptions about the properties of cluster galaxies. Redshift-space cluster searches thereby avoid a potential pitfall of some other optical cluster-finding methods (e.g., the Red-Sequence method [10]) that assume the properties of the cluster galaxy population will remain stable over many gigayears of cosmic time, to .
A final strength of this method is the fact that it comes as a free byproduct of any large future spectroscopic galaxy survey at , provided that the survey has sufficiently high sampling density ( 25–50% or better) and spectral resolution ( or higher), and that its targeting strategy is uniform with regard to galaxy type. For example, if the proposed KAOS spectrograph undertakes a survey intended to constrain cosmology with baryon oscillations in the matter power spectrum, it can simultaneously measure cluster abundance evolution if the survey is properly designed.
6 Future Needs
Apart from the theoretical advances discussed above, no further developments are needed to carry out the proposed test with DEEP2 data; the survey is already nearing completion, and large amounts of SDSS data are in hand. In order to expand this test to a larger survey, it would be necessary to design and build a new multi-object spectrograph to be placed on a new or existing 8-meter (or larger) telescope. Moderate-to-high spectral resolution () is required to resolve cluster velocity structure, and the ability to observe hundreds or thousands of galaxies simultaneously is also necessary for efficiency. Finally, a significant investment of telescope time would be required, with many hundreds of nights’ observation being necessary to complete such a survey.
7 Project Timeline
With data already in hand, initial constraints on are expected from DEEP2 within a year. Expanding this project to a significantly larger survey would require at least a decade of planning, instrument-building, analysis and observation, but could be combined with other projects.
References
- [1] Newman, J. A., Marinoni, C., Coil, A. L., Davis, M. 2002, PASP, 114, 29.
- [2] Marinoni, C., Davis, M., Newman, J. A., Coil, A. L. 2002, ApJ, 580, 122.
- [3] Gerke, B. F. et al. 2005, ApJ, 625, 6.
- [4] Colín, P., Klypin, A. A., Kravtsov, A. V., 2000, ApJ, 539, 561.
- [5] Diemand, J., Moore, B., Stadel, J. 2004, MNRAS, 352, 535.
- [6] Gao, L., De Lucia, G., White, S. D. M., Jenkins, A. 2004, MNRAS, 352, 1.
- [7] Seljak, U. et al., 2004, PRD, 043511.
- [8] Abazajian, K. et al., 2005, ApJ, 625, 613.
- [9] Yan, R., White, M. and Coil, A. C. 2003, ApJ, 607, 739.
- [10] Gladders, M. D., Yee, H. K. C., 2000, AJ, 120, 2148.