1-5
A Spitzer/IRAC Survey of the Orion Molecular Clouds
Abstract
We present initial results from a survey of the Orion A and B molecular clouds made with the InfraRed Array Camera (IRAC) onboard the Spitzer Space Telescope. This survey encompasses a total of 5.6 square degrees with the sensitivity to detect objects below the hydrogen burning limit at an age of 1 Myr. These observations cover a number of known star forming regions, from the massive star forming clusters in the Orion Nebula and NGC 2024, to small groups of low mass stars in the L1641. We combine the IRAC photometry with photometry from the 2MASS point source catalog and use the resulting seven band data to identify stars with infrared excesses due to dusty disks and envelopes. Using the presence of an infrared excess as an indicator of youth, we show the distribution of young stars and protostars in the two molecular clouds. We find that roughly half of the stars are found in dense clusters surrounding the two regions of recent massive star formation in the Orion clouds, NGC 2024 and the Orion Nebula.
keywords:
stars:formation, stars:pre-main sequence, stars:protoplanetary disks, ISM:clouds, ISM:dust, extinction, ISM:molecules, infrared:stars1 Introduction
The spatial distribution of young stars in a molecular cloud is an important constraint on the process of star formation, providing information on the environments in which stars and planets form and a fossil record of the distribution of star formation sites. Infrared observations can readily detect young stars still embedded in their natal gas and dust, and infrared surveys are an efficient means to perform a census of young stars in a giant molecular cloud. The first large scale survey of a giant molecular cloud with an infrared array was reported by [Lada et al. (1991)]. This survey showed the presence of three large clusters and one smaller group in the Orion B cloud. Lada et al. estimated that 58-82% of the stars were in clusters and groups, the major uncertainty being the number of field stars (foreground and background) contaminating the survey. A search for isolated young stars outside the clusters in the Orion B cloud was conducted by [Li et al. (1997)] using near-IR , and -band photometry. They found that only a small percentage of the sources showed infrared excesses in -band, suggesting that the stars outside the clusters were primarily contaminating field stars.
In contrast, the Orion A cloud contains not only the largest known young stellar clusters within 1 kpc of the Sun ([Hillenbrand & Hartmann (1998), Hillenbrand & Hartmann 1998]; [Porras et al. (2003), Porras et al. 2003]; [Lada & Lada (2003), Lada & Lada 2003]), but also a large number of small groups and a significant distributed population ([Chen, H. & Tokunaga, A. T. (1994), Chen & Tokunagua 1994]; [Strom et al. (1993), Strom, Strom & Merrill 1993]; [Allen (1996), Allen 1996]). [Carpenter (2000)] used the 2MASS 2nd incremental release to survey the populations in both the Orion A and B clouds. By mapping the surface density of sources and subtracting out the estimated density of contaminating field stars, Carpenter identified nine groups and clusters in the clouds, and found evidence for a significant distributed population in the Orion A cloud, but not in the Orion B cloud. These results suggest that most of the stars are found in the largest clusters of the Orion A and B clouds (the Orion Nebula Cluster and the NGC 2024 cluster, respectively).
With the goal of obtaining a census of embedded stars with disks and envelopes in the Orion molecular clouds, we have undertaken a large scale survey of the Orion A and B clouds with the Spitzer Space Telescope. We report here initial results of the survey taken with the IRAC instrument, showing the distribution of young stars. These observations detail the the relationship between the rich clusters, small groups and more isolated stars in these regions.
2 The Spitzer Orion Survey

The Orion A and B molecular clouds were surveyed with the InfraRed Array Camera (IRAC) and Multiband Imaging Photometry for Spitzer (MIPS) as part of a collaboration between the IRAC and MIPS instrument teams ([Fazio et al. (2004), Fazio et al. 2004]; [Rieke et al. 2004, Rieke et al. 2004]). These data provide photometry in six wavelength bands ranging from 3 to 70 m. In this article, we will report solely on large scale maps made with the IRAC instrument. The data were taken in high dynamic range mode, resulting in 0.6 and 12 second integration at each position. Four dithered integrations were obtained per position, giving a sensitivity of 17, 16, 14.5 and 13.5 mag. in the 3.6 m, 4.5 m, 5.8 m and 8.0 m bands, respectively. A total of 5.6 sq. degrees were covered in three fields: two fields covering the Orion B cloud and one field coverage the Orion A cloud. The data were mosaicked together and a custom source finder was used to identify sources. Aperture photometry was performed on the identified sources using a radius aperture and a sky annulus spanning to .
3 The Identification of Young Stellar Objects
Young stars with dusty disks and infalling envelopes can be identified by the thermal emission from the dust heated by the star. In the mid-infrared, the thermal emission can be detected as an excess over the expected photospheric emission, and we refer to stars exhibiting such an excess as infrared excess sources. We expect that more than 50% of all young ( Myr) stars exhibit infrared excesses ([Haisch et al. (2001), Haisch, Lada & Lada 2001]). Using both theoretical models ([Allen et al. (2004), Allen et al. 2004]; [Whitney et al. (2003), Whitney et al. 2003]) and IRAC photometry of well studied young stars and protostars in the Taurus dark clouds ([Hartmann et al. (2005), Hartmann et al. 2005]), we have defined the IRAC colors of young stars with disks and envelopes. However, identification of young stars using solely the IRAC data is limited by the lower sensitivity of the 5.8 and 8.0 m IRAC data to stellar photospheres. For this reason, we have merged the IRAC data with the 2MASS point source catalog, and we use the vs. and vs. color-color diagrams to identify infrared excesses for young stars which are not detected in the longer wavelength IRAC bands (Fig 1).
The selection of sources with infrared excesses eliminates contamination by normal field stars, but it does not eliminate contamination due the presence of other dusty objects in the sky. Using an IRAC survey toward a field in the constellation Bootes, [Stern et al. 2005] found that AGN previously identified through optical spectroscopy have colors similar to those of young stars with infrared excesses. However, the AGN are typically fainter than the young stars in the IRAC bands. To reduce the contamination by AGN, we required that the infrared excess sources be brighter than 14 mag. in the IRAC 3.6 m band. After applying this criteria, we estimate that only 42 out of the 2168 infrared excess sources in our surveyed fields are misidentified AGNs.
4 The Distribution of Sources in Orion
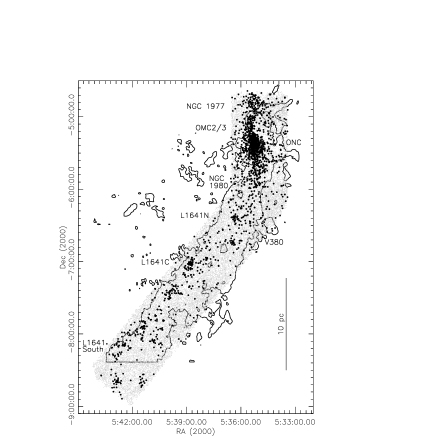
In Fig. 2 we show the distribution of all infrared excess sources identified in the combined IRAC and 2MASS point source catalog. The fields are overlaid on the velocity integrated 13CO emission contours from the Bell Labs survey. Two large, centrally condensed clusters are apparent, one coincident with the NGC 2024 region in the Orion B cloud and the other with the Orion Nebula in the Orion A cloud. These are the two massive star forming regions in these clouds, and they are easily distinguished in the figure by the density of infrared excess sources in these regions.
The Orion Nebula Cluster in Fig. 2. is part of an extended complex of star formation extending from NGC 1977 in the north, through the Orion Molecular Cloud (OMC) 2 and 3 regions, through M42 and M43 (the Orion Nebula Cluster or ONC), and finally to NGC 1980 in the south. At this point the density of stars decreases as we transition into the L1641 dark cloud. In L1641, we find the known stellar groups L1641 North, V380, L1641 Center and L1641 South and an extended component which fills in much of the space between the groups. The stars are concentrated toward the northern edge of the cloud where the 13CO emission is strongest.
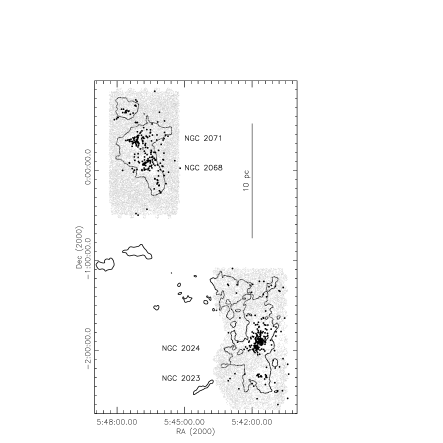
The two fields surveyed in the Orion B cloud show strikingly different distributions of stars. In the southern field containing NGC 2024 and NGC 2023, the stars are concentrated in a single dense cluster in NGC 2024, with a small group of stars associated with NGC 2023 and a small number of isolated stars. In the northern field containing NGC 2068 and NGC 2071, we find that the two clusters are part of a more extended distribution of stars spanning from NGC 2071 through NGC 2068 and to the chain of protostars found in the LBS 23 core - which includes HH24 and McNeil’s nebula. In addition, a small group is seen in the northernmost part of the Orion B cloud, this group is outside the region surveyed by Lada et al. 1992.

5 Clustered vs. Distributed Star Formation
The different spatial distributions of young stars observed in the clouds is apparent in histograms of the local surface density of infrared excess sources. We calculate the local surface density for each infrared excess source by finding the distance to the 4th nearest infrared excess source, , and then equating the local surface density to . Fig 4 shows the distributions of nearest neighbour densities for the two maps in the Orion B cloud and for two sub-regions of the Orion A cloud map. In NGC 2068/2071 and L1641, of the stars are in regions with stellar densities stars pc-2, while in NGC 2023/2024 and the Orion Nebula Cluster (ONC), more than of the stars have local densities stars pc-2. In the ONC, this fraction is probably much larger since the data is incomplete in the center of the Orion Nebula where the stellar densities are the highest. NGC 2068/2071 shows a strong peak between 10 and 100 stars pc-2, suggesting a more uniform distribution of stars compared with the other regions. Interestingly, the regions showing dense, centrally condensed clusters are the two regions of the embedded molecular cloud population closest to the older Orion 1C association (see article by Bally et al. in this volume), suggesting that the rate and/or density of star formation may be enhanced by the impact of OB stars on the molecular clouds.
One of the goals of this survey is to determine the relative importance of clustered and isolated star formation in the Orion molecular clouds; however, distinguishing the clustered and distributed stars can be problematic. Only in the NGC 2023/2024 cloud are the clustered and distributed populations distinct, while in the other regions the clusters and groups appear to be density peaks in more extended populations. As a first step, we calculate the number of stars in the two large, dense clusters in the Orion and NGC 2024 regions relative to that in the remaining, lower density regions. We note that in the Orion B cloud, there are roughly the same number of infrared excess sources in the predominately clustered population of the NGC 2023/2024 sub-cloud as in the lower stellar density, more distributed population in the NGC 2068/2071 sub-cloud (239 vs. 229, respectively). In the Orion A cloud, we find 607 infrared excess sources in L1641, while north of , we find 1093 sources, 487 of which appear to be part of the ONC, and the remaining 606 stars are associated with OMC2/3, NGC 1977, NGC 1980, and a more distributed component seen around the cluster. We estimate that we may be missing as many as 700 stars in the inner center of the Orion Nebula ([Muench et al. (1998), Muench et al. 1998]). In total, we estimate that there may be as many as 1200 stars with infrared excesses in the ONC compared with 1213 in the regions surrounding the ONC and in L1641. These preliminary results suggest that roughly half of the stars are in the two dense, rich, centrally concentrated clusters, while the other half are found in lower density environments.
Acknowledgements.
This work is based in part on observations made with the Spitzer Space Telescope, which is operated by the Jet Propulsion Laboratory, California Institute of Technology, under NASA contract 1407. Support for this work was provided by NASA through contract 1256790 issued by JPL/Caltech.References
- [Allen (1996)] Allen, L. E 1996, Ph.D. Thesis, University of Massachussettss
- [Allen et al. (2004)] Allen, L. E. et al. 2004, ApJS 154, 363.
- [Bally et al. (1987)] Bally, J, Stark, A. A., Wilson, R. W., Langer, W. D. 1987, ApJ 312, 45.
- [Carpenter (2000)] Carpenter, J. M. 2000, AJ 120, 3129.
- [Chen, H. & Tokunaga, A. T. (1994)] Chen, H. & Tokunaga, A. T. 1994, ApJS 90, 149.
- [Fazio et al. (2004)] Fazio, G. G. et al. 2004, ApJS, 154, 10.
- [Haisch et al. (2001)] Haisch, K. E., Jr., Lada, E. A., Lada, C. J. 2001, ApJ 553, L153.
- [Hartmann et al. (2005)] Hartmann, L., Megeath, S. T., Allen, L., Luhman, K., Cavlet, N., D’Alessio, P, Franco-Hernandez, R., Fazio, G. 2005, ApJ, in press.
- [Hillenbrand & Hartmann (1998)] Hillenbrand, L. A. & Hartmann, L. W. 1998, ApJ 492, 540.
- [Lada et al. (1991)] Lada, E. A., DePoy, D. L., Evans, N. J. II. & Gately, I. 1991, ApJ 371, 171.
- [Lada & Lada (2003)] Lada, C. J. & Lada, E. A. 2003, ARA&A 41, 57.
- [Li et al. (1997)] Li, W., Evans, N. J. II & Lada, E. A. 1997 ApJ 488, 277.
- [Miesch & Bally (1994)] Miesch, M. S., Bally, J. 1994, ApJ 429, 645.
- [Muench et al. (1998)] Muench, A. A., Lada, E. A., Lada, C. J., Alves, J. 2002, ApJ 573, 366.
- [Porras et al. (2003)] Porras, A., Christopher, M., Allen, L., DiFrancesco, J., Megeath, S. T., Myers, P. C. 2003, AJ 126, 1916.
- [Rieke et al. 2004] Rieke, G. H. et al. 2004, ApJS 154, 25.
- [Stern et al. 2005] Stern, D. et al. 2005, submitted to ApJL
- [Strom et al. (1993)] Strom, K. M., Strom, S. E. & Merrill, K. M. 1993, ApJ 412, 233.
- [Whitney et al. (2003)] Whitney, B. A., Wood, K., Bjorkman, J. E. & Cohen, M. 2003, ApJ 598, 1079.