Identification of the Red Supergiant Progenitor of Supernova 2005cs: Do the Progenitors of Type II-P Supernovae Have Low Mass?
Abstract
The stars that end their lives as supernovae (SNe) have been directly observed in only a handful of cases, due mainly to the extreme difficulty in identifying them in images obtained prior to the SN explosions. Here we report the identification of the progenitor for the recent Type II-plateau (core-collapse) SN 2005cs in pre-explosion archival images of the Whirlpool Galaxy (M51) obtained with the Hubble Space Telescope (HST) Advanced Camera for Surveys (ACS). From high-quality ground-based images of the SN from the Canada-France-Hawaii Telescope, we precisely determine the position of the SN and are able to isolate the SN progenitor to within in the HST ACS optical images. We further pinpoint the SN location to within from HST ACS ultraviolet images of the SN, confirming our progenitor identification. From photometry of the SN progenitor obtained with the pre-SN ACS images, and also limits to its brightness in pre-SN HST NICMOS images, we infer that the progenitor is a red supergiant star of spectral type K0–M3, with initial mass 7–9 . We also discuss the implications of the SN 2005cs progenitor identification and its mass estimate. There is an emerging trend that the most common Type II-plateau SNe originate from low-mass supergiants (8–15 ).
1 Introduction
Direct identification of the progenitors of supernovae (SNe) provides vital information on their explosion mechanisms, a key issue in SN studies. The white dwarfs thought to give rise to thermonuclear Type Ia SNe have such exceedingly low luminosities that they cannot at present be detected in external galaxies. Core-collapse SNe (of Type II, Type Ib, and Ic), on the other hand, arise from far more luminous, massive stars. Unfortunately, even these progenitors are so faint that their detection (ground-based or space-based) is confined to nearby galaxies (distances 10 Mpc), in which SN discoveries are relatively rare.
Until now, out of more than 3,200 SNe discovered since 1885, only 5 genuine SNe have had their progenitors identified: SN 1987A (a peculiar, subluminous SN II) in the Large Magellanic Cloud (e.g., Gilmozzi et al. 1987; Sonneborn et al. 1987), SN 1993J (an unusual SN IIb) in NGC 3031 (M81; Aldering et al. 1994; Van Dyk et al. 2002), SN 1999ev (Type II) in NGC 4274 (Maund & Smartt 2005), SN 2003gd (Type II) in NGC 628 (M74; Van Dyk et al. 2003a; Smartt et al. 2004), and SN 2004et (Type II) in NGC 6946 (Li et al. 2005a, 2005b). In addition, identifications of precursors that give rise to the super-outbursts of luminous blue variable stars in other galaxies, occasionally misclassified as SNe, have been made for several other objects (Zwicky 1964; Ryder et al. 1993; Van Dyk et al. 1999b; Van Dyk et al. 2000).
Nature provided us with a rare opportunity to increase the sample of directly identified SN progenitors with the discovery of SN 2005cs in the Whirlpool Galaxy (hereafter, M51). The supernova was discovered by Kloehr (2005) at about magnitude 14 on 2005 June 28.9 (UT times are used throughout this paper), and confirmed in images obtained with the 0.76-m Katzman Automatic Imaging Telescope (KAIT; Li et al. 2000; Filippenko et al. 2001) at Lick Observatory on 2005 June 30.25 (Li 2005). An optical spectrum taken with the F. L. Whipple Observatory 1.5-m Tillinghast telescope on 2005 June 30.23 showed SN 2005cs to be a young SN II (Modjaz et al. 2005), with P-Cygni-like line profiles of the hydrogen Balmer series and helium superimposed on a blue continuum.
Just five months before the discovery of SN 2005cs, M51 was fortuitously observed by the Hubble Heritage team (GO/DD program 10452; PI: S. Beckwith) with the Wide Field Channel (WFC) of the Advanced Camera for Surveys (ACS) on-board the Hubble Space Telescope (HST). A large four-color (F435W, F555W, F658N, and F814W) mosaic image of the nearly face-on spiral galaxy NGC 5194 (M51a, the SN 2005cs host) and its interacting companion, NGC 5195 (M51b), was obtained in six ACS pointings (with four dithered exposures at each pointing), and the resulting color composite image was released to the community on 2005 April 25 to celebrate the fifteenth anniversary of the successful operation of HST (Mutchler et al. 2005). These high-resolution ( pixel-1) images are also the deepest ever obtained of M51, reaching limiting magnitudes of 27.3, 26.5, and 25.8 in the combined F435W (), F555W (), and F814W () images, respectively. M51 had also been observed in several bands with the Wide Field and Planetary Camera 2 (WPFC2), but not to this depth or, generally, at such high spatial resolution.
M51 was also observed by the Near Infrared Camera and Multi-Object Spectrometer (NICMOS) on-board HST in GTO program 7237 (PI: N. Scoville) in Cycle 7; the SN site was imaged in five bands (F110W, F160W, F187N, F190N, and F222M) on 1998 June 28. Together, the ACS and NICMOS data therefore provide images of unprecedented quantity and quality for possibly identifying and studying the progenitor star of SN 2005cs.
In § 2 we report on our direct identification of the progenitor of SN 2005cs, and in § 3 we describe the progenitor’s nature inferred from analysis of these pre-SN HST data. Further discussion is in § 4, and we summarize our conclusions in § 5. We note that M51 was also host to SN 1945A (in NGC 5195; Type I) and SN 1994I (in NGC 5194; Type Ic).
2 Identification of the Progenitor
In Table 1 we list the HST ACS/WFC and NICMOS data that we analyzed here. Many additional pre-SN observations of M51 exist, obtained with other instruments on-board HST, including WFPC2 images of SN 1994I. However, the ACS data provide the deepest and the highest-resolution optical images currently available of the galaxy prior to the SN, supplemented by the deep NICMOS data in the near-infrared.
2.1 Registration of the Ground-based Observations
To initially locate the SN 2005cs progenitor in these images, we utilized the KAIT SN confirmation observations. We identified six to eight stars in common between the ACS/WFC and KAIT images and measured their pixel coordinates. Using the task IRAF111IRAF (Image Reduction and Analysis Facility) is distributed by the National Optical Astronomy Observatories, which are operated by the Association of Universities for Research in Astronomy, Inc., under cooperative agreement with the National Science Foundation. /GEOMAP, we performed a geometrical transformation between the two sets of coordinates and were able to match them to ACS pixels root-mean-square (rms ). [This rather large uncertainty arises from the relatively poor spatial resolution in the KAIT images ( pixel-1) and the mediocre seeing under which the images were obtained (25 FWHM).] To within this positional uncertainty, we were able to identify a single object at the SN site in the F814W image. However, this object is not detected in the images in any of the other ACS passbands (Li et al. 2005c).
To better isolate the putative progenitor star, we obtained higher-resolution ( pixel-1) SN images with the 3.6-m Canada-France-Hawaii Telescope (CFHT, + MegaCam) on 2005 July 2.28, under good seeing conditions ( FWHM). We obtained 310 s and 290 s exposures in the Sloan band. (Only the images from one chip containing the SN site, out of a total of 36 chips, were analyzed.) As a result, we are able to detect many more faint objects in the CFHT images than in the KAIT images. We identified 20–30 stars (or compact star clusters) around the SN position that are present in both the CFHT and ACS images. The CFHT images were geometrically transformed to the ACS images using IRAF/GEOMAP, with uncertainties of –0.8 ACS pixel, and the SN location transformed onto the ACS images is consistent in all five CFHT exposures (to within this uncertainty). Increasing the number of stars included in the transformation does not appreciably reduce the uncertainty, indicating that we have approached the limit of the transformation accuracy. An independent astrometric tie conducted using 90 stars or compact clusters in both sets of images, fit to a third-order polynomial function with full cross-terms for the transformation, resulted in a consistent localization with a similar precision.
The final error-weighted mean pixel location for all measurements from the CFHT images of the SN is and in the ACS mosaic image “h_m51_i_s05_drz_sciḟits” (Table 1), which corresponds to , from the ACS image world coordinate system (WCS). Direct inspection of the F814W image confirmed our initial identification of the candidate progenitor: only one object is within the 0.8 ACS pixel uncertainty, at position , (Li et al. 2005d), and we consider this object most likely to be the progenitor star. The difference between the transformed and measured position for this star is ACS pixel () and ACS pixel (), both of which are within 1 of the positional uncertainties.
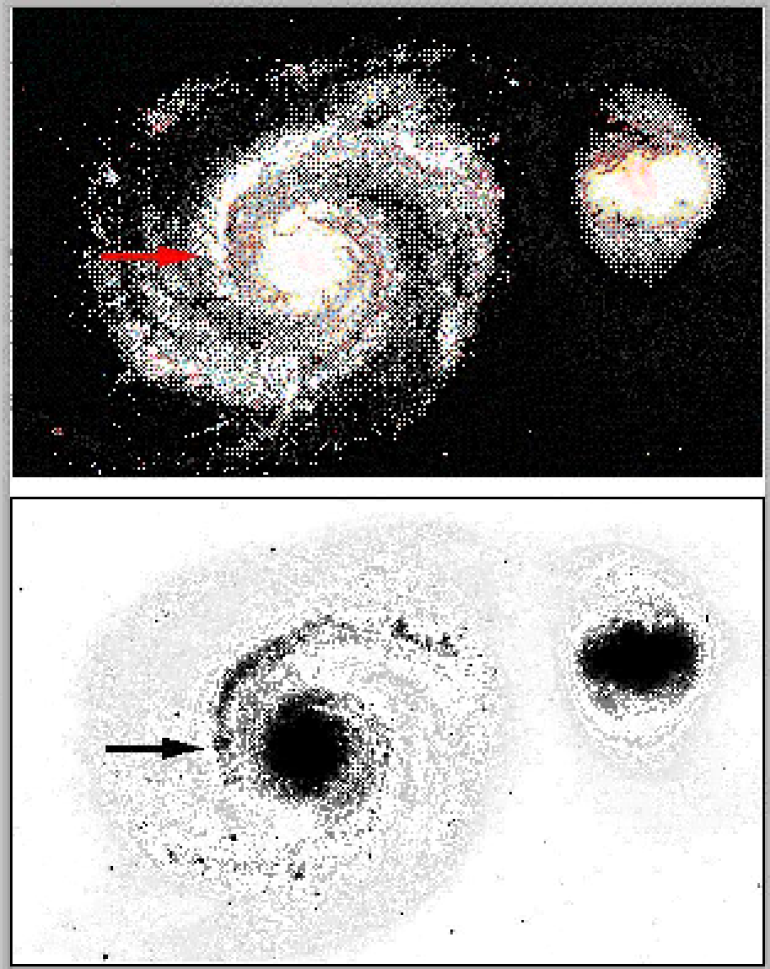
A comparison between the ACS/WFC color composite mosaic image and the combined CFHT image is shown in Figure 1.
2.2 Registration of the HST/ACS SN Observations
Subsequent images of M51 showing SN 2005cs were obtained with HST/ACS on 2005 July 11, and with NICMOS on 2005 July 13, as part of program GO-10182 (PI: A. V. Filippenko). The details of the observations are listed in Table 2. The ACS images were observed with the High Resolution Channel (HRC) of ACS. The HRC provides a finer spatial resolution ( pixel-1) than the WFC ( pixel-1), but with a smaller field-of-view, (compared to for WFC).
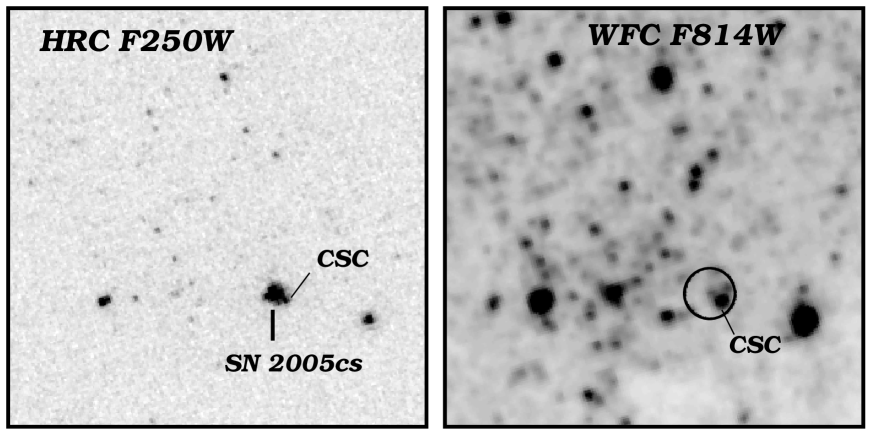
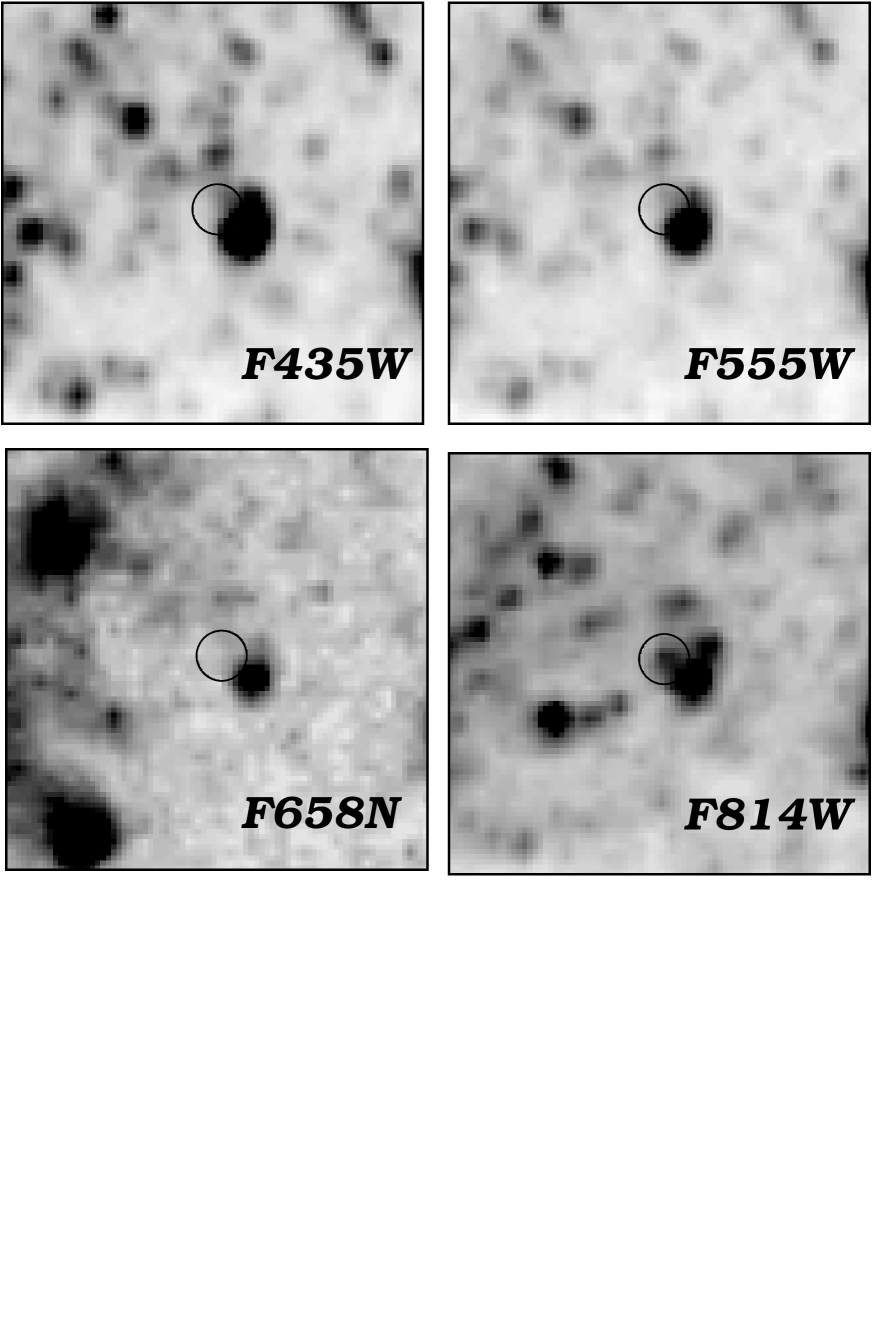
Using six point sources within 10 of the SN site, we performed a geometrical transformation between the F250W ACS/HRC SN image and the ACS/WFC F814W pre-SN image. The transformation has an overall error of 0.1 ACS pixel (). When the SN position measured from the ACS/HRC image is transformed to the ACS/WFC image, it is coincident with our progenitor candidate, with a difference of ACS pixel () and ACS pixel (). In Figure 2 we show a comparison between the ACS/HRC F250W image and the ACS/WFC F814W image after image registration, while in Figure 3 we show the SN site in all the four ACS/WFC passbands. We now conclude to a high degree of certainty that we have identified in the F814W image the progenitor of SN 2005cs.
2.3 Registration of the HST/NICMOS Observations
To determine whether the progenitor star is also seen in the pre-SN HST/NICMOS observations, we attempted to match geometrically the NICMOS images showing SN 2005cs to the pre-SN NICMOS images. Out of the five NICMOS passbands in which M51 was imaged, we consider only the F110W () and F160W () exposures to be deep enough to be useful for our purpose.
We first identified five bright sources in common between the new and the pre-SN NICMOS images. We performed a first-order geometrical transformation between the images which achieved an rms accuracy of 0.08 NICMOS pixel (). After the images were registered in common, we identified an additional 8–10 fainter objects in both sets of images. A broader geometrical transformation then resulted in a registration with rms accuracy 0.15 NICMOS pixel (). This larger uncertainty in the transformation for the larger number of fiducials is due mainly to the measurement uncertainty in the centroids for stars in the undersampled and relatively shallow NICMOS images.
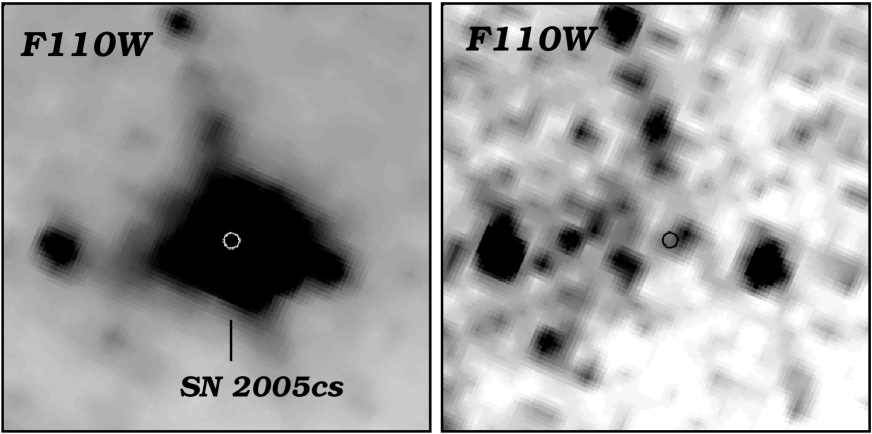
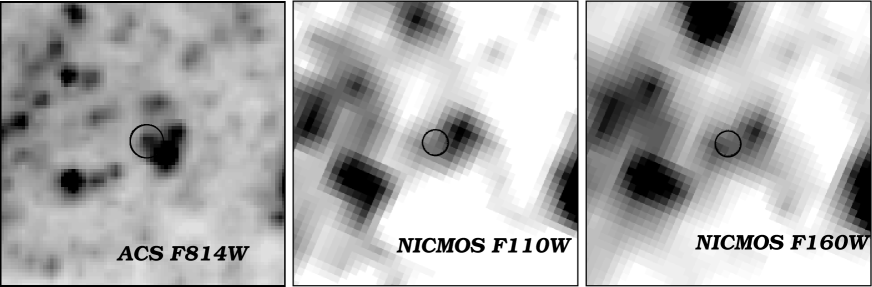
In Figure 4 we show a comparison of the registered NICMOS F110W images before and after SN 2005cs. The position of SN 2005cs is marked as a white circle in the left panel. The right panel shows the pre-SN NICMOS F110W image, with the position of SN 2005cs marked with a radius circle, which represents the 3 uncertainty in the image registration. We show a 22 close-up of the SN 2005cs progenitor environment on the pre-SN NICMOS images in Figure 5. For comparison, the ACS F814W image is shown in the left panel, with the progenitor of SN 2005cs marked with an illustrative circle. The pre-SN NICMOS F110W and F160W images are shown in the middle and right panels, with a radius circle that represents the 3 uncertainty in the image registration. Just outside the 3 error circle is a relatively bright source in the NICMOS images, which we tentatively identify as the counterpart of the star immediately to the northwest of the SN progenitor seen in the F814W image. Note that the bright object immediately to the southwest of the progenitor seen in the F814W image, which we suggest is a blue compact cluster, has only a faint or undetected counterpart in the near-infrared bands.
We marginally detect a source near the SN progenitor position in the F110W image and, somewhat more suggestively, in the F160W image. However, this source seems to be offset slightly from the exact progenitor position, suggesting it may be a different, very red star. However, the NICMOS source is within 2–3 of the progenitor position, and it is possible this source is the same as the star detected in the ACS F814W image. To be conservative, we consider the brightness of this source in the NICMOS images to be an upper limit to the flux of the SN progenitor.
3 Photometry of the Progenitor
We have almost certainly identified the progenitor for SN 2005cs in deep pre-SN HST images (see §4). We attempt now to measure the brightnesses of this star in the various bands. From Figure 3 it is apparent that SN 2005cs occurred in a crowded field; in particular, the bright, blue object (likely a compact star cluster) immediately to the southwest of the fainter star will complicate these measurements in the ACS bands.
3.1 ACS photometry
We perform photometry on the ACS images following the prescription outlined by Sirianni et al. (2005). Using the IRAF/DAOPHOT package (Stetson 1987), we combined the four individually “drizzled” images produced by the HST ACS calibration pipeline in each of the four observed passbands. We have confirmed that the photometric scale is consistent between our combined images and the mosaic image produced by the Hubble Heritage team.
For the combined F814W and F555W images, we manually selected 377 and 384 (respectively) bright, isolated stars to construct a spatially varying model point-spread function (PSF) across the field. Since photometric accuracy for the progenitor would be improved if we could cleanly remove the contribution of the neighboring bright compact cluster, we carefully examined the characteristics of the cluster (i.e., its light profile) and identified about 20–30 similar objects in each image. Using our model stellar PSF, we first removed all the stars in the neighborhood of our selected clusters. Then, we constructed a spatially constant model cluster “point”-spread function (there are not enough clusters to produce a spatially varying model), which was then fit to the bright contaminating cluster. Inspection of images in which the cluster was subtracted revealed that the model fit did a good job in removing its contribution in the F814W image, but some small subtraction residuals remained in the F555W band.
Nonetheless, with the effect of the cluster minimized as much as possible, we determined the brightness of objects in the SN environment (within a radius of ) using a -radius aperture PSF (to maximize the signal-to-noise ratio) fit in an iterative process, in which the brightest 2–3 stars were measured first and subtracted away, then the next brightest stars, and so on. By performing the photometry iteratively, we avoided potential errors which could result from fitting all the bright and faint stars simultaneously. The progenitor’s brightness was measured in the F814W image when all other sources had been cleanly removed.
For the F555W image, since the progenitor is not detected, we derived an upper limit to its brightness. We subtracted stars of various magnitudes near the location of the progenitor (determined from the F814W image) and visually inspected the subtracted images. While this process involves some subjectivity and thus may have large uncertainties, we nevertheless find that when stars brighter than 25.8 mag are subtracted from the F555W image, an apparent residual is left in the subtracted images. We consider this magnitude (25.8) the detection limit in the SN environment. This limit is brighter than the global limiting magnitude, mag (Mutchler et al. 2005), due to the presence of the neighboring cluster and its imperfect subtraction.
We determined photometric corrections from the PSF fitting radius to a standard -radius aperture, using several isolated, bright stars. These are mag in F814W and mag in F555W. We then employed the tabulated correction to infinite aperture of mag for the F555W image (Sirianni et al. 2005). Correcting the F814W photometry to infinite aperture was more involved: because both the PSF and aperture correction at F814W depends on a star’s color, we first estimated an effective wavelength 8200 Å for the peak of the star’s spectral energy distribution, based on the spectral type suggested by the limit on the F555WF814W color for the progenitor. Following Sirianni et al. (2005), we derived a value for the correction, based on this wavelength; however, it is quite similar to the tabulated synthetic correction in Sirianni et al. (2005) of mag, which we adopt for all the stars in the region. Because of the fortuitous location of the SN pixel position near a readout amplifier for the chip, the ACS charge transfer efficiency correction is negligible for that position.
We then corrected the photometry for interstellar extinction. The Galactic reddening along the line of sight to M51 is only = 0.035 mag (Schlegel et al. 1998); however, the presence of Na I D line absorption in the SN spectrum at the redshift of M51 suggests some additional host-galaxy extinction toward the SN (Modjaz 2005). We therefore adopted a total reddening = 0.100.05 mag (Richmond 2005) toward the SN progenitor. For the other stars in the SN environment, we lack constraints on the host extinction and corrected only for the Galactic component. Finally, we transformed the F814W and F555W magnitudes to Johnson-Cousins and (Sirianni et al. 2005) and obtained , mag for the progenitor. Adopting a distance modulus mag (Richmond et al. 1996), the progenitor has mag and mag, consistent with a red supergiant of spectral type K0 or later.
Since the F435W and F658N images are not of sufficiently high signal-to-noise ratio to derive meaningful limits on the progenitor brightness (the progenitor is not detected in either image) and enhance our knowledge of the progenitor beyond what we have now learned from the F555W and F814W images, we do not consider them further.
3.2 NICMOS Photometry
We performed photometry on the subsampled drizzled NICMOS F110W and F160W pre-SN images, with resolution pixel-1. The photometric zero points appropriate for Cycle 7, when these NICMOS observations were obtained, were adopted. Since the SN progenitor is, at best, marginally detected, and it occurred in a crowded region, we employed a procedure for the photometry similar to that described above, in §3.1, for the ACS F555W image: stars were subtracted iteratively in order of decreasing brightness near the SN location, using the appropriate TinyTim model PSFs (Krist & Hook 2003) for the NICMOS filters, until the visually most satisfactory subtracted image was achieved. As a result, we derived = 22.50.5 and = 21.50.5 mag for the marginally detected emission close to the SN site, and adopted these magnitudes for the limiting brightness of the progenitor in each band.
4 Discussion
4.1 Is SN 2005cs of Type II-Plateau?
Type II SNe can be further divided into several subclasses; see the review of SN types in Filippenko (1997) for more details and references. The two classical subtypes are the Type II-plateau (SNe II-P), with a pronounced plateau phase seen in their optical light curves, and the Type II-linear (SNe II-L), with a linear decline after their maximum brightness. Additional subtypes include the Type II-narrow (SNe IIn), with narrow emission lines in their spectra (often, but not always, superimposed on a broader emission component), and the SN 1987A-like (peculiar, subluminous, with a unique photometric behavior). Moreover, the Type IIb SNe, such as SN 1993J in M81 (Filippenko et al. 1993; Nomoto et al. 1993), manifest themselves as SNe II at early times, but then experience a metamorphosis into a Type Ib SN at late times. To some extent the shapes of the optical light curves correlate with the spectral subtype for SNe II.
We have been able to follow SN 2005cs in with KAIT roughly every other night since its discovery, sampling the light curves for 20 d since explosion, so we should already be getting an indication of the SN subtype. Unfortunately, the absolute calibration for SN 2005cs has not yet been established, but in Figure 5 we show its light curves relative to the recent prototypical SNe II-P 1999em (Leonard et al. 2002b; Hamuy et al. 2001) and 2004et (Li et al. 2005a). The SN 2005cs light curves were obtained by performing differential aperture photometry between the SN and two or more bright stars in the field. In the figure we show the curves adjusted in magnitude to match the light curves for SN 1999em and SN 2004et; the number of days since explosion has not been adjusted. The final photometry for SN 2005cs will be published in a forthcoming paper, when proper absolute calibration for the field has been obtained, along with analysis of available optical spectra.
Even from these relative light curves, it can be clearly seen that SN 2005cs is currently undergoing a plateau phase, especially in the , , and bands. SN 2005cs also follows very similar photometric evolution to that of SN 1999em and SN 2004et in these three bands, but seems to be evolving somewhat faster in the and bands. At the distance of M51, SN 2005cs had a peak -band magnitude on the plateau of only , so it is rather subluminous. SN 2005cs also had a relatively small early expansion velocity, 7500 km s-1, derived from the absorption minimum of H (Modjaz et al. 2005). We believe there should be little doubt that SN 2005cs is a SN II-P, albeit possibly somewhat unusual and subluminous, relative to the prototypes.
4.2 An X-ray Flash from SN 2005cs?
An X-ray flash was detected in a 2136 s Swift/XRT observation of M51 on 2005 July 6.231, 8 days after the discovery of SN 2005cs (Immler et al. 2005). This generated interest as to whether or not the flash was related to SN 2005cs. The X-ray flash is a 6 detection, and is located about 10 from the SN 2005cs position. No X-ray source was detected 96 minutes later in a 2031 s exposure, as well as in all other Swift/XRT observations of M51 on June 30, July 3, 5, 6 and 7. Given the timing of the X-ray flash (8 days after the SN explosion), and the relative offset of the detection from the SN position, speculation emerged that the new source was unrelated to SN 2005cs. However, since the XRT PSF has a half-power diameter of 18 at 1.5 keV, based on position alone the possibility that the emission is from SN 2005cs cannot be excluded.
From the photometry obtained with the Palomar Observatory robotic 60-in telescope, Gal-Yam (2005) reports that no photometric anomaly was detected for SN 2005cs around the time of the detection of the X-ray flash in M51, and yet no additional variable sources were detected within 20 of SN 2005cs. We obtained with KAIT a sequence of images for SN 2005cs, starting on July 6.246, just 20 minutes after the Swift/XRT detection of the X-ray flash. The photometry from and timing of these images are indicated with an arrow in Figure 5. Our data are consistent with what Gal-Yam (2005) found: the SN evolved photometrically as expected, following the trend before and after the X-ray flash detection, particularly in .
We further compare the ACS/HRC images of the SN 2005cs field in the UV bands taken on July 11.501, 5.27 days after the X-ray flash detection, to the pre-SN ACS/WFC F435W () images. We do not detect any apparent new sources within 10 of SN 2005cs, to limiting magnitudes 22.5.
Thus, either the X-ray flash was unrelated to SN 2005cs, or it did not produce any detectable anomalous behavior at optical wavelengths shortly thereafter. The nature of the X-ray flash remains a mystery.
4.3 The Spectral Type and Mass of the Progenitor
We can further constrain the spectral type of the progenitor of SN II-P 2005cs, a red supergiant, from the HST photometry. In Figure 6 we show the star’s implied spectral energy distribution (SED); obviously, the star was detected only in , so we can place only upper limits on its brightness in this diagram. The brightness and the upper limits have been corrected for reddening. Also shown for comparison are SEDs of some late-type supergiants (Drilling & Landolt 2003; Tokunaga 2003), reddened by the assumed to the SN and all normalized to the progenitor’s magnitude. We see that the upper limit constrains the spectral type to later than about K0, while the upper limits constrain it to earlier than M5.
We can further venture to estimate the initial mass of this star by comparing its intrinsic brightness and color limit to theoretical massive stellar evolutionary tracks. Lejeune & Schaerer (2001) have generated tracks for a range of zero-age main sequence (ZAMS) masses for several different metallicities and assuming enhanced mass loss for the most massive stars. From metallicity measurements in M51 (Zaritsky et al. 1990), we estimate that at the SN 2005cs site, [O/H] = 9.06 0.04 dex. This is 0.26 dex higher than the solar abundance (Grevesse & Sauval 1998), implying that the metallicity in the SN environment could be somewhat higher than solar. We therefore consider the tracks from Lejeune & Schaerer for both (i.e., solar) and (the next higher metallicity).
In Figure 7 we show the intrinsic color-magnitude diagram for the SN environment (the progenitor and other stars within a radius of the SN) and overlay the tracks for the two possible metallicities for a variety of stellar masses. The total photometric uncertainties shown are the measurement uncertainties and the uncertainty in the distance modulus added in quadrature. It is also clear from the diagram that the SN environment is abundant in red supergiants with masses of 7–15 , although from the astrometric arguments above, we have eliminated these stars as potential candidates for the progenitor.
The location in the diagram of the progenitor itself suggests that it had –9 . This estimated mass is right at the theoretical lower limit for core collapse in massive stars (Woosley & Weaver 1986). Furthermore, we consider it highly unlikely that we have not correctly identified the SN progenitor, if it is indeed a core-collapse SN. The low reddening to the SN and the limiting magnitude in the F814W image, mag, imply that any star which has escaped detection, yet somehow remains a possible progenitor candidate, has a ZAMS mass () formally below the core-collapse limit.
4.4 Implications from the SN 2005cs Progenitor
We consider our identification of the progenitor of SN 2005cs quite secure and the estimates for its inferred spectral type and ZAMS mass compelling. SN 2005cs is only the third SN II-P to have its progenitor directly identified on pre-SN images. The other two are SN 2003gd (Van Dyk et al. 2003; Smartt et al. 2004; Hendry et al. 2005), which also had a progenitor with initial mass (7–9 ) very near the theoretical limit for core collapse, and SN 2004et, with an initial mass in the range 13–20 (Li et al. 2005a). The former was a subluminous SN, also with a red supergiant progenitor, and the latter may have been unusual, with apparently a yellow supergiant progenitor.
Upper limits on the initial masses of other, well-studied SNe II-P based on pre-SN images have also been established: for SN 1999em (Smartt et al. 2002), for SN 1999gi (Leonard et al. 2002a), for SN 2001du (Van Dyk et al. 2003b; Smartt et al. 2003), and for SN 1999br (Maund & Smartt 2005). From these detections and upper limits, a trend is emerging for SNe II-P, the most common core-collapse SNe, that the majority (if not all) of them arise from stars with masses in the range 8–15 . We note that a progenitor in the mass range 20–40 has yet to be found for a normal SN II-P, and thus the fate of these very massive stars still needs to be observationally verified. However, because of the steeply declining mass function, it may be quite some time before a dearth of very massive progenitors presents a significant challenge to theory.
It is also unclear whether stars more massive than 20 actually become normal SNe II-P, or give rise to SNe II-L, such as SN 1979C (Branch et al. 1981; Van Dyk et al. 1999a), or SNe IIn, such as SN 1988Z (Stathakis & Sadler 1991; Chugai & Danziger 1994) and SN 1995N (Fransson et al. 2002). Massive blue variable stars (–40 ) may undergo super-outbursts (sometimes misclassified as SNe) while in the luminous blue variable stage (e.g., Van Dyk et al. 2000), en route to becoming Wolf-Rayet stars, SNe Ic, and perhaps even collapsars (which appear to be responsible for long-duration gamma-ray bursts).
We have already discussed that SN 2005cs could be subluminous, as was SN 2003gd (Van Dyk et al. 2003; Hendry et al. 2005). Its post-plateau photometric behavior will corroborate this (we predict it should decline markedly in brightness in all bands after the plateau phase, much more so than for prototypical SNe II-P). Zampieri et al. (2003) proposed that these subluminous SNe II-P with low expansion velocities and low 56Ni yields, such as SN 1999br, SN 2003gd, and now possibly SN 2005cs, originate from high-mass () progenitors in which the rate of early infall of stellar material on the collapsed core is large. They further postulated that events of this type could form a black hole remnant, giving rise to significant fallback and late-time accretion. It is apparent from the direct mass estimates for both the SN 2003gd and SN 2005cs progenitors, as well as from the upper mass limit for SN 1999br, that these subluminous SNe are produced by relatively low-mass red supergiants, which may end their lives in less energetic explosions.
We also note that the low energy output and the low synthesized yields for 56Ni suggest that, even though the rate of such events is higher than SNe from more massive stars, the impact on the energy input and chemical evolution of their host galaxies per event is relatively small. Certainly, it is thought that at very early times in galactic history (), the initial mass function was heavily skewed to very massive stars of essentially zero metallicity, and these stars contributed entirely to the early galactic evolution (e.g., Matteucci & Calura 2005; Umeda & Nomoto 2005). The contribution of lower-mass stars has increased steadily over cosmic history, although the explosions of the more massive stars could still have a large impact on galaxies today. A careful SN rate calculation such as that being conducted by Leaman et al. (2004), and detailed models for nucleosynthesis in the SN II explosions (Woosley & Weaver 1995), will provide useful information on the relative contribution to the chemical evolution of galaxies from SNe of various progenitor masses.
5 Conclusions
In this paper we have analyzed HST/ACS and NICMOS data for M51 before the discovery of SN 2005cs, and we have identified the progenitor of SN 2005cs. The secure identification of the progenitor is achieved by geometrical transformations, using new images of SN 2005cs from KAIT, CFHT, and HST/ACS. We measure = 24.150.20, , , and mag for the SN progenitor. Together, this information suggests that SN 2005cs originated from a red supergiant of spectral type K0–M3, with an initial mass of 7–9 . A significant trend appears to be emerging, that SNe II-P arise from massive stars with initial masses –15 .
SN 2005cs is a very important addition to those SNe whose progenitors have been directly identified, a very small (but growing) number of objects. This identification would have been very difficult without the deep images of superior spatial resolution obtained with HST/ACS; the progenitor star would almost certainly have been lost in the light of the neighboring bright star cluster had only inferior images been available. We will continue to monitor SN 2005cs with KAIT and other telescopes to better define the nature of the SN itself; it remains to be seen how this SN will ultimately behave.
References
- Aldering et al. (1994) Aldering, G., Humphreys, R. M., & Richmond, M. W. 1994, AJ, 107, 662
- (2) Branch, D., Falk, S. W., Uomoto, A. K., Wills, B. J., McCall, M. L., & Rybski, P. 1981, ApJ, 244, 780
- (3) Chugai, N. N., & Danziger, I. J., 1994, MNRAS, 268, 173
- Drilling & Landolt (2000) Drilling, J. S., & Landolt, A. U. 2000, in Allen’s Astrophysical Quantities, 4th ed., ed. A. N. Cox (New York: AIP), 381
- (5) Filippenko, A. V. 1997, ARA&A, 35, 309
- Filippenko et al. (2001) Filippenko, A. V., Li, W., Treffers, R. R., & Modjaz, M. 2001, in Small-Telescope Astronomy on Global Scales, ed. W.-P. Chen, C. Lemme, & B. Paczyński (ASP Conf. Ser. 246; San Francisco: ASP), 121
- (7) Filippenko, A. V., Matheson, T., & Ho, L. C. 1993, ApJ, 415, L103
- (8) Fransson, C., et al. 2002, ApJ, 572, 350
- (9) Gal-Yam, A. 2005, ATEL, No. 561
- Gilmozzi et al. (1987) Gilmozzi, R., et al. 1987, Nature, 328, 318
- Grevesse & Sauval (1998) Grevesse, N., & Sauval, A. J. 1998, Space Sci. Rev., 85, 161
- Hamuy et al. (2001) Hamuy, M., et al. 2001, ApJ, 558, 615
- (13) Hendry, M. A., et al. 2005, MNRAS, 359, 906
- (14) Immler, S., Kong, A., & Lewin, W. H. G. 2005, IAU Circ., No. 8564
- (15) Kloehr, W. 2005, IAU Circ., No. 8553
- (16) Krist, J., & Hook, R. 2003, Tiny Tim User’s Manual, v6.1
- (17) Leaman, J., Li, W., & Filippenko, A. V. 2004, AAS Meeting 205, #71.02
- Lejeune & Schaerer (2001) Lejeune, T., & Schaerer, D. 2001, A&A, 366, 538
- (19) Leonard, D. C., et al., 2002a, AJ, 124, 2490
- (20) Leonard, D. C., et al., 2002b, PASP, 114, 35
- Li et al. (2000) Li, W., et al. 2000, in Cosmic Explosions, ed. S. S. Holt & W. W. Zhang (New York: American Institute of Physics), 103
- (22) Li, W. 2005, IAU Circ., No. 8553
- (23) Li, W., Filippenko, A. V., & Van Dyk, S. D. 2005b, ATEL, No. 492
- (24) Li, W., Filippenko, A. V., & Van Dyk, S. D.. 2005e, IAU Circ., No. 8565
- (25) Li, W., Van Dyk, S. D., & Filippenko, A. V. 2005c, IAU Circ., No. 8556
- (26) Li, W., Van Dyk, S. D., Filippenko, A. V., & Cuillandre, J.-C. 2005a, PASP, 117, 121
- (27) Li, W., Van Dyk, S. D., Filippenko, A. V., Cuillandre, J.-C., & Jha, S. 2005d, IAU Circ., No. 8556
- (28) Matteucci, F., & Calura, F. 2005, MNRAS, 360, 447
- (29) Maund, J. R., & Smartt S. J. 2005, MNRAS, 360, 288
- (30) Modjaz, M., Kirshner, R. P., Challis, P., & Hutchins, R. 2005, IAU Circ., No. 8555
- (31) Mutchler, M., et al. 2005, BAAS, Vol. 37, No. 2
- (32) Richmond, M. W. 2005, IAU Circ., No. 8555
- (33) Richmond, M. W., et al. 1996, AJ, 111, 327
- Ryder et al. (1993) Ryder, S., Staveley-Smith, L., Dopita, M., Petre, R., Colbert, E., Malin, D., & Schlegel, E. M. 1993, ApJ, 416, 167
- Schlegel, Finkbeiner, & Davis (1998) Schlegel, D. J., Finkbeiner, D. P., & Davis, M. 1998, ApJ, 500, 525
- (36) Sirianni, M., et al. 2005, PASP, submitted.
- (37) Smartt, S. J., Gilmore, G. F., Tout, C. A., & Hodgkin, S. T 2002, ApJ, 565, 1089
- Smartt, Maund, & Hendry (2003) Smartt, S. J., Maund, J. R., Hendry, M. A., Tout, C. A., Gilmore, G. F., Mattila, S., & Benn, C. R. 2004, Science, 303, 499
- (39) Smartt, S. J., et al. 2003, MNRAS, 343, 735
- Sonneborn, Altner, & Kirshner (1987) Sonneborn, G., Altner, B., & Kirshner, R. P. 1987, ApJ, 323, L35
- (41) Stathakis, R. A., & Sadler, E. M. 1991, MNRAS, 250, 786
- Stetson (1987) Stetson, P. B. 1987, PASP, 99, 191
- Tokunaga (2000) Tokunaga, A.T. 2000, in Allen’s Astrophysical Quantities, 4th ed., ed. A. N. Cox (New York: AIP), 143
- (44) Umeda, H., & Nomoto, K. 2005, ApJ, 619, 427
- (45) Van Dyk, S. D., Li, W., & Filippenko, A. V. 2003a, PASP, 115, 1289
- (46) Van Dyk, S. D., Li, W., & Filippenko, A. V. 2003b, PASP, 115, 448
- (47) Van Dyk, S. D., Garnavich, P. M., Filippenko, A. V., Höflich, P., Kirshner, R. P., Kurucz, R. L., & Challis, P. 2002, PASP, 114, 1322
- (48) Van Dyk, S. D., Peng, C. Y., Barth, A. J., & Filippenko, A. V. 1999, AJ, 118, 2331
- (49) Van Dyk, S. D., Peng, C. Y., Barth, A. J., Filippenko, A. V., Chevalier, R. A., Fesen, R. A., Fransson, C., Kirshner, R. P., & Leibundgut, B. 1999a, PASP, 111, 313
- Van Dyk et al. (2000) Van Dyk, S. D., Peng, C. Y., King, J. Y., Filippenko, A. V., Treffers, R. R., Li, W., & Richmond, M. W. 2000, PASP, 112, 1532
- (51) Woosley, S. E., & Weaver, T. A. 1986, ARA&A, 24, 205
- (52) Woosley, S. E., & Weaver, T. A. 1995, ApJS, 101, 181
- (53) Zampieri, L., et al. 2003, MNRAS, 338, 711
- (54) Zaritsky, D., Hill, J. M., & Elston, R. 1990, AJ, 99, 1108
- Zwicky (1964) Zwicky, F. 1964, ApJ, 139, 514


| Dataset | UT Date | Exp. (s) | Inst. | Aperture | Filter | Prop. ID |
|---|---|---|---|---|---|---|
| h_m51_b_s05_drz_sciaaThis image is the final mosaic of many single exposures. | 2005 Jan | 2720 | ACS | WFC | F435W | 10452 |
| h_m51_v_s05_drz_sciaaThis image is the final mosaic of many single exposures. | 2005 Jan | 1360 | ACS | WFC | F555W | 10452 |
| h_m51_h_s05_drz_sciaaThis image is the final mosaic of many single exposures. | 2005 Jan | 1360 | ACS | WFC | F658N | 10452 |
| h_m51_i_s05_drz_sciaaThis image is the final mosaic of many single exposures. | 2005 Jan | 1360 | ACS | WFC | F814W | 10452 |
| N48R02150 | 1998 Jun 28 | 255.72 | NICMOS | NIC3 | F110W | 7237 |
| N48R02160 | 1998 Jun 28 | 255.72 | NICMOS | NIC3 | F160W | 7237 |
| N48R02170 | 1998 Jun 28 | 255.72 | NICMOS | NIC3 | F222M | 7237 |
| N48R02180 | 1998 Jun 28 | 511.61 | NICMOS | NIC3 | F187N | 7237 |
| N48R02190 | 1998 Jun 28 | 511.61 | NICMOS | NIC3 | F190N | 7237 |
| Dataset | UT Date | Exp. (s) | Inst. | Aperture | Filter | Prop. ID |
|---|---|---|---|---|---|---|
| J90ZP1010 | 2005 Jul 11 | 960 | ACS | HRC | F220W | 10182 |
| J90ZP1020 | 2005 Jul 11 | 480 | ACS | HRC | F250W | 10182 |
| J90ZP1030 | 2005 Jul 11 | 240 | ACS | HRC | F330W | 10182 |
| N90ZQ1020 | 2005 Jul 13 | 255.72 | NICMOS | NIC3 | F110W | 10182 |
| N90ZQ1030 | 2005 Jul 13 | 511.71 | NICMOS | NIC3 | F160W | 10182 |