X-ray Emission from Wind Blown Bubbles. III. ASCA SIS Observations of NGC 6888
Abstract
We present ASCA SIS observations of the wind-blown bubble NGC 6888. Owing to the higher sensitivity of the SIS for higher energy photons compared to the ROSAT PSPC, we are able to detect a K plasma component in addition to the K component previously detected in PSPC observations. No significant temperature variations are detected within NGC 6888. García-Segura & Mac Low’s (1995) analytical models of WR bubbles constrained by the observed size, expansion velocity, and mass of the nebular shell under-predict the stellar wind luminosity, and cannot reproduce simultaneously the observed X-ray luminosity, spectrum, surface brightness profile, and SIS count rate of NGC 6888’s bubble interior. The agreement between observations and expectations from models can be improved if one or more of the following ad hoc assumptions are made: (1) the stellar wind luminosity was weaker in the past, (2) the bubble is at a special evolutionary stage and the nebular shell has recently been decelerated to 1/2 of its previous expansion velocity, and (3) the heat conduction between the hot interior and the cool nebular shell is suppressed. Chandra and XMM-Newton observations with high spatial resolution and high sensitivity are needed to determine accurately the physical conditions NGC 6888’s interior hot gas for critical comparisons with bubble models.
1 Introduction
The fast stellar wind from a massive star can sweep up its ambient medium into a dense shell up to a few 10 pc across, with the central cavity filled with a hot, tenuous, X-ray-emitting plasma, a so-called wind-blown bubble (e.g., Weaver et al., 1977). It is expected that every star with sufficient wind power should be surrounded by a wind-blown bubble.
Wolf-Rayet (WR) stars are excellent candidates for producing bubbles, as they have winds with high terminal velocities, 1000 km s-1, and large mass-loss rates, 10-5–10-4 yr-1 (Prinja et al., 1990). Optical surveys of WR ring nebulae (Chu et al., 1983; Heckathorn et al., 1982; Miller & Chu, 1993; Marston et al., 1994, 1994) show that about 1/4 of the 150 observed Galactic WR stars are associated with ring-like nebulae. Most of these nebulae, however, are amorphous rings with dynamic ages much larger than the lifetime of a WR phase, and hence they have been suggested to be merely photoionized, instead of being dynamically shaped, by the WR stars (Chu, 1981). Only about 10 WR ring nebulae have sharp rims and short dynamical ages suggesting that they are bubbles blown by the central stars during the WR phase. The small number of WR bubbles indicates that their formation mechanism may not be as simple as one naively thinks.
The morphology and dynamical structure of a wind-blown bubble are dependent on the distribution of the ambient medium. Weaver et al. (1977) derived analytical solutions to the dynamical evolution of a bubble in a homogeneous medium, and showed that heat conduction and evaporation across the contact discontinuity which separates the hot interior from the outer shell determines the temperature and density profiles of the interior. Their work was later complemented by the numerical calculations of Różyczka (1985). These early calculations were later extended by García-Segura & Mac Low (1995a, hereafter GM) analytically and by García-Segura & Mac Low (1995b) numerically to a more realistic model incorporating the time dependence of the wind parameters due to the evolution of the central star. According to the evolutionary sequence of massive stars (Chiosi & Maeder, 1986; van der Hucht, 1992, and references therein), the progenitor of a WR star is a luminous blue variable (LBV; M 60 ) or a red supergiant (RSG; 25 M 60 ). In the latter case, the expansion of the fast WR wind into the slow RSG wind with a density profile naturally leads to dynamic instabilities (Vishniac instability) in the swept-up shell. As the swept-up shell advances past the outer edge of the RSG wind, further instabilities (Rayleigh-Taylor instability) set in and fragment the shell. Thus the dense shell becomes clumpy and filamentary, allowing the hot shocked stellar wind to break out and form a shock ahead of the fragmented dense shell (García-Segura et al., 1996, hereafter GLM). This model has been successful in describing the basic optical morphology of bubbles blown by WR stars.
Of the 10 WR stars with wind-blown bubbles, four have been observed in soft X-rays with the ROSAT Position Sensitive Proportional Counter (PSPC): NGC 2359, NGC 3199, NGC 6888, and S 308. The latter two have been detected, but their observed X-ray properties are discrepant from the theoretical predictions in two respects (Wrigge, Wendker, & Wisotzki 1994, hereafter Paper I; Wrigge 1999, hereafter Paper II). First, the observed X-ray luminosity is more than a factor of 10 lower than that expected in models constrainted by independently observed stellar wind velocity, mass-loss rate, and bubble dynamics, such as shell size, expansion velocity, mass, etc. (e.g., Bochkarev & Lozinskaya, 1985). Second, the X-ray surface brightness profiles (in terms of the observed count rate distribution) disagree with predictions. Both NGC 6888 and S 308 show limb-brightened surface brightness profiles as opposed to the center-filled appearance expected in models.
Paper I suggested two possible explanations for the X-ray surface brightness profiles: (1) The ring nebula might be in an advanced evolutionary stage when the dense swept-up shell has already overtaken the entire RSG wind, leading to the shell fragmentation and allowing the hot gas in the bubble interior to expand faster into the surrounding medium. Thus, the inner stellar wind shock front could advance closer to the outer edge of the shell and reduce the volume of hot gas; furthermore, the temperature and density of the hot gas could be lowered due to the fast adiabatic expansion. (2) The WR shell has not actually overtaken the entire RSG wind, but the heat conduction across the contact discontinuity is less effective than assumed in the analytical models because of the saturation of heat fluxes (Cowie & McKee, 1977; Dalton & Balbus, 1993) or the presence of magnetic fields (e.g., Spitzer, 1967). In this case, a bubble interior would have higher temperatures and lower densities, which make the X-ray emission difficult to detect because of the relatively soft energy bandpass of the ROSAT PSPC.
To distinguish between these two possibilities, X-ray observations with a higher spectral resolution and a harder energy bandpass are needed. We have therefore obtained observations of NGC 6888 using the Advanced Satellite for Cosmology and Astrophysics (ASCA). This paper reports our analysis of these observations. In Section 2 we describe the ASCA SIS observations and data reduction. Section 3 describes the spectral fitting results and derives physical properties of the hot gas inside the bubble. The observations are compared with model predictions in Section 4, and a summary is given in Section 5.
2 X-ray Observations
We have carried out X-ray observations of NGC 6888 with the ASCA X-ray Observatory. Our goal was to use the improved spectral resolution and extended spectral coverage of ASCA to further our understanding of the physical conditions of the hot gas interior to NGC 6888, in light of the discrepancies between results of ROSAT PSPC observations and model predictions reported in Paper I. We have used both the ROSAT PSPC and ASCA observations in the analysis reported in this paper.
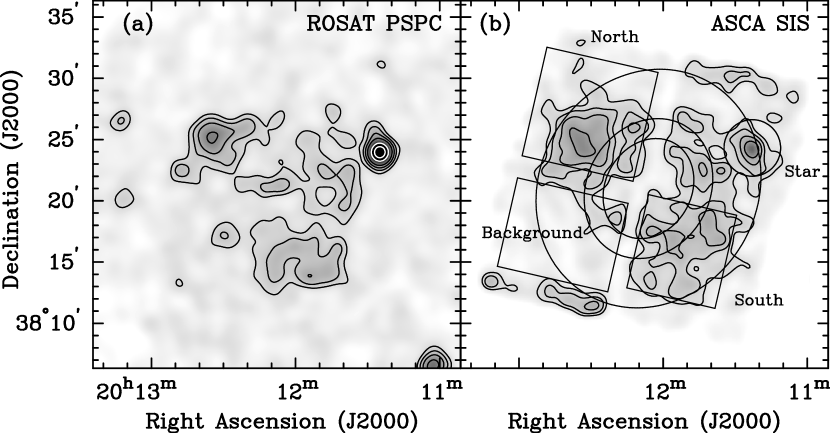
The ROSAT PSPC observations have been discussed in detail in Paper I. We present here only a brief summary. The observations were performed on 1991 April 13 – 14, and are archived under the observation number WP900025. For these observations, the WR star WR 136 (HD 192163) was centered in the PSPC. The on-axis angular resolution of the PSPC was 30″ at 1 keV. The PSPC is sensitive in the energy range of 0.1 – 2.4 keV and has an energy resolution of 43% at 1 keV. The total effective exposure time was 7,866 s. The PSPC image of NGC 6888, smoothed to 80′′ resolution, is shown in Figure 1a.
Our ASCA observations were performed on 1995 October 31 – November 1. The ASCA Observatory has been described by Tanaka et al. (1994). Briefly, the satellite carries four imaging thin-foil grazing incidence X-ray telescopes. Two of the telescopes are focused on Solid-state Imaging Spectrometers, called SIS 0 and SIS 1. The other two telescopes use Gas Imaging Spectrometers (GIS) as the detectors. The GIS observations of NGC 6888 are not used in our analysis because of the GIS’s low sensitivity to photon energies below 1 keV, where most X-ray emission from NGC 6888 concentrates. The SIS detectors have an energy resolution of 2% at 6 keV and cover the energy range 0.4 – 10 keV, with reduced throughputs near the ends of the band. The SIS’s point spread function has a narrow core of 1′ diameter and a half-power radius of 3′. Each of the two SIS detectors is composed of 4 separate CCDs. Not all CCDs must be activated for a given observation. The presence of “hot” and “flickering” pixels, which fill the telemetry with false signals, has made it necessary to use only a subset of each detector for many observations.
Because of the telemetry limitations, our observations were performed in the two-CCD mode. We used complementary pairs of CCDs from the SIS 0 and SIS 1 detectors so that the entire field of view of the SIS was covered, although any point on the sky was observed by only one of the two telescopes. The center of the SIS detector mosaic was placed at approximately the geometric center of the optical shell of NGC 6888. The observations were performed in the faint mode when allowed by the telemetry, and converted to the bright mode on the ground for analysis. Using the standard processing software (ascascreen and ftools), we removed bad time periods using the following selection criteria: aspect deviation 0.01∘, angle to bright earth , elevation 10∘, minimum cutoff rigidity of 6, and PIXL rejection of 75. We also removed hot and flickering pixels. After screening, a total of 43,308 s of usable data remained for SIS 0 and 39,936 s remained for SIS 1. We included only high and medium bit-rate data because of problems reported for low bit-rate data. A smoothed SIS image of NGC 6888 is shown in Figure 1b.
We defined two sets of source regions to study the X-ray emission from NGC 6888. The first set consists of a pair of rectangular regions centered on the two bright emission peaks, similar to those defined in Paper I; these two regions will be called the North and South Regions. The second set comprises three elliptical regions concentric with the optical shell of NGC 6888. These three elliptical regions allow us to study the variation of X-ray properties with radius. These regions are outlined in Figure 1b.
An important issue is the determination of the background spectra. For the PSPC, we extracted a background spectrum from an annulus at the outer edge of the inner portion of the detector. This annulus is free of emission from NGC 6888 and contains only one obvious source, which was excluded in the extraction (see Fig. 1). It is necessary to correct this background spectrum for the energy-dependent vignetting in the instrument. For the PSPC, the vignetting is a function of radius and energy. We have determined the ratio of the effective areas as a function of energy for each of the regions. This ratio is nearly constant for energy 1.5 keV, where the majority of PSPC background photons originate. Because the ratio is nearly constant, we have applied only a constant correction, which is estimated to introduce no more than 2% error on the background flux. Since the background flux is always a factor of 4 to 5 lower than the source flux, this does not introduce a significant error into the PSPC spectra.
For the ASCA SIS data, there are two ways to determine the background. It is possible to use a source-free region in the SIS image as the background, similar to what we have done with the PSPC data; however, there are several problems with this approach. First, the energy dependence of the effective area correction is larger. Second, the smaller field of view of the SIS means that the source-free background regions have a smaller total amount of signal and hence will introduce noises in the background subtraction. Finally, in our SIS observations of NGC 6888, a large source-free region is found in one active CCD of the SIS 1 detector, but not the other active CCD of SIS 1 or either of the active CCDs of SIS 0. Since the detectors have different channel-to-energy relationships, it is not advised to apply background from one detector to another. The alternative to this background subtraction is to use data from the background field observations supplied by the ASCA Guest Observer Facility. These background observations are taken in source-free regions in the sky, and are sorted according to the cutoff rigidity of the observations. We have selected a field appropriate for our observations, and double-checked the validity of this background field for our region by subtracting it from a source-free region in our field. Only 16% of the flux remains, and roughly half of it is in the highest 50 energy channels that are not included in our spectral fits. The error introduced by this chosen background field is probably small, but may not be negligible for the 1–2 keV band that is crucial in the spectral fits. Background spectra for the source regions are extracted from the background field using the same region templates.
For the ASCA data, spectra were extracted from both SIS 0 and SIS 1. The datasets from the two SIS telescopes and the PSPC cannot be simply combined directly (i.e., added together) as the three telescopes have distinct response matrices. Instead, the three spectra were fitted jointly to the same models using XSPEC. The normalizations were fitted as independent free parameters to allow for differences in spatial and spectral resolution and the different portions of the sky covered by the regions. Spectral bins for all three instruments were grouped together in order to give sufficient counts in each spectral bin so that the statistics would be valid. We have used primarily spectral models of optically thin thermal plasmas from Raymond & Smith (1977, hereafter RS). In some cases, as discussed below, Mewe-Kaastra models (Mewe et al., 1985; Kaastra, 1992, hereafter MEKA) were also used for comparisons with RS models.
3 Results
3.1 The X-ray Image
Figure 1 shows X-ray images of NGC 6888 in the 0.4–2.4 keV band from (a) the ROSAT PSPC and (b) the ASCA SIS observations. To improve the signal to noise ratio, both the PSPC and SIS images were smoothed to an effective angular resolution of 80″ (FWHM). The smoothed images show very similar X-ray morphologies with the X-ray emission distributed in a shell-like structure just interior to the optical filaments. No diffuse emission from the central region of the bubble is detected. For the SIS observations discussed below, the detection threshold is counts s-1 arcmin-2, corresponding to a surface brightness 3 above the background of counts s-1 arcmin-2.
3.2 X-ray Spectra
3.2.1 North and South Regions
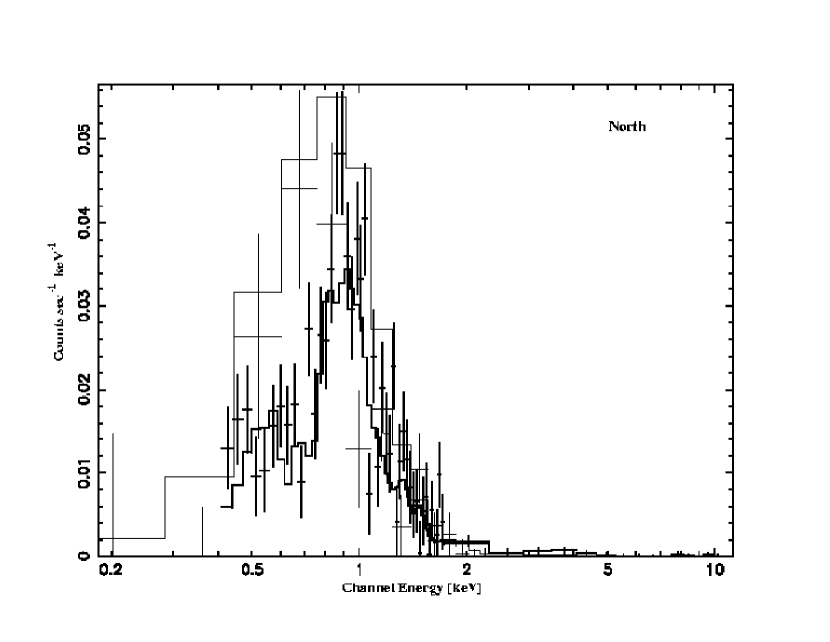
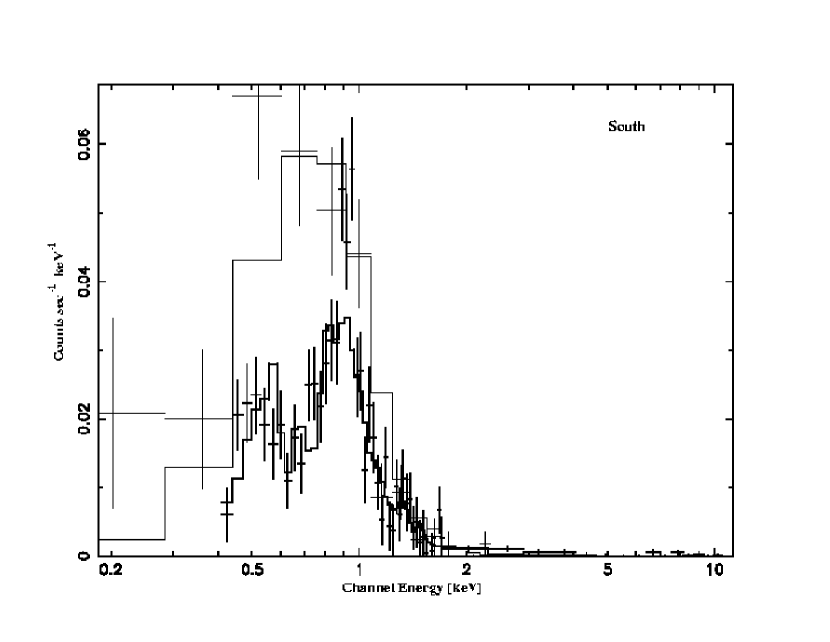
In order to compare the ASCA observation with the previous ROSAT observations, we extracted SIS spectra from the same North and South Regions used in Paper I for the PSPC observations. Figure 2 shows the combined count rate spectra from the PSPC (thin crosses) and SIS (thick crosses) datasets for (a) the North and (b) the South Regions. The SIS detected 191 and 360 net source photons in these two regions, respectively. The SIS count rate for the two regions combined is 1.4 counts s-1. Since thermal plasma emission is the most probable emission mechanism in wind blown bubbles, we fitted RS models of optically thin ionization-equilibrium plasma emission to the data. The free parameters in the fits are the plasma temperature , the absorption column density parameterized by the hydrogen column density , and the normalization factor , where is the electron density of the plasma, is the volume, and is the distance. In some of the fits, or may be held fixed.
The small number of counts detected does not warrant elaborate spectral models; therefore, we start with a single temperature plasma model. We find that the combined PSPC + SIS count rate spectra cannot be satisfactorily fitted with a single temperature plasma model. An additional high temperature component contributing fluxes to the high energy channels is needed to yield acceptable reduced values. This marked difference from the PSPC observations (Paper I) is mainly due to the higher energy resolution of the SIS detector. We have also varied the abundances of the elements N, Ne, Fe, and Ni, which contribute to the line emission in the SIS band, but the fits do not generally improve significantly, unless we increase the abundances to unphysically high values. We therefore have fixed the abundances to solar values. We have also tried MEKA models for the fits. Generally the derived plasma parameters are compatible with those found with RS fits within the error limits, but it is worthwhile noting that the derived fluxes and luminosities differ by up to 30%. This may be considered a lower limit of the uncertainties associated with the values.
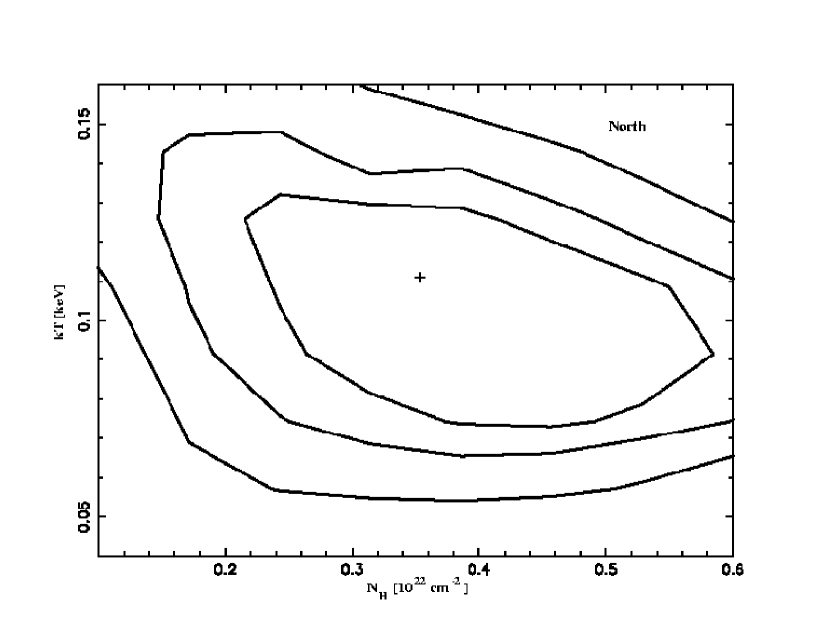
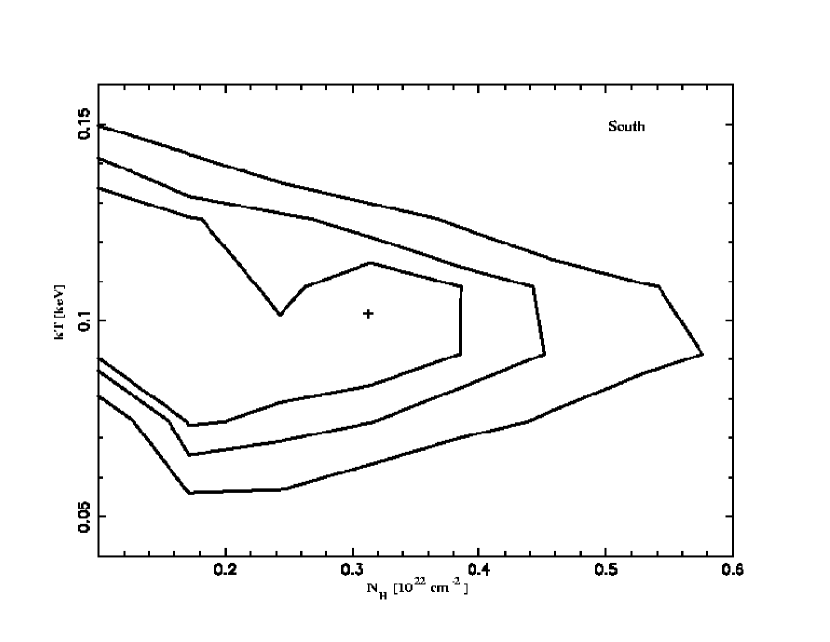
One important goal of this work is to identify any variations in the observed plasma temperature as a function of position, corresponding to variations in the physical conditions of the emitting plasma. To investigate temperature variations across the nebula, it is crucial that the foreground absorption column density is accurately determined. In the soft X-ray regime, one often finds the fitted temperatures in the K range to be strongly dependent on the fitted values: lower temperatures can be compensated by higher absorption column densities (see the analysis of S 308 in Paper II for an example). For this reason, both the absolute value of and its possible variation across the nebula must be known. For the latter, Wendker et al. (1975) compared H and 21-cm radio continuum observations of NGC 6888 and showed that is constant over the nebula. To compare the optical and X-ray extinctions, we fitted two-temperature plasma emission models to the spectra of the North and South Regions, and calculated the contour plots of versus the lower temperature (the higher temperature and normalization as the free parameters), shown in Figure 3. The acceptable values of are in the range H cm-2. The reddening towards WR 136, the central star of NGC 6888, was found to be mag from optical measurements (Hamann et al., 1994). Using the Galactic gas-to-dust ratio / = H cm-2 mag-1 (Bohlin et al., 1978) and (Lundström & Stenholm, 1980), the reddening can be converted to = H cm-2. This value was also adopted in Paper I. The optical and X-ray measurements of agree well. We thus use a fixed value of = H cm-2, with an uncertainty of 30%, for the spectral analysis. The fitted spectra are plotted in Figure 2 as solid lines, and the results of the fits are listed in Table 1.
One immediate result is that the temperatures of the low- and high-temperature components do not change significantly from the North to the South Region (see Table 1). The ratio of the normalization factors, , for the lower and higher temperature components increases by a factor of 1.8 from the North to the South Region. Since the cooling function (in the SIS band) does not change significantly over the temperature range of interest, the relative contribution of the lower temperature plasma to the total flux from these regions increases by the same factor. Note, however, that the errors in the fit parameters are large, so these results are also compatible with the hypothesis that the North and South Regions have similar thermal properties. This has also been deduced from the ROSAT PSPC data. Owing to the sensitivity of the SIS to higher energy photons, we are now able to extend this conclusion to gas in the temperature range K.
Table 1 also lists the observed and absorption-corrected X-ray fluxes. The observed PSPC + SIS fluxes agree very well with the results in Paper I, but our absorption corrected fluxes are higher by a factor of 4. This is mainly due to the slightly lower temperature we found for the low-temperature component: for a given foreground absorption column density, the factor converting observed count rate to unabsorbed flux increases with decreasing temperature.
3.2.2 Elliptical Regions
The analysis of the North and South Regions suggests that there is no discernible temperature differences between the two ends along the major axis of NGC 6888. We next search for radial temperature variations by analyzing spectra extracted from concentric elliptical annuli. The elliptical regions are shown in Figure 1b. We define three regions, Ellipses 1, 2, and 3, corresponding to the outermost annulus, the middle annulus, and the innermost ellipse, respectively. For each region, a PSPC spectrum is extracted from the entire region, and two SIS spectra are extracted separately from the two portions covered by the SIS 0 and SIS 1. The three spectra (PSPC, SIS 0, and SIS 1) are fitted simultaneously; to account for the different volumes actually sampled by each spectrum, three normalization factors for each temperature component are fitted as free parameters.
We have performed spectral fits incorporating single-temperature RS models as well as two-temperature RS models. Ellipses 1 and 2 require two temperatures in order to fit the data well, but Ellipse 3 shows only a marginal improvement in the with two temperatures. It should be noted, however, that Ellipse 3 has a low number of counts, which may explain this difference. As shown in §3.2.1 for the rectangular regions, which encompass most of the same fluxes, it is not possible to fit a single-temperature RS spectrum by allowing the abundances to vary, even with significant changes in certain elements. Thus, for the fits in the elliptical regions, we have set the abundances to the solar value, and fixed the absorption column density to H cm-2, the value implied by the optical extinction. Table 2 shows the results of fits for the three elliptical regions. Instead of listing all 18 normalization factors, we give only the sum of the normalization factors for the SIS spectra. Note that within the errors the sum of the SIS normalization factors agree with the PSPC normalization factor, confirming the consistency of the simultaneous fits.
Again, we do not find any significant temperature variation among the elliptical regions for either the low- or high-temperature component. Owing to the large uncertainty in the normalization factors, it is not possible to estimate variations in the relative contributions of the low- and high-temperature components to the X-ray emission from these regions.
4 Discussion
Previous X-ray studies of NGC 6888 compared observations with Weaver et al.’s models and found large discrepancies (Paper I; Bochkarev, 1988). It is now understood that Weaver et al.’s model of interstellar bubbles in a homogeneous medium is not applicable, because NGC 6888 was formed by the interaction between the WR wind and a previous RSG wind with a radial density drop-off proportional to . NGC 6888 is better described by GM’s models taking into account the RSG wind. Thus, we compare the ASCA observations with predictions from the analytical models of GM.
We have searched the literature for independent observations of physical parameters of the stellar wind and nebular shell of NGC 6888. The best determined physical parameters as well as the relevant references are summarized in Table 3. Using GM’s analytical models, a bubble can be fully specified if the size, mass, and expansion velocity of the nebular shell are known. We thus use the observed parameters of the nebular shell and GM’s model to produce the density and temperature profiles in the bubble interior, and further use a thermal emission model as implemented in the Raymond & Smith (1977) code (kindly provided by J. Raymond) to calculate the expected X-ray luminosity, spectra, and surface brightness profiles of NGC 6888 for comparison with observations. In addition, we use the nebular shell parameters and the GM model to determine the expected mechanical luminosity of the stellar wind (), which can also be compared to that derived from the observed stellar wind terminal velocity (), and mass loss rate (), i.e., , as another independent check of the model.
We have considered six GM models with different shell masses and expansion velocities (see Table 4) for the following reasons. The ionized shell mass of NGC 6888 has been estimated to be 4 (Wendker et al., 1975) and the neutral shell mass 40 (Marston & Meaburn, 1988). We consider these two masses as the lower and upper limits of the shell mass of NGC 6888; thus models 1, 3, and 5 use 4 as the shell mass, and models 2, 4, and 6 use 40 as the shell mass. To explore the parameter space, we have used the observed expansion velocity of 75 km s-1 in models 1 and 2, and assumed expansion velocities of 100 km s-1 in models 3 and 4, and 200 km s-1 in models 5 and 6. The expected stellar wind luminosity, X-ray luminosity of the bubble interior, and ASCA SIS count rate are listed in Table 4.
The observed ASCA SIS spectra and surface brightness profiles are affected by interstellar absorption, the energy- and position-dependent effective area of the X-ray telescope (XRT), and the energy-dependent detector response matrix (DRM). It is not possible to remove these effects from the observed spectra and surface brightness profiles to derive intrinsic properties for comparison with model predictions. It is necessary to apply these absorption and instrument effects to the model predictions and compare the simulated ASCA SIS spectra and surface brightness profiles to the observations.
For the interstellar absorption cross section we used the analytical representation of the photoelectric cross section as given by Morrison & McCammon (1983). The effective area of the ASCA XRT we used is tabulated in the file “xrt_ea_v2_0.fits” provided in the ASCA calibration database at legacy.gsfc.nasa.gov. Note that the effective area file incorporates an azimuthal angle dependence for the effective area. Since the deviation from the mean effective area is only 5% in the energy range relevant for our observations, we have omitted the azimuthal dependence and used the effective area for . Concerning the DRM, we note that the ASCA SIS actually consists of two separate detectors, SIS 0 and SIS 1 with four CCDs each with different DRMs. Since the differences in the DRMs are small compared to the uncertainty in the emission models, we used the DRM for SIS 0 chip 1, file “s0c1g0234p40e1_512v0_8i.rmf” from the legacy database, in the simulations. The simulated ASCA SIS surface-brightness profiles and spectra for the six models are shown in Figures 4 and 5, respectively. In Figure 4, lines are drawn to mark the surface brightness that would be detected with 10 for an aperture of 1 arcmin2 in our ASCA SIS observations. (This 10 threshold is selected to represent an “easy detection”.)
Compared to the observed = ergs s-1, ergs s-1, and ASCA SIS count rate = counts s-1 (summed over the three elliptical regions), model 1 fails completely, under-predicting these luminosities and count rate by 1–2 orders of magnitude. Artificially raising the shell expansion velocity to 100 km s-1, model 3 still misses the marks by more than an order of magnitude. Using a high nebular shell mass, 40 , models 2 and 4 produce reasonable , but over-predict the ASCA SIS count rate and under-predict by an order of magnitude.
The incompatibility of models 1–4 with observations is also evident in spectral shape and surface brightness profile. The observed SIS spectra show two emission maxima whereas the expected spectra from models 1 and 3 exhibit only the lower energy peak, indicating a lack of a very hot plasma component in models. Indeed the best model fits to these two simulated spectra yield temperatures of only whereas the observed spectrum indicates an additional hot component at K. Models 2 and 4 produce reasonable spectral shapes, but their surface brightness profiles are markedly different from that observed in NGC 6888. As shown in Figure 1, NGC 6888 has a limb-brightened morphology with hardly any emission above our detection limit in the central region. However, models 2 and 4 predict a centrally filled appearance of the bubble resulting from the energy dependence of the foreground absorption. While the emissivity per unit volume increases outwards (due to the increasing density), the X-ray emission from the outer parts is softer (due to the decreasing temperature) and more heavily absorbed (due to the larger absorption cross section) especially for temperatures below K.
We may explore whether it is possible to reproduce the observed X-ray properties of NGC 6888 by adjusting, within their uncertainties, the input parameters of the model. As explained above, the foreground absorption column density governs the observed surface brightness profile. Since is approximated by the H I column density derived from the observed optical extinction and an empirically determined gas-to-dust ratio, a 30% uncertainty is expected (Bohlin et al., 1978). However, even if the adopted = H cm-2 is increased or decreased by a factor of 3, the expected X-ray morphology of NGC 6888 does not change significantly. The predicted count rates are roughly a factor of 3 higher and lower, respectively.
We next explore whether the uncertainties in observations of stellar wind properties may alleviate the discrepancy between bubble models and X-ray observations. It has been suggested that the stellar wind mass loss rate may be over-estimated by a factor of a few if the wind is clumpy (Moffat & Robert, 1994), but the clumping-corrected mass loss rate of NGC 6888’s central star WR 136 is very similar to the mass loss rate for a smooth wind, yr-1 (Nugis et al., 1998). It is unlikely that the stellar wind luminosity was an order of magnitude weaker in the past and gained strength only recently, as the mass loss rate and stellar wind terminal velocity of WR 136 are not particularly high compared to other WR stars. The observational properties of WR 136’s stellar wind are probably robust.
The hydrodynamical simulation of the formation and evolution of WR bubble by GLM offers an opportune instant that may solve the problem. In their model specifically made for WR stars that have evolved through a RSG phase, the WR shell becomes prominent in the optical when it collides with and overtakes the former RSG wind shell, and at the same time the WR shell decelerates to roughly 1/2 of its pre-collision velocity. At this instant of time, the observed would be of the prominent but slower shell. It is possible that NGC 6888’s WR shell has just overtaken the RSG shell so that the hot bubble interior is still in its adiabatic phase, and the temperature and density distributions have not changed significantly from those of pre-collision when the shell expansion velocity was twice as high as the currently observed. The numerical calculation from GLM for a 35 star, similar to NGC 6888’s central star WR 136, gives a pre-collision of 200 km s-1. Thus, we have adopted a shell expansion velocity of 200 km s-1 in models 5 and 6. Model 6, with a large nebular shell mass, produces an over-luminous bubble, while model 5 produces reasonable and surface brightness profile. Model 5 appears to match observations the best among the six models considered.
GLM’s hydrodynamical simulation of WR bubble reproduces the observed bubble dynamics remarkably well, but does not yield a hot interior with the observed X-ray surface brightness or luminosity. The temperature of a bubble’s hot interior depends not only on the fast stellar wind’s post-shock temperature but also on the heat conduction across the contact discontinuity between the hot interior and the cooler nebular shell. It is possible that the heat conduction is not as efficient as assumed in models because of saturation of heat conduction (Dalton & Balbus, 1993) and/or the presence of tangential magnetic field. Therefore, we have kept the basic pressure-driven (or adiabatic) bubble model, but made an ad hoc assumption that the heat conduction rate is lower and approximated its effect by using a higher central temperature for the bubble interior. The pressure of a bubble interior is given by the shell dynamics. We use Model 6 as the initial model since its expected agrees best with the observationally derived . We then artificially raise the central temperature by factors of 2, 5, 10, and 20, and display the expected X-ray surface brightness profiles in Figure 6. The expected surface brightness profile for the second model, with a central temperature of K, shows a limb brightening (Fig. 6, upper-right panel), but its overall surface brightness is still considerably higher than that of the brightest peaks observed in NGC 6888. Thus it seems that a simple increase of the temperature scale, or a decrease in the efficiency of heat conduction, goes in the right direction but drastic changes in the conduction efficiency are needed to produce satisfactory surface brightness profiles.
Finally there may be a possibility that the X-ray emitting volume is far smaller than predicted in the analytical model. In fact, Paper I finds that the emitting volume in the ROSAT PSPC band comprises only 1% of the total volume of the bubble, but it was not clear whether there exists gas with temperatures of a few K. This very hot gas is not detected in the ASCA observations. The numerical model of GLM shows that the outer RSG shell should fragment and break apart shortly after the WR shell hit and overtook it. Qualitatively one would expect the hot interior of the bubble to quickly expand through the gaps and cool adiabatically. In the meantime, the inner shock front moves outward toward the shell and reduces the volume of hot gas. The ASCA SIS observations lack the angular resolution for detailed analysis of the distribution of hot gas relative to the cool nebular shell material. Deep, high-resolution or XMM-Newton observations will provide clear X-ray images for critical tests of bubble models.
5 Summary and Conclusions
We have obtained ASCA SIS observations of the wind-blown bubble NGC 6888. Its spectral coverage extends to higher energy range than that of the ROSAT PSPC, thus allows us to detect a high temperature component at K in addition to the low temperature component at K. Both components are detected near the periphery of the nebular shell. No significant X-ray emission can be detected from the central regions of NGC 6888. The X-ray emission has been divided into North and South regions or three concentric elliptical annuli, but no significant temperature variations are detected.
GM’s analytical models for bubbles produced by WR stars that are descendants of RSGs are used to simulate the observed X-ray spectrum, surface brightness profile, and ASCA SIS count rate. These observed parameters are compared with those expected from six GM models with two different nebular shell masses (4, 40 ) and three different shell expansion velocities (75, 100, 200 km s-1). None of these models produce all of the observed parameters satisfactorily. Furthermore, none of these models can produce the limb-brightened X-ray morphology observed. To improve the agreement between observations and model expectations, ad hoc assumptions are needed, such variable stellar wind luminosity, recent deceleration of the nebular shell, and suppressed heat conduction between the hot bubble interior and the cool nebular shell.
More observations and detections of wind-blown bubbles are needed to gain a deeper understanding of the physics determining the soft X-ray emission from bubble interiors. It is disappointing and puzzling that diffuse X-ray emission has been detected in only two WR bubbles (Wrigge, 1999). We have shown that besides integrated properties such as X-ray luminosity and observed count rate, the spatial (angular) variations of temperature, density and observed surface brightness are crucial for any comparison with theoretical models. Deep X-ray observations with high angular and spectral resolution are needed for a detailed analysis of hot gas in NGC 6888. Of particular importance is a clean excision of background point sources when extracting spectra of the diffuse X-ray emission. Recent XMM-Newton observations of the WR bubble S 308 have been used to demonstrate that the high-temperature plasma component derived from the ROSAT PSPC spectral fits (Paper II) may be an artifact owing to a contamination of unresolved point sources (Chu et al., 2003). Chandra observations of the northern part of NGC 6888 have revealed numerous point sources (Gruendl et al., 2003); a careful analysis is needed to verify or reject the high temperature component indicated by the ASCA SIS observations. Sensitive XMM-Newton observations of NGC 6888 are needed to verify the filamentary distribution of hot gas shown in the ROSAT High Resolution Imager observations (Wrigge & Wendker, 2002).
References
- Bochkarev (1988) Bochkarev, N. G. 1988, Nature, 332, 518
- Bochkarev & Lozinskaya (1985) Bochkarev, N. G., & Lozinskaya, T. A. 1985, AZh, 62, 103 (Soviet Astronomy, 29, 60)
- Bohlin et al. (1978) Bohlin, R. C., Savage, B. D., & Drake, J. F. 1978, ApJ, 224, 132
- Chiosi & Maeder (1986) Chiosi, C., & Maeder, A. 1986, ARA&A, 24, 329
- Chu et al. (2003) Chu, Y.-H., Guerrero, M. A., Gruendl, R. A., García-Segura, G., & Wendker, H. J. 2003, ApJ, 599, 1189
- Chu et al. (1983) Chu, Y.-H., Treffers, R. R., & Kwitter, K. B. 1983, ApJS, 53, 937
- Chu (1981) Chu, Y.-H. 1981, ApJ, 249, 195
- Cowie & McKee (1977) Cowie, L. L., & McKee, C. F. 1977, ApJ, 211, 135
- Dalton & Balbus (1993) Dalton, W. W., Balbus, S. A. 1993, ApJ, 404, 625
- García-Segura et al. (1996) García-Segura, G., Langer, N., & Mac Low, M.-M. 1996, A&A, 316, 133 (GLM)
- García-Segura & Mac Low (1995a) García-Segura, G., & Mac Low, M.-M. 1995a, ApJ, 455, 145 (GM)
- García-Segura & Mac Low (1995b) García-Segura, G., & Mac Low, M.-M. 1995b, ApJ, 455, 160
- Gruendl et al. (2003) Gruendl, R. A., Guerrero, M. A., & Chu, Y.-H. 2003, American Astronomical Society Meeting Abstracts, 202,
- Hamann et al. (1994) Hamann, W.-R., Wessolowski, U., & Koesterke, L. 1994, A&A, 281, 184
- Heckathorn et al. (1982) Heckathorn, J. H., Bruhweiler, F. L., & Gull, T. R. 1982, ApJ, 252, 230
- Humphreys (1978) Humphreys, R. M. 1978, ApJS, 38, 309
- Kaastra (1992) Kaastra, J. S. 1992, An X-ray Spectral Code for Optically Thin Plasmas (SRON-Leiden Report) (MEKA)
- Lundström & Stenholm (1980) Lundström, I., & Stenholm, B. 1980, Rep. Obs. Lundt 16
- Marston et al. (1994) Marston, A. P., Chu, Y.-H., García-Segura, G. 1994a, ApJS, 93, 229
- Marston & Meaburn (1988) Marston, A. P. & Meaburn, J. 1988, MNRAS, 235, 391
- Marston et al. (1994) Marston, A. P., Yocum, D. R., García-Segura, G., Chu, Y.-H. 1994b, ApJS, 95, 151
- Mewe et al. (1985) Mewe, R., Gronenschild, E. H. B. M., & van den Oord, G. H. J. 1985, A&A, 62, 197 (MEKA)
- Miller & Chu (1993) Miller, G. J., & Chu, Y.-H. 1993, ApJS, 85, 137
- Moffat & Robert (1994) Moffat, A. F J., & Robert, C. 1994, ApJ, 421, 310
- Morrison & McCammon (1983) Morrison, R., & McCammon, D. 1983, ApJ, 270, 119
- Nugis et al. (1998) Nugis, T., Crowther, P. A., & Willis, A. J. 1998, A&A, 333, 956
- Prinja et al. (1990) Prinja, R. K., Barlow, M. J., & Howarth, I. D. 1990, ApJ, 361, 607 [Erratum: 1991, ApJ, 383, 466]
- Raymond & Smith (1977) Raymond, J. C., & Smith, B. W. 1977, ApJS, 35, 419 (RS)
- Różyczka (1985) Różyczka, M. 1985, A&A, 143, 59
- Smith et al. (1994) Smith, R. C., Chu, Y.-H., Mac Low, M.-M., Oey, M. S., & Klein, U. 1994, AJ, 108, 1266
- Spitzer (1967) Spitzer, L., Jr. 1967, Physics of Fully Ionized Gases
- Tanaka et al. (1994) Tanaka, Y., Inoue, H., & Holt, S. S. 1994, PASJ, 46, L37
- Treffers & Chu (1982) Treffers, R. R., & Chu, Y.-H. 1982, ApJ, 254, 132
- van der Hucht (1992) van der Hucht, K. A. 1992, A&ARv, 4, 123
- Weaver et al. (1977) Weaver, R., McCray, R., Castor, J., Shapiro, P., & Moore, R. 1977, ApJ, 218, 377
- Wendker et al. (1975) Wendker, H. J., Smith, L. F., Israel, F. P., Habing, H. J., Dickel, H. R. 1975, A&A, 42, 173
- Wrigge (1999) Wrigge, M. 1999, A&A, 343, 599 (Paper II)
- Wrigge & Wendker (2002) Wrigge, M., & Wendker, H. J. 2002, A&A, 391, 287 (Paper IV)
- Wrigge et al. (1994) Wrigge, M., Wendker, H. J., & Wisotzki, L. 1994, A&A, 286, 219 (Paper I)


| Region | bbNormalization factor in cgs units. | bbNormalization factor in cgs units. | Observed Flux | Luminosity | |||
|---|---|---|---|---|---|---|---|
| Name | (106 K) | (cm-5) | (106 K) | (cm-5) | (ergs cm-2 s-1) | (ergs s-1) | |
| North | 1.8 | 4.8 | 1.4 | ||||
| South | 1.7 | 5.2 | 2.0 |
| RegionbbThe three concentric elliptical regions are marked in Figure 1, with Ellipse 3 being the innermost region. | bbThe three concentric elliptical regions are marked in Figure 1, with Ellipse 3 being the innermost region. | ccNormalization factor in cgs units. | Observed Flux | Luminosity | |||
|---|---|---|---|---|---|---|---|
| Name | (106 K) | (cm-5) | (106 K) | (cm-5) | (ergs cm-2 s-1) | (ergs s-1) | |
| Ellipse 1 | 1.56 | 9.9 | 2.8 | ||||
| Ellipse 2 | 1.28 | 6.4 | 6.1 | ||||
| Ellipse 3 | 1.23 | 2.3 | 7.6 |
| Parameteraa - mass loss rate; - terminal velocity of the fast stellar wind; - mechanical luminosity of the stellar wind; - bolometric luminosity of the star; - distance to NGC 6888; - average shell radius; - shell expansion velocity; - ionized gas mass; - neutral gas mass. | Value | Unit | Reference |
|---|---|---|---|
| yr-1 | Nugis et al. (1998) | ||
| 1600 | km s-1 | Prinja et al. (1990) | |
| 51037 | ergs s-1 | ||
| 1.61039 | ergs s-1 | van der Hucht (1992) | |
| 1.8 | kpc | Humphreys (1978) | |
| 4 | pc | measured from optical image | |
| 755 | km s-1 | Treffers & Chu (1982) | |
| 5 | Wendker et al. (1975) | ||
| 40 | Marston & Meaburn (1988) |
| Model | Count Rate | ||||
|---|---|---|---|---|---|
| Number | (km s-1) | () | (erg s-1) | (erg s-1) | (cnt s-1) |
| 1 | 75 | 4 | 4.1 | 1.2 | 5.3 |
| 2 | 75 | 40 | 4.1 | 8.7 | |
| 3 | 100 | 4 | 9.7 | 3.6 | 3.4 |
| 4 | 100 | 40 | 9.7 | 2.1 | |
| 5 | 200 | 4 | 7.7 | 3.6 | |
| 6 | 200 | 40 | 7.7 | 1.6 |