Lyman emission from local starburst galaxies and high- objects
We review the history and the current status of the understanding of the processes that regulate Lyman emission from star-forming galaxies. We present some of the most recent results of our study to image local starburst galaxies in the Ly emission line using the Advanced Camera for Surveys on the Hubble Space Telescope. Particular attention is dedicated to our study of the low-metallicity, dust-poor Blue Compact Galaxy ESO 338-IG04. We discuss some of our local observational results with reference to the interpretation of results of high-redshift Ly surveys and recent simulations of the detection properties of high- Ly emitting objects performed by our group.
1 Motivation for Lyman studies – the current status
Naively, one could expect Ly to be the strongest emission line observed from hydrogen recombination nebulae with for case A recombination. The potential importance of this line in tracing galaxy formation and evolution in the high-redshift () was postulated in 1967 when it was predicted that the Ly luminosity could amount to a few percent of the total output. It was later predicted that Ly equivalent widths could exceed 100Å for young, dust-free starbursts .
There are numerous methods by which we can study distant galaxies in the context of astrophysical cosmology. Tracers such as restframe ultraviolet (UV) continuum, supernovae and assorted emission lines are often used to study star-formation rates (SFR), angular correlation functions, galaxy clustering, and reionisation. Each of these tracers may have their own advantages and disadvantages. Rest-frame UV or colour surveys will be biased towards galaxies with the brightest continua. In the hierarchical structure formation model, the more massive, brighter galaxies are built from more numerous but less massive and fainter ones. The small galaxies, that occupy the faint end of the luminosity function will be missed by surveys that target restframe UV continuum. In contrast surveys that target emission lines will not exhibit such a bias. A responsive and frequently used tracer of star-formation in galaxies is the H emission line whose equivalent width in the absence of dust is proportional to the SFR . However the H line is redshifted out of the -band at to a spectral domain crowded by sky-lines, rendering H a sub-optimal tracer of the very distant universe in ground-based surveys. In contrast, one of the main advantages of the Ly line is that it is observable in the optical domain to and in the near infrared to I.e. into the suspected neutral universe, before reionisation.
The first early searches for high- primeval Ly emitters were largely fruitless, finding number densities far lower than predicted . This was apparently confirmed by local Ly studies : Ly emitters were scarce and less luminous than expected when detections were made. The explanation for the absence of Ly galaxies was first thought to be due to resonant scatterings Hi local to the recombination nebulae . Resonant scattering leads to an increased probability of Ly destruction either by interactions with dust grains or the two-photon spontaneous channel. If the absorbing material is static, column densities of cm-2 should be enough to produce damped absorption. While the Ly–metallicity relationship may maintain its validity, there are a number of other complicating factors that surround Ly and recent observations using the Hubble Space Telescope (HST) have shed light on the real complexity of the issue. Eight nearby star-forming galaxies have been studied by members of our group using the Goddard High Resolution Spectrograph (GHRS) on HST : 4 of the sample showed damped absorption, regardless of their dust content (including iZw 18, the most metal-poor galaxy known); while the remaining 4 exhibited clear Ly P-Cygni profiles, characteristic of a large-scale outflow of the absorbing gas. Subsequent HST observations using the Space Telescope Imaging Spectrograph (STIS) have identified large shells of expanding neutral gas covering areas much larger than the starburst. The situation is further complicated by the suggestion that Ly emission from starburst knots could also be geometry-dependent . In this scenario, we could expect to see Ly emission only if we look directly into an ionised cone created by the starburst; observations from other angles should observe neutral hydrogen and Ly absorption. From spectroscopic studies of local starbursts, we can identify several mechanisms by which Ly photons can escape trapping by Hi columns: emission through P-Cygni profiles in which the Hi is outflowing sufficiently to reduce the neutral column density; and escape through a porous medium in which the Hi covering factor is less than unity. Recently, our imaging project (Sect. 2) has also found evidence for escape through Hi regions with column densities great enough to produce damped absorption. Here photons escape by either scattering into the wing of the emission profile or diffusing their way into optically thin regions.
More recently, detections of high- Ly galaxies have become common with narrowband searches yielding many sources . The high- situation with regard to Ly equivalent width is, however, somewhat reversed with surveys finding median of up to 400Å. However if the high- results are to be trusted in the cosmological context, Ly needs to be calibrated and a rigorous understanding of the statistics is required. Moreover, we need to fully understand any observational effects or astrophysical phenomena that can bias such surveys.
2 Ly emission from local starbursts – the imaging approach
Because of the radiative transfer effects involved, the various possible escape mechanisms for Ly photons are highly dependent upon the ISM configuration and an imaging survey with high spatial resolution is essential. This was the motivation for our study to image six local starbursts with the Solar Blind Channel (SBC) of the Advanced Camera for Surveys on HST. In this study (GO program 9470) the F122M filter was used to image Ly and the F140LP for nearby continuum observations, redwards of the line. The flux due to continuum processes at the wavelength of the line was then estimated using the the offline filter combined with various other data. Initially we used the archival V-band images and IUE spectra to map the continuum slope () in the UV to estimate the continuum flux by assuming an unbroken power-law continuum between the offline and online filters. This enabled us to discuss the morphology of Ly in two of our targets: ESO 350-IG38 and SBS 0335-052.
Unfortunately, isolating Ly emission/absorption, present difficulties not normally encountered in narrow band imaging of other spectral lines. Examination of data from another of our targets, ESO 338-IG04, revealed some of the flaws in the method previously assumed . For this galaxy there is much broadband Wide-Field & Planetary Camera 2 (WFPC2) data available, a STIS spectrum of the central regions taken with the G140L grating that covers Ly as well as the UV spectrum taken with the International Ultraviolet Explorer (IUE). We found that when -maps created using the ACS/F140LP and WFPC2/F218W filters were used for the continuum subtraction, the galaxy exhibits Ly in absorption across the entire starburst region. This is in direct contradiction to the STIS spectrum of the same regions; the -map technique caused the subtraction of too much continuum. There are a number of reasons why this simple assumption about may not hold in this case. Firstly, the IUE spectrum of ESO 338-IG04 this target shows that deviates from a single power-law, flattening out at Å. More importantly in this case, the online filter also contains not only redshifted Ly from the target but a damped Galactic absorption feature where the high Hi column density (Hicm) has removed a large fraction of the continuum flux in this filter. Additionally, the presence of discrete stellar Ly absorption or emission features could lead to erroneous conclusions if not accounted for.
Clearly some modelling of the continuum slope was necessary in order to correctly allow for these features. ESO 338-IG04 was the ideal target for this experiment due to the large amount of existing data against which our results can be tested. We define the Continuum Throughput Normalisation (CTN) factor as the factor needed to normalise the flux in offline filter to the wavelength of the emission line. We used the Starburst99 synthetic spectra models to represent the spectra of the target. These models were chosen due to their inclusion of the latest and most appropriate UV stellar atmospheres and cover a large parameter space enabling us to test how our selection of parameters may impact upon our results. We adopted the full age range (1 to 900Myr) of spectra created with Salpeter IMF with , , comprising stellar and nebular components, and created for an instantaneous burst. We obtained the instrument throughput for all the configurations for which data were available from the synphot package of iraf/stsdas. By convolving these curves with various synthetic spectra, we could compute the optical/UV colours and CTN. We adopted the SMC law to simulate internal extinction in ESO 338-IG04, using the range of from 0.0 to 0.4 magnitudes, twice the range previously determined . For various ages and internal reddenings we looked for any relationships between the computed CTN factors and optical/UV colours. The degenerate effects of age and reddening quickly became apparent and no single colour (not even ) could provide a non-degenerate CTN for a given age and reddening. However, for certain pairs of optical/UV colours, the effects of the degeneracy could be disentangled. We determined that to obtain non-degenerate CTNs it is necessary to use one colour to trace the UV continuum, which is very sensitive to reddening, and one colour that traces the 4000Å discontinuity, which is sensitive to age. We used the F140LP–F336W and F336W–F439W colours, respectively and thus created a CTN map which we used to subtract the continuum from the Ly line.
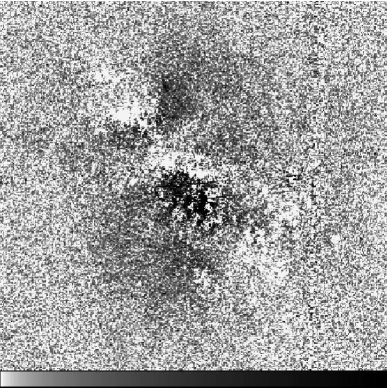
Figure 1 shows the Ly line-only image of ESO 338-IG04. Spatially, the emission and absorption features are now fully in agreement with those in the two-dimensional STIS spectrum. Emission from the bright central star-clusters is the result of outflows in the ISM allowing emission through P-Cygni profiles. In addition, areas of diffuse emission are seen surrounding the central starburst, covering a much larger area than the UV continuum emission.
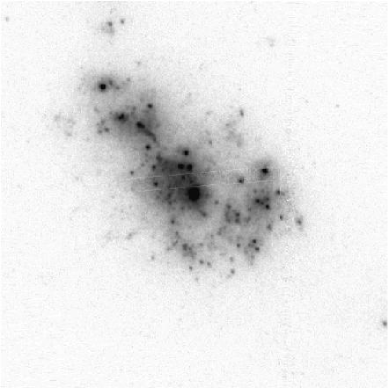
The Ly flux from ESO 338-IG04 has been determined from IUE observations to be erg s-1 cm-2. We masked our Ly line-only image in a ” ellipse centred on the brightest central star cluster which matches the size and shape of the IUE aperture. Summing the flux in this aperture we measured erg s-1 cm-2; fully consistent with the IUE flux within the 10% photometric accuracy of the instrument. This validates the photometric accuracy of our technique.
In the process of selecting the spectra and implementing this method we had made assumptions which may have affected our results. In order to test this, we ran the software with different sets of spectra, comparing pixels in the CTN maps against the original assumed model set, and computing total fluxes in the continuum subtracted images. By plugging in different sets of model spectra, computing additional spectra, and modifying the code, tested the effects of: metallicities; IMFs; reddening laws; varying stellar and nebular contributions; continuous star-formation scenarios; nebular emission lines (Mappings III ); and contributions from additional old stellar populations. However when we modified our assumed setup, we obtainted line-only images that were morphologically indistinguishable by eye. Moreover, when reasonable parameter modifications were made, the Ly fluxes were consistent with the assumed setup to within around 25%, demonstrating that our technique is not highly sensitive to these assumptions.
We compared the total observed Ly flux with the total H flux of erg s-1 cm-2. Of this flux, 87% comes from the regions covered by our ACS observations. Correcting this for Galactic extinction, internal extinction using the SMC law with and assuming case A recombination we arrive at an implicit Ly flux of erg s-1 cm-2. Comparing this to our total observed Ly flux (corrected for Galactic extinction), we determine a global escape fraction of 5%. This escape fraction is an order of magnitude lower than that which would result if internal extinction were the only destruction mechanism of Ly photons (44% for the SMC law with ).
Another important result of our studies is the discovery of the large areas of diffuse emission that surround the starburst region. The net Ly flux from the central regions is in fact negative and, were it not for the diffuse emission regions, ESO 338-IG04 would be a net Ly absorber.
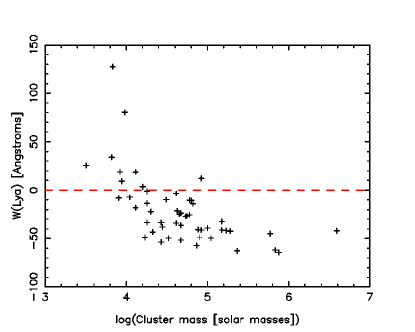
In the analysis of our continuum subtracted image, we compared our study with several other dynamical and kinematic studies. The age, radial distance, mass, colour and luminostiy of compact star-clusters in ESO 338-IG04 were compared with Ly equivalent widths in regions spatially coincident with the clusters in 2D. The only trend found was between and cluster mass or luminosity as can be seen in the left panel of Fig. 2. We have not (yet?) found any evidence supporting the prediction that Ly emission or absorption is function of age. Hi mapping using the VLA reveals column densities sufficient to produce damped absorption in all regions of ESO 338-IG04. Fabry-Perot interferrometry and UVES spectroscopy, however, reveal the perturbed and complex nature of the velocity field. Data are suggestive of either a bipolar outflow or a second kinematical component with centre very close to the central star cluster. The overall outflow velocity is shown to be rather small, indicating that the diffuse Ly emission is probably the result of small-scale (smaller than those resolvable using the VLA) velocity shifts and a clumpy and perturbed medium.
When experimenting with continuum subtraction techniques, we tested the simple assmption of assumed power-law continuum slopes. It is interesting to note that these continuum subtractions produced line-only images that were distinguishable by eye from those produced by our modelling techniques and in conflict with the STIS spectrum. When we assumed a flat continuum we obtained a Ly flux three times greater than that obtained by our modelling and by IUE observations. We would therefore suggest that SED modelling could be a vital for Ly observations at low and high redshifts. We are currently in the process of collecting UV/Optical HST/ACS images for the rest of our sample of local galaxies with available HST Ly images, which will allow a quantitative analysis of the kind that we performed for ESO 338-04.
3 Detection of Ly from high- objects
In an effort to understand the implications and aid the interpretation of Ly observations, we are currently running simulations of how high- (or low-) Ly galaxies appear in narrowband surveys. The aim is to estimate uncertainties on derived Ly fluxes and equivalent widths and any biases that may be introduced by astrophysical phenomena or observational methods. The prescription is simple: build a model restframe SED with a Ly emission or absorption line; redshift the SED; compute deteced fluxes in a variety of filters and subtract the continuum using various commonly employed techniques.
The Starburst99 spectra are used to which Ly features of arbitrary equivalent width can be added. Internal extinction can then be applied with the various extinction laws listed in Sect. 2. The SED is then redshifted, placing the galaxy in the distant universe. The effect of intervening Hi clouds is applied by using random numbers to generate a distribution of clouds in redshift and column density. These column densities are converted into equivalent widths at and applied to the spectra. Perfect rectangular filters are implemented with full widths of 50Å for the narrowband online filter, and 800Å for the broadband continuum filters. The online filter is then placed at the observed wavelength of the Ly in the observed SED under consideration. Three broadband filters are also positioned to measure the continuum: one centred at the observed Ly wavelength; one 500Å redward of Ly; and one 1500Å redward of Ly. ’Observed’ fluxes in these filters are then computed and continuum subtractions are perfomed using three methods: The first is the method used by most Ly searches in which the broadband contiuum filter is centred close to Ly. The second method involves using the nearer offline broadband filter to measure the continuum 500Å redward of Ly and assuming this to represent the continuum flux at the line. Both these methods assume the continuum level to be flat over the used wavelength range. In the third method, we use the flux in the two offline broadband filters and, assuming a continuous power law continuum, extrapolate to obtain the contiuum level at Ly.
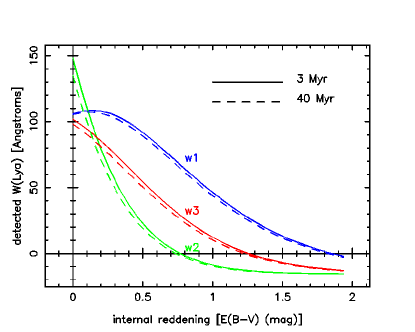
The right panel of Fig. 2 shows effect of internal reddening on the observed of a galaxy at . The restframe SED was built from the ’standard’ setup assumed in our initial studies of ESO 338-IG04 (Sect. 2) with a restframe of 100Å. Burst ages of 4 and 30 Myr were used with the SMC law used to describe internal reddening. It shows how Ly is removed by relatively modest extinction although interestingly it demonstrates how, at very low extinction, is overestimated by commonly used observational techniques. Moreover, we also find some evidence that in these surveys, the mean detected may be artificially increased by up to 20% of its restframe value by the presence of intervening intergalactic clouds. The interpretation for this being that there is a high probability for clouds to remove flux from the blue end of the broadband filter, leaving the line itself unaffected. These results for the high- simulations will be presented in a forthcoming paper (Hayes et al. 2005, in preparation).
References
References
- [1] R.B. Partridge & P.J.E. Peebles ApJ 147, 868 (1967).
- [2] S. Charlot & S.M. Fall ApJ 415, 580 (1993).
- [3] R.C. Kennicutt, P. Tamblyn, & C.W. Congdon ApJ 435, 22 (1994).
- [4] P. Madau, L. Pozzetti, & M. Dickinson ApJ 498, 106 (1998).
- [5] C.J. Pritchet PASP 106, 1052 (1994).
- [6] M. Giavalisco, A. Koratkar, & D. Calzetti ApJ 466, 831 (1996).
- [7] D.A. Neufeld ApJ 370, L85 (1992).
- [8] D. Kunth, J.M. Mas-Hesse, E. Terlevich. et al. A&A 334, 11 (1998).
- [9] J.M. Mas-Hesse, D. Kunth, G. Tenorio-Tagel. et al. ApJ 598, 858 (2003).
- [10] G. Tenorio-Tagel, S.A. Silich, D. Kunth, et al. MNRAS 309, 302 (1999).
- [11] M. Ouchi, Z. Shimasaku, H. Furusawa et al. ApJ 582, 60 (2003).
- [12] S. Malhotra & J.E. Rhoads ApJ 565, 71 (2002).
- [13] J.U. Fynbo, P. Møller, & B. Thomsen A&A 374, 443 (2001).
- [14] D. Kunth, C. Leitherer, J.M. Mas-Hesse et al. ApJ 597, 263 (2003).
- [15] M. Hayes, G. Östlin, J.M. Mas-Hesse et al. A&A , in press (2005).
- [16] C. Leitherer, D. Schaerer, J.D. Doldader et al. ApJS 123, 3 (1999).
- [17] M.L. Prévot, J. Lequeux, L. Prévot, et al. A&A 132, 389 (1984)
- [18] G. Östlin, E. Zackrisson, N. Bergvall, et al. A&A 408, 887 (2003)
- [19] L.J. Kewley, M.A. Dopita, I. Evans, et al. In prep. (2005).
- [20] G. Östlin, P. Amram, N. Bergvall, et al. A&A 374, 800 (2001).
- [21] G. Östlin, P. Amram, J. Masegosa, et al. A&AS 137, 419 (1999).
- [22] D. Cannon, E. Skillman, D. Kunth, et al. ApJ 608, 768 (2004).