A search for very high energy -ray emission from the starburst galaxy NGC 253 with H.E.S.S.
We present the result of 28 hours of observations of the nearby starburst galaxy NGC 253 with the H.E.S.S. detector in 2003. We find no evidence for very high energy -ray emission from this object. Gamma-ray emission above 400 GeV from NGC 253 had been reported by the CANGAROO collaboration in 2002. From the H.E.S.S. data we derive upper limits on the flux above 300 GeV of photons cm-2 s-1 for a point-like source and photons cm-2 s-1 for a source of radius 0.5∘ as reported by CANGAROO, both at a confidence level of 99%. These upper limits are inconsistent with the spectrum reported by CANGAROO. The expected very high energy -ray emission from this object is discussed in the framework of a galactic wind propagation model.
;
Key Words.:
gamma-rays: observations – Galaxies: starburst – Galaxies: individual objects: NGC 2531 Introduction
Starburst galaxies, such as the closest objects of this type, NGC 253 in the Southern and M 82 in the Northern Hemisphere, are known to exhibit enhanced and strongly localised supernova explosion rates in so called ’starburst regions’. In such regions gas and photon densities are very high compared to the situation in normal star forming galaxies like the Milky Way. Given the paradigm of cosmic-ray (CR) acceleration in supernova remnants (SNR), substantially greater CR energy densities (where is the value in our galaxy) are expected in such regions, with corresponding fluxes for -decay -rays alone in the range of photons cm-2 s-1 for an object such as M 82 (Völk et al. Voelk1 (1989)). Later estimates for M 82 (Akyüz et al. Aky (1991); Völk et al. Voelk2 (1996)) are approximately encompassed by this range, which translates into a -ray flux of photons cm-2 s-1 at energies MeV assuming a differential proton energy spectrum .
EGRET observations of NGC 253 (Sreekumar et al. Sreekumar (1994)), the nearest spiral galaxy outside the local group (at distance Mpc), resulted in an upper limit on the integral flux above 100 MeV of photons cm-2 s-1. A reanalysis of these data by Paglione et al. (Paglione (1996)) yielded a consistent limit of photons cm-2 s-1. More complete EGRET data led Blom et al. (Blom (1999)) to revise this upper limit down to photons cm-2 s-1; for M 82 they derive an upper limit of photons cm-2 s-1. Similar upper limits for both NGC 253 and M 82 were obtained in a recent reanalysis of the EGRET data by Cillis et al. (Cillis (2005)). NGC 253 was detected in the hard X-ray band using the OSSE instrument (Bhattacharya et al. OSSE (1994)). From the 4.4 significance detection a flux of erg cm-2 s-1 (50-165 keV) was derived.
At TeV energies, observations of both NGC 253 and M 82 were made by the HEGRA collaboration, but neither object was detected (Götting HEGRA (2005)). For NGC 253 a flux upper limit of photons cm-2 s-1 at 99% confidence was derived from 32.5 hours of live time. For M 82 the corresponding limit was photons cm-2 s-1 from 43.9 hours of live time. The report of very high energy (VHE, used here as 0.1 TeV – 10 TeV) -ray emission from NGC 253 by the CANGAROO collaboration (Itoh et al. CANGAROODetection (2002)) marked the first claim of -ray emission from a starburst galaxy. The differential energy spectrum (Itoh et al. 2003b ) can be described by: cm-2 s-1 TeV-1, with a corresponding flux above 400 GeV of cm-2 s-1, or % of the flux of the Crab Nebula above the same threshold. The emission reported by CANGAROO is extended with an rms angular size estimated as 0.3–0.6∘, somewhat larger than the optical size of the galaxy (28′ 7′).
Further evidence for particle acceleration in NGC 253, at lower photon energies, exists mainly in the form of radio data. Radio synchrotron observations show an extended, quasi-spherical halo, rising to at least 9 kpc above the disk (Carilli et al. Carilli (1992)), with a morphology that suggests a gas outflow from the disk, carrying with it magnetic fields and radiating electrons. Such an outflow should be characteristic for starburst galaxies. It has been studied in detail in thermal soft X-rays (e.g. Dahlem et al. Dahlem (1998), Strickland et al. Strick1 (2000), 2002a , 2002b ) and interpreted in terms of ”superwinds“. The observed X-ray emission shows a good correlation with optical line and radio continuum observations over the same region. From general considerations of particle acceleration, it seems likely that accelerated nuclear particles are also present and contribute to driving the wind. The CANGAROO detection has been interpreted as inverse Compton emission, implying the existence of an extended halo of multi-TeV CR electrons around NGC 253 (Itoh et al. CANGAROOHalo (2003)). A cold dark matter (CDM) annihilation interpretation was also discussed (Enomoto et al. Enomoto (2003)).
The detection of NGC 253 by CANGAROO, along with the theoretical expectation of very high energy -rays from starburst galaxies, motivated the observation of this object with the High Energy Stereoscopic System (H.E.S.S. ). H.E.S.S. is an array of four 13 m diameter telescopes, each equipped with 960 pixel (5∘ field-of-view) cameras (Hinton HESSProject (2004)). Commissioning of the array in Namibia (at 1800 m above sea level) began in 2002 and the array was completed in December 2003. The optical system of the H.E.S.S. telescopes is described in detail by Bernlöhr et al. (HESSOptics (2003)) and Cornils et al. (HESSOptics2 (2003)), the trigger system by Funk et al. (HESSTrigger (2004)) and the camera electronics by Vincent et al. (HESSCamera (2003)). Observations of NGC 253, made during 2003 with H.E.S.S. , are presented here.
2 H.E.S.S. Observations
Observations of NGC 253 were made during the construction of the H.E.S.S. array. In August and September 2003, 30 hours of data were taken with two telescopes in operation. In October 2003 a further 8 hours of 3-telescope data were taken. After run quality selection (primarily to discard data compromised by unstable weather conditions) and dead time correction, datasets of 24.6 hours (August/September) and 3.4 hours (October) remain. The mean zenith angle of observations was 14∘. Only events where at least two telescopes provided shower images were used in this analysis to enable stereoscopic reconstruction. Data were taken in wobble mode, with the target source offset by 0.5∘ from the tracking position of the telescopes. The energy threshold for this dataset is 190 GeV. Two independent analysis methods have been applied to search for -ray emission in this dataset.
2.1 Analysis Method 1
The standard calibration and analysis used for H.E.S.S. is described in detail in (Aharonian et al. HESS2155 (2005); Aharonian et al. HESSCalib (2004)) and is referred to here as Analysis 1. Following calibration, tail-cuts image cleaning and image moment analysis (Hillas parameter determination) were used to characterise each telescope image. Shower direction reconstruction was made based on the intersection of the major axes of the individual telescope images. The angular resolution (defined by the radius containing 68% of the reconstructed events from a point-source) is 0.14∘ for the two telescope data set and 0.12∘ for three telescopes. The primary -ray energy is estimated (with a resolution of 15%) using the total image size in each telescope and the reconstructed shower core position. The mean reduced scaled width and length of shower images are used to select -ray candidate events.
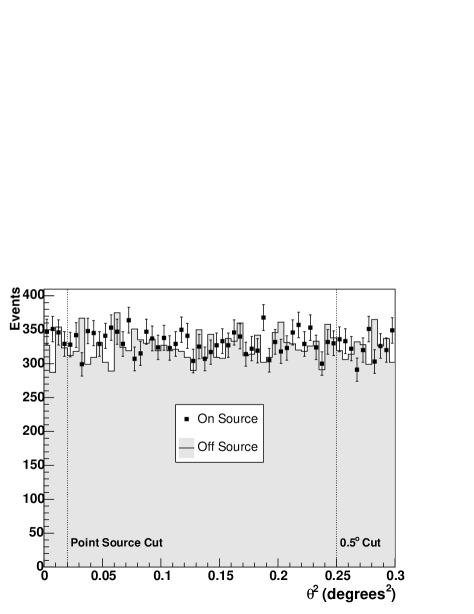
Given that the observations were taken in wobble-mode, the position 0.5∘ from the tracking position on the opposite side of the field of view (FOV) can be used for a simultaneous background measurement. Figure 1 shows the distribution of squared angular distance () of candidate -rays from the centre of NGC 253 for the combined 2- and 3-telescope data sets. The distributions for the on-source and background measurements are consistent; no evidence for a -ray signal is seen. The vertical dashed lines in this figure indicate the positions of the standard H.E.S.S. -ray selection cut for point-like sources () and a much wider cut (at 0.5∘) at the approximate extent reported by the CANGAROO collaboration.

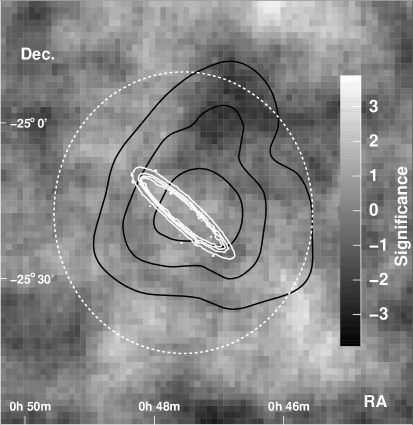
To enable 2-dimensional mapping of the FOV a different background model is applied. The upper panel of figure 2 shows the significance of a point-like excess in the FOV of NGC 253 using a ring (of 0.5∘ radius) around each position to provide a background estimate (a correction for the radial acceptance function of the instrument is made in this case). The distribution of significance within the FOV is consistent with random fluctuations of the background.
2.2 Analysis Method 2
An independent analysis method for the H.E.S.S. data (Lemoine-Goumard et al. 2004a , Analysis 2) has been used to confirm this result. This analysis employs not only different reconstruction and background reduction methods but also an independent detector calibration (Aharonian et al. HESSCalib (2004)). The reconstruction method is based on a simple 3D-modeling of an electromagnetic shower assuming rotational symmetry. For each event eight parameters are reconstructed: the direction of the shower in the reference frame of the telescope, the core position on the ground, the altitude of shower maximum, the total number of emitted Cherenkov photons, and the longitudinal and transverse standard deviations of the Gaussian distributions, referred to as “3D-length” and “3D-width”, respectively. In this method the 3D-width is the most efficient and robust parameter to discriminate -ray showers from the hadronic background.
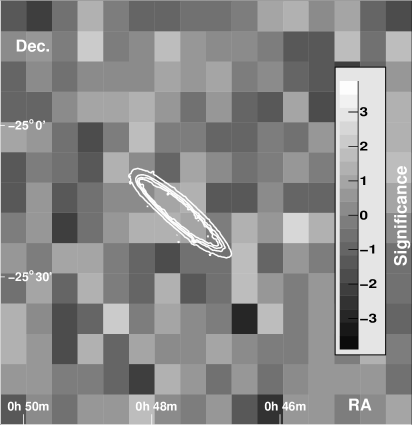
The background subtraction is performed independently in each bin of the FOV using a maximum likelihood method (Lemoine-Goumard et al. 2004b ) based on the knowledge of the 3D-width distributions of -rays and background events, respectively. The -ray width distribution is determined via Monte-Carlo simulations and checked on data from known point-like sources; the distribution for background events is obtained from a FOV in the same zenith angle range with no detected sources. The dependence of these distributions on the bin position in the FOV is taken into account. The method yields two independent sky maps, one for -rays and the other for background events. In contrast to Analysis 1, this method makes no a priori assumption of azimuthal symmetry in the structure of the background. Furthermore, the -ray contents of different bins are statistically independent. This method was applied to the same data sets as for the analysis presented above; the significance map for -rays, shown in the lower panel of Figure 2, is again compatible with the absence of a signal in the whole FOV.
2.3 Flux Upper Limits
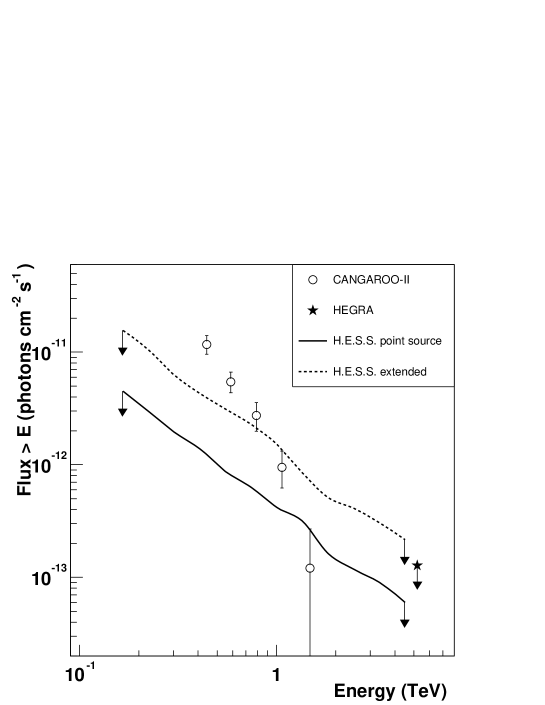
Figure 3 shows integral flux upper limits calculated assuming a spectrum of photon index -3.85 (as reported by CANGAROO) and following the method of Feldman & Cousins (FeldmanCousins (1998)). Flux limits are shown for point-like and extended emission ( radius) for Analysis 2. Also shown are CANGAROO-II integral data points derived from the differential spectrum given by Itoh et al. (2003b ). Above 300 GeV we derive 99% confidence flux upper limits of photons cm-2 s-1 for a point-like source and photons cm-2 s-1 for a source of radius 0.5∘. The upper limit curves derived from Analysis 1 are rather similar in shape and have slightly higher values at 300 GeV: photons cm-2 s-1 photons cm-2 s-1 (point source) and photons cm-2 s-1 (0.5∘).
The non-detection of this object cannot be attributed to a mis-pointing of the instrument. The systematic error in the pointing error of H.E.S.S. during 2003 was (Gillessen et al. Gillessen (2003)). Moreover, the correct pointing of the instrument for this particular dataset has been independently confirmed using the currents induced by stars in the FOV in the photomultiplier-tube camera. The limit on the mis-pointing derived from this method is .
3 Discussion
Given the strong signal from NGC 253 reported by the CANGAROO collaboration, the non-detection of this object with H.E.S.S. is surprising. As the source reported by Itoh et al. (2003b ) is extended in nature, time-variability of the -ray emission cannot be invoked to solve the apparent contradiction between the H.E.S.S. and the CANGAROO results. In this situation it is instructive to review the expectations for -ray emission from this object.
The speculative possibility of detectable -ray emission from Dark Matter annihilation in the halo of NGC 253 is discussed in detail in Enomoto et al. (Enomoto (2003)). We concur with the view of these authors that such a scenario cannot produce VHE -rays with fluxes detectable with current instruments. The standard picture of -ray production via CR interactions seems more plausible given the rapidly growing knowledge about this object in other wavelength ranges, principly in terms of supernova explosion rates and the total gas mass in the starburst region. The relevant CR interactions are: i) inelastic collisions of relativistic nuclei with thermal gas nuclei producing mesons which decay into -rays ii) Inverse Compton (IC) collisions of relativistic electrons with ambient low-energy photons iii) Bremstrahlung collisions of such electrons with gas nuclei. The -ray flux from these processes is proportional to the density of these relativistic particles (CRs). The CR density is determined by the strength of their accelerators in the SB region, their propagation modes, and their energy losses. In particular, propagation of CRs via convection in the SB wind is a key process that is usually not considered for our own galaxy. In addition, the nature of particle diffusion in the SB is likely modified by non-linear effects induced by the CRs themselves.
A self-consistant picture for the -ray production is discussed below. It turns out that the strong localisation of CR production and the high gas mass of the SB region lead to a rather simple prediction for the VHE -ray flux, independant of the further details of the SB configuration.
3.1 Starburst parameters for NGC 253
The enhanced CR density and the very high gas and photon densities in the starburst (SB) regions are related to each other: the high gas densities are necessary for the high star formation rate which produces massive stars of high photon luminosity. Their subsequent supernova (SN) explosions heat the gas and generate CRs. Together the heating of the gas and the high CR density drive a mass outflow in the form of a galactic wind.
NGC 253 has a central SB region which is very bright in radio, far infrared, and X-ray frequencies. Following Weaver et al. (Weaver (2002)) we assume it to be a cylinder of radius pc and height pc in the plane of the galaxy, with an outflow that is collimated by a massive molecular torus into the vertical direction, perpendicular to the disk. The outflow velocity is not very well known, with “minimum reasonable values between 300 and 600 km s-1” (Strickland et al. 2002a ). However, values for the outflowing SN ejecta as high as 3000 km s-1 are considered possible. For the purposes of our estimates we assume here km s-1.
The volume of the SB region is then pc3. The SN rate in this small nuclear volume is estimated as yr-1, about as high as that of our entire Galaxy (cf. Engelbracht et al. Engelbracht (1998)), but values as high as 0.08 yr-1 have also been estimated (van Buren & Greenhouse vanBuren (1994); Paglione et al. Paglione (1996)). The rest of the galaxy is thought to have a SN rate of the same magnitude, distributed over the disk. The total (dominantly molecular) mass in the nuclear region is rather uncertain: (Mauersberger et al. Mauersberger (1996), Engelbracht et al. Engelbracht (1998)). We assume which corresponds to the preferred value of Engelbracht et al. (Engelbracht (1998)) and gives a density of 580 protons cm-3 in the nuclear region.
3.2 Transport of VHE particles
The non-thermal properties of such an SB system are quite complex, as the very extended radio synchrotron emission shows. This radio emission is intimately connected to the large expanding halo in thermal X-rays and optical -line photons. Nevertheless, the TeV -ray emission can be discussed in a fairly straightforward manner. For this purpose, let us assume that particle diffusion can be calculated from the theory of the wind from our Galaxy (Ptuskin et al. Ptuskin (1997)), scaled to the SB parameters of NGC 253. We point out that in the theory of Ptuskin et al. the diffusion coefficient in the Galactic wind is assumed to be due to Alfvén waves, excited by the particles themselves, as they stream away from their sources in the disk. The wave amplitudes are limited by nonlinear wave damping on the thermal wind plasma.
To estimate the spatial extent and magnitude of the -ray emission as a result of the SB, we first consider the time scales for energetic particle transport and their collisional/radiative energy losses. For protons the convection time yr, whereas the loss time in the nuclear region due to inelastic collisions with nuclei of the gas amounts to yr.
The diffusion vertically to the disk is given by the diffusion coefficient , where above a few GeV is consistent with the mean matter thickness traversed by the CRs in our Galaxy (and its rigidity dependance), before they are ultimately convected away into extragalactic space (Ptuskin et al. Ptuskin (1997)) 111In our galaxy for 15 kpc where is the height above the disk, The distance within which the energetic particles can diffusively return to the disk to produce secondaries is given by (the diffusion-convection boundary). Thus for our galaxy. The probability for a particle to cross the disk, and thus the mean matter thickness traversed by particles of energy is inversely proportional to .. In this scaling relation (CR source surface area) denotes the spatial energy flux density of CRs released into the SB region. In detail, , where is the CR source power density, as a function of particle momentum , per unit surface area of the source region. As we shall see, in this case is smaller than both and (which is defined below). This results in an upper limit for the -ray emission from NGC 253 for a given energy input into CRs.
To determine for NGC 253 we note that the cylindrical SB region has a radius of 150 pc, according to the above model, whereas the corresponding region of our Galaxy, the disk, has a radius of 15 kpc. Therefore, assuming yr-1 in the SB as in the Milky Way, yields . For the magnetic field in the SB region we chose G, where G corresponds to the equipartition value derived by Weaver et al. (Weaver (2002)) which we consider the maximum possible field in the SB region. With a Galactic field strength G this massive CR production reduces the diffusion coefficient to . The corresponding diffusion time yr for a 1 TeV particle also exceeds . This means that CR protons with energies up to about 1 TeV behave calorimetrically: i.e. they lose all their energy by inelastic collisions before being able to leave the SB region. However, the increase of with particle energy makes the particles with energies above several TeV diffusion dominated, which implies that they escape the SB region before interacting. The turnover point is at -ray energies of a few hundred GeV.
For TeV electrons the loss time is estimated as follows: the enormous far infrared (FIR) SB-luminosity deduced by Engelbracht et al. (Engelbracht (1998)) implies a radiation energy density eV cm-3. This leads to an inverse Compton (IC) loss time yr for the electrons of energy TeV that produce 1 TeV -rays. The IC scattering is here considered in the Thomson limit which applies for FIR target photons. Therefore, comparing with the proton emission, the SB region acts even more calorimeterically for the emission of TeV -rays via IC scattering.
3.3 VHE -ray emission
The hadronic -ray emission in this scenario simply corresponds to the total amount of CR energy created. The -ray energy spectrum corresponds to that of the SNR sources, assumed here to be . In this picture diffusion is irrelevant below a few TeV, and the total CR energy in the SB region amounts to
| (1) |
where , and is the CR energy production efficiency for an average SN event with a mechanical energy release . The CR energy density amounts to eV cm-3. This has to be compared to the Galactic value eV cm-3. Assuming the radiating TeV particles to freely penetrate the gas in and around their sources – a premise which would become more and more questionable at lower energies on account of the shorter scattering mean free path – the energy spectrum of the hadronic -ray flux can be calculated from the following relation (cf. Völk et al. Voelk2 (1996)):
| (2) |
Substituting our preferred values for , , and , as calculated above, we obtain photons cm-2 s-1 up to a few hundred GeV, and significantly falling off at higher -ray energies. The factor denotes the uncertainty of the assumed parameters, mainly , , and . Assuming that and the average = erg, we obtain .
As long as we have . Since , (where ) then becomes independent of , , and , and is only proportional to the energy input per SN explosion and the SN rate , apart from the geometrical factor . This is the consequence of the calorimetric behaviour of the system.
The CR electron energy produced in the SNR sources of the SB can be assumed to amount to no more than a fraction of the energy generated in nuclear CR particles, as is the case in our galaxy. The contribution of IC scattering to the -ray emission in the VHE region can therefore be safely disregarded. The above hadronic flux value, with =1, is similar to – in fact somewhat larger than – the H.E.S.S. upper limit for the VHE -ray flux. At the most relevant energy of about 200 GeV the predicted flux is about a factor of 3 larger than the H.E.S.S. limit for an assumed point source. This demonstrates the physical relevance of the H.E.S.S. upper limit measurement.
Our discussion rests on the assumption that the propagation properties of energetic particles in our own Galaxy and its halo can be scaled to the SB parameters of NGC 253. If this assumption does not hold, then some fraction of the accelerated particles will escape the galaxy before radiating, and the predicted -ray flux from NGC 253 will decrease relative to the estimate given here.
The emission from the rest of the galaxy may be spatially extended. However, assuming a situation roughly equal to that of the Milky Way, where the amount of matter traversed by a TeV particle corresponds to less than 1.5% of the hadronic interaction length, the majority of the protons will escape and will not transfer their energy to -rays. Therefore their total -ray emission is substantially smaller than that from the SB region. The IC -ray flux from the associated electrons is still negligible compared to the CANGAROO flux.
This scenario leads to the prediction that VHE -ray emission from the SB in NGC 253 will be highly localised, with an extent of less than 30 arcseconds. Such emission would appear point-like for current VHE -ray instruments. As discussed earlier, extended emission from the galaxy as a whole is expected to be rather faint in comparison to the flux reported by the CANGAROO collaboration. In addition the expected spectrum should be rather hard as discussed earlier, again in contrast to the reported CANGAROO spectrum.
4 Conclusions
The recently completed H.E.S.S. instrument is currently the most sensitive detector of -rays at VHE energies. The non-detection of NGC 253 by H.E.S.S. is surprising given the rather high flux previously claimed by Itoh et al. (CANGAROODetection (2002)). From theoretical considerations of -ray production in starburst galaxies it appears that the H.E.S.S. limit is close to the expected flux from the NGC 253 starburst, already excluding extreme parameter values (). However, a diffusive transport away from the starburst region that is faster than assumed here cannot be excluded experimentally. The possible -ray flux would then be correspondingly reduced.
It also seems likely that VHE -ray emission from NGC 253 should be rather localised (indeed point-like for current detectors), given the characteristics of the starburst measured at other wavelengths. A hard -ray photon index () would also be expected.
Despite this non-detection, NGC 253 remains one of the most promising starburst galaxies for detection in very high energy -rays. The likely calorimetric character of this system makes deeper observations an interesting proposition.
Acknowledgements
The support of the Namibian authorities and of the University of Namibia in facilitating the construction and operation of H.E.S.S. is gratefully acknowledged, as is the support by the German Ministry for Education and Research (BMBF), the Max Planck Society, the French Ministry for Research, the CNRS-IN2P3 and the Astroparticle Interdisciplinary Programme of the CNRS, the U.K. Particle Physics and Astronomy Research Council (PPARC), the IPNP of the Charles University, the South African Department of Science and Technology and National Research Foundation, and by the University of Namibia. We appreciate the excellent work of the technical support staff in Berlin, Durham, Hamburg, Heidelberg, Palaiseau, Paris, Saclay, and in Namibia in the construction and operation of the equipment. We thank V.N. Zirakashvili for discussions regarding the transport properties of starburst galaxies.
References
- (1) Aharonian, F. et al. (H.E.S.S. Collaboration), 2004, Astropart. Phys., 22, 109
- (2) Aharonian, F. et al. (H.E.S.S. Collaboration), 2005, A&A, 430, 865
- (3) Akyüz, A., Broulliet, N., Özel, M.E., 1991, A&A, 248, 419
- (4) Bhattacharya, D., et al., 1994, ApJ, 437, 173
- (5) Bernlöhr, K., Carrol, O., Cornils, R., et al. 2003, APh., 20, 111
- (6) Blom, J.J., Paglione, T.A.D., Carraninana, A., 1999, ApJ, 516, 744
- (7) Cillis, A.N., Torres, D.F., Reimer, 0., 2005, ApJ, 621, 139
- (8) Carilli, C.L., Holdaway, M.A., Ho, P.T.P., et al., 1992, ApJ, 399, L59
- (9) Cornils, R., Gillessen, S., Jung, I. et al., 2003, APh., 20, 129
- (10) Dahlem, M., Weaver, K.A., Heckman, T.M., 1998, ApJS, 118, 401
- (11) Engelbracht, C.W., Rieke, M.J., Rieke, G.H. et al., 1998, ApJ, 505, 639
- (12) Enomoto, R., Yoshida, T., Yanagita, S., Itoh, C. et al., 2003, ApJ, 596, 216
- (13) Feldman, G.J. & Cousins, R.D., 1998, Phys. Rev. D, 57, 7
- (14) Funk, S., Hermann, G., Hinton, J., et al, 2004, Astropart. Phys. 22, 285
- (15) Gillessen, S., for the H.E.S.S. collaboration, 2003, Proc. 28th ICRC, Tsukuba, Univ. Academy Press, Tokyo, p. 2899
- (16) Götting, N., 2005, PhD thesis, in preparation
- (17) Hinton, J.A. (H.E.S.S. Collaboration), 2004, New Astron. Rev., 48, 331
- (18) Itoh, C., Enomoto, R., Yanagita, S. et al., 2002, A&A, 396, L1
- (19) Itoh, C., Enomoto, R., Yanagita S., Yoshida, T., Tsuru, T. G., 2003, ApJ, 584, L65
- (20) Itoh, C., Enomoto, R., Yanagita, S. et al., 2003b, A&A, 402, 443
- (21) Lemoine-Goumard, M., et al, 2004a, Proc. HDGS, Heidelberg, p703
- (22) Lemoine-Goumard, M., et al, 2004b, Proc. HDGS, Heidelberg, p697
- (23) Mauersberger, R., Henkel, C., Wielebinski, R. et al., 1996, A&A, 305, 421
- (24) Paglione, T.A.D., Marscher, A.P., Jackson, J.M., et al., 1996, ApJ, 460, 295
- (25) Ptuskin, V.S., Völk, H.J., Zirakashvili, V.N., Breitschwerdt, D., 1997, A&A, 321, 434
- (26) Sreekumar, P., Bertsch, D.L., Dingus, B.L., et al., 1994, ApJ., 426, 105
- (27) Strickland, D.K., Heckman, T.M., Weaver, K.A., et al., 2000, ApJ, 120, 2965
- (28) Strickland, D.K., Heckman, T.M., Weaver, K.A., et al., 2002a, ApJ, 568, 689
- (29) Strickland, D.K., Heckman, T.M., Colbert, E.J.M., et al., 2002b, ApJ, 606, 829
- (30) STScI Digitized Sky Survey, http://stdatu.stsci.edu/
- (31) van Buren, D., Greenhouse, M.A., 1994, ApJ, 431, 640
- (32) Vincent P., Denance J.-P., Huppert J.-F., et al. 2003, Proc. 28th ICRC, Tsukuba, Univ. Academy Press, Tokyo, p. 2887
- (33) Völk, H.J., Klein, U., Wielebinski, R., 1989, Astron. Astrophys., 213, L12
- (34) Völk, H.J., Aharonian, F.A., Breitschwerdt, D., 1996, Space Sci. Rev., 75, 279
- (35) Weaver, K.A., Heckman, T.M., Strickland, D.K., Dahlem, M., 2002, ApJ, 576, L 19