XMM-Newton spectral properties of the Ultraluminous IRAS Galaxy Mrk 273
We present a 23 ks XMM-Newton observation of the Ultraluminous Infrared Galaxy (ULIRG) Mrk 273. The hard X–ray spectrum can be modeled by a highly absorbed ( cm-2) power law plus an Fe K emission line. The iron line (detected at more than 99% c.l.) is broad ( keV), suggesting possible superposition of a neutral iron line at 6.4 keV, and a blend of ionized iron lines from Fe XXV and Fe XXVI. Given the relatively short exposure, the three line components can not be singularly resolved with high statistical significance: the neutral component is detected at and the Fe XXV line at c.l., while for the Fe XXVI line we can only estimate an upper limit. The broad band spectrum requires, in addition to a highly absorbed power law, at least three collisionally ionized plasma components, which may be associated with star–forming regions. The temperatures of the three plasmas are about 0.3, 0.8 and 6 keV, where the highest of the three is sufficient to produce ionized iron emission lines. An alternative interpretation for the origin of the soft emission might also be given in terms of reflection off some photoionized gas, as has been observed in a number of nearby Compton–thick Seyfert 2 galaxies (e.g. NGC 1068, Circinus, Mrk 3, NGC 4945). A hot gas, photoionized by the primary, continuum can also produce ionized iron lines. Unfortunately, given the limited statistics and the lack of high resolution spectroscopy, it is not possible to distinguish between the two models investigated. We further compare the XMM-Newton findings with the Chandra data obtaining consistent spectral results. The absorption corrected hard X–ray luminosity of Mrk 273 is erg s-1, corresponding to % of the far–IR luminosity, similar to typical values found in pure starbursts. The thermal contribution to the soft X–ray luminosity is approximately erg s-1, comparable to those found in NGC 6240 and other starburst dominated ULIRGs. We also analyze the XMM-Newton spectrum of Mrk 273x, an unabsorbed Seyfert 2 galaxy at redshift , which lies in the field of view of Mrk 273.
Key Words.:
galaxies: individual: Mrk 273 - galaxies: individual: Mrk 273x - galaxies: Seyfert - X-rays: galaxies1 Introduction
The InfraRed Astronomical Satellite (IRAS) has detected a very large number of galaxies in the local universe () which exhibit extraordinarily high infrared luminosity ( for ; see Sanders & Mirabel 1996 for a review). The number density of these so called Ultraluminous InfraRed Galaxies (ULIRGs) exceeds that of optically selected Seyfert galaxies and QSOs with comparable bolometric luminosities (Soifer et al. 1987; Sanders et al. 1988a, b; Sanders & Mirabel 1996) by a factor of (Sanders et al. 1999). The bulk of luminosity in these sources is infrared (IR) emission from warm dust. Only two dust-heating mechanisms are capable of producing such an extraordinary IR luminosity: one involves the presence of a strong starburst region, and the other a dust–enshrouded AGN. However it is still not clear what the relative contribution of each component to their bolometric luminosity should be.
Spectroscopic surveys of samples of ULIRGs carried out with the Infrared Space Observatory (ISO) have revealed that about 80% of such objects are predominantly powered by star formation, but the fraction of AGN–powered objects increases with luminosity (Genzel et al. 1998; Lutz et al. 1998).
X–ray observations are a fundamental tool to probe the highly obscured innermost regions of these objects, and therefore potentially unveil the physical processes at work. In fact a considerable portion of ULIRGs has been found to contain a hard X–ray source, highly absorbed by a molecular torus, which indicates the presence of a hidden AGN (Mitsuda 1995; Brandt et al. 1997; Kii et al. 1997; Vignati et al. 1999; Ptak et al. 2003; Braito et al. 2003; Franceschini et al. 2003).
Mrk 273 is a well studied ULIRG at a redshift with a Seyfert 2 nucleus (Koski 1978; Sanders et al. 1988a). It presents evidences for strong star formation (Goldader et al. 1995), such as strong Polycylic Aromatic Hydrocarbons (PAH) features in the near–IR (Genzel et al. 1998) and extended ( pc) radio emission, punctuated by a number of compact sources identifiable as supernovae or supernova remnants (Carilli & Taylor 2000; Bondi et al. 2005). Like many ULIRGs, Mrk 273 presents clear indication of an ongoing merging process such as a long tidal tail and a double nucleus (Knapen et al. 1997; Soifer et al. 2000; Carilli & Taylor 2000).
ASCA X–ray observations of Mrk 273 showed evidence for a highly absorbed ( cm-2) hard component above about 3 keV together with soft thermal emission (Turner et al. 1997, 1998; Iwasawa 1999). These findings were indeed confirmed by Chandra, which revealed a compact hard X–ray nucleus inside a much more extended soft halo (Xia et al. 2002, hereafter Paper I).
In this paper we will discuss the analysis of the XMM-Newton data of Mrk 273 and compare them with the previous Chandra observation (Paper I). The data analysis and details of the XMM-Newton observation are described in Section 2, together with our updated reduction of the Chandra data. In Section 3 the spectral fitting results are presented. A comparison with the Chandra observation is given in Section 4. Our results are then discussed in Section 5 and a summary of the XMM-Newton results on Mrk 273 is given in Section 6. In Appendix A we discuss the XMM-Newton spectrum of Mrk 273x, an unabsorbed Seyfert 2 observed serendipitously in the field of view of Mrk 273.
Throughout this paper we use the following cosmological parameters: km s-1 Mpc-1, and . Within the adopted cosmology corresponds to 0.75 kpc at the redshift of Mrk 273.
2 Observations and Data Reduction
2.1 XMM-Newton
Mrk 273 was observed with XMM-Newton (Jansen et al. 2001) for ks on 2002 May 07 (revolution 0441). During this time the EPIC–PN (Strüder et al. 2001) and MOS (MOS1 and MOS2; Turner et al. 2001) cameras, as well as the Optical Monitor (OM; Mason et al. 2001) and the Reflection Grating Spectrometers (RGS1 and RGS2; den Herder et al. 2001) collected data. The EPIC–PN and MOS cameras were operated in full-frame mode and utilized the thick filter.
The Observation Data Files were processed to produce calibrated event lists using the XMM-Newton Science Analysis System (SAS v6.1.0). Unwanted hot, dead, or flickering pixels were removed as were events due to electronic noise. Event energies were corrected for charge-transfer losses, and EPIC response matrices were generated using the SAS tasks ARFGEN and RMFGEN. Light curves were extracted from these event lists to search for periods of high background flaring. Background flaring was negligible. The total good exposure times selected for the PN and MOS were 18 and 22 ks, respectively.
The source plus background photons were extracted from a circular region with a radius of 50′′, and the background was selected from an off-source region with a radius of 70′′ and appropriately scaled to the source region. Single and double events were selected for the PN detector, and single-quadruple events were selected for the MOS. The resulting PHA files were grouped with a minimum of 20 counts per bin. Pile-up effects were determined to be negligible.
The RGS were operated in standard Spectro+Q mode. The first-order RGS spectra were extracted using the SAS task RGSPROC, and the response matrices were generated using RGSRMFGEN. Unfortunately, due to the low signal-to-noise the RGS data were not fruitful.
The OM was operated in imaging mode for the entire observation. Fourteen images were taken in three filters: 5 in ( nm), 9 in ( nm), and 1 in ( nm). The average exposure time (800 s) was short for such a faint source and magnitudes could not be calculated for all images. The average apparent magnitude in each filter was , , and , somewhat larger than the ground–based measured U ( nm) magnitude for the whole galaxy (Surace & Sanders 2000), but not inconsistent when accounting for the different aperture sizes used.
2.2 Chandra
observed Mrk 273 on April 2000 with the Advanced CCD Imaging Spectrometer (ACIS-S3 Back Illuminated chip) for about 47 ks. The data relevant to this observation were already published in Paper I, where they were processed following the Standard Data Processing available at that time (R4CU5UPD13.2, January 2001).
Here, data are reprocessed using much more recent versions of the Chandra Interactive Analysis of Observations software (CIAO 3.2) and Chandra Calibration Database (CALDB 3.0.0). The most effective improvements introduced concern the more accurate background subtraction and more careful computation of the effective areas and response matrices.
We start processing data from the level=1 event file. We apply the recently released, time–dependent gain correction111http://asc.harvard.edu/ciao/threads/acistimegain/, which is necessary to adjust the “effective gains”, which have been drifting with time due to increasing charge transfer inefficiency. Since the observation was taken in the VFAINT mode, we run the tool acis_process_events to flag probable background events using all the information of the pulse heights in a event island to help distinguishing between good X–ray events and bad events that are most likely associated with cosmic rays. With this procedure, the ACIS particle background can be reduced significantly compared to the standard grade selection222http://asc.harvard.edu/cal/Links/Acis/acis/Cal_prods/vfbkgrnd/. Real X–ray photons are practically not affected by such cleaning (only about 2% of them are rejected, independently of the energy band, provided there is no pileup).
The data are filtered to include only the standard event grades 0, 2, 3, 4 and 6. We finally filter time intervals with high background by performing a 3 clipping of the background level using the script analyze_ltcrv333http://cxc.harvard.edu /ciao/threads/filter_ltcrv/. This yield an effective exposure time of about 43 ks for the ACIS–S3 chip in the energy range keV.
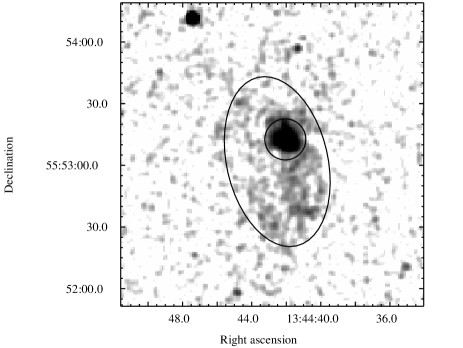
As in Paper I, we separate the spectral analysis of the nuclear emission from the extended soft X–ray halo. The spectrum of the nuclear region of the source is extracted from a circular region of radius centered at the peak of the hard X–ray emission, while, for the extended soft halo, we choose the region lying between the inner circle and the ellipse shown in Figure 1 in order to have the best possible signal–to–noise ratio.
We use the events included in each of the extraction regions defined above to produce a spectrum (PHA) file, which we grouped with a minimum of 20 counts per bin, unless otherwise specified. The background is obtained from a source free circular region of radius located on the same chip. The background file is then scaled to the source file by the ratio of the geometrical area. The response matrices and the ancillary response matrices of each spectrum are computed with acisspec for the same regions from which the spectra are extracted.
The X–ray spectral analysis has been performed using Xspec version 11.3.1.
The reported errors on model parameters are at the 90% confidence level for one interesting parameter ().
| Instrument | Extraction | Energy | Net Number |
|---|---|---|---|
| Region | [keV] | of Counts | |
| XMM-Newton | |||
| PN | |||
| MOS 1 | |||
| MOS 2 | |||
| Chandra | |||
| ACIS-S | |||
| ACIS-S | ellipse |
3 Spectral Analysis
In Table LABEL:counts we give a comparison between the XMM-Newton and Chandra data sets. The Chandra ACIS-S spectrum of the nuclear region (inner ) of Mrk 273 is dominated by the background above 8 keV, while the spectrum of the extended soft X–ray halo is source dominated only between 0.5 and 0.9 keV. Both the EPIC–PN and the two MOS spectra are source dominated between 0.3 and 10 keV, therefore the entire energy range can be analyzed with relatively good signal–to–noise. XMM-Newton therefore provides some further constraints on the shape of the continuum between 8 and 10 keV.
The extracted PN and ACIS-S light curves do not show any significant (within 30%) flux or spectral variability.
Throughout our spectral analysis we fix the abundances of the elements to the solar values (Anders & Grevesse 1989) and we model Galactic absorption with the photoelectric absorption model PHABS in Xspec, where we fixed the absorbing column density to N cm-2 (HEASARC W3nH444http://heasarc.gsfc.nasa.gov/cgi-bin/Tools/w3nh/w3nh.pl). Line energies are given in the rest frame of the source.
3.1 The complex Fe K line
In order to study the properties of the Fe K line we concentrate our spectral analysis only on the hard X–ray ( keV) spectrum of the EPIC–PN. In this energy range the continuum can not be reproduced by a simple unabsorbed power law, since this model gives a negative spectral index and a poor fit. Allowing for extra absorption at the redshift of the source (ZPHABS in Xspec), we find a much better fit result (), but, given the limited statistics available, if both and NH are left free to vary, we find very large uncertainties (e.g. ). Fixing the spectral index to the “canonical” value allows us to measure a column density N cm-2 intrinsic to the source. As displayed in Figure 2, the fit is still not completely satisfactory (), mainly because of the presence of a feature in the spectrum at about 6.4 keV, which can be identified with an Fe K emission line. A significant improvement in the fit is obtained when a single broad Gaussian is added to the model (). The line centroid is at keV and the line is found to be broad ( keV), with an equivalent width eV.
Such a broad iron line (FWHM km s-1) could, in principle, originate from the accretion disc, since the primary radiation is obscured only up to about keV and therefore should only partly affect the photons at the iron line energy. We try to model the iron line profile with the DISKLINE model in Xspec for a Schwarzschild black hole, which parameterizes the radial emissivity of the disc as a power law (i.e. ). We fix the line rest energy to 6.4 keV, the emissivity of the disc to -2, the inner and outer radii respectively to 6 and to 1000 and the inclination angle to . We find an equivalent width eV and a fit result statistically equivalent to the one obtained with a single broad Gaussian (). Unfortunately, the statistics are too poor to derive any physical property of the disc.
The hypothesis of a broad iron line originating from the disc can not be ruled out, but the high column density, which is obscuring the AGN up to about 4 keV, certainly makes the detection of the redshifted wing of a relativistic iron line profile much less feasible. A more likely explanation for the prominent iron line feature observed may be given in terms of a complex profile due to the superposition of, at least, two unresolved line components: a neutral iron line at 6.4 keV, probably originating from a Compton–thick torus, and an ionized (Fe XXV) iron line at 6.7 keV. Indeed, the latter could be produced either by some diffuse collisionally ionized plasma at temperature keV, as observed in at least another two ULIRGs (namely NGC 6240, Boller et al. 2003; Netzer et al. 2005 and Arp 220, Iwasawa et al. 2005), or by reflection off some photoionized gas surrounding the nucleus, as often seen in Compton–thick Seyfert galaxies (e.g. Circinus, Sambruna et al. 2001; NGC 1068, Kinkhabwala et al. 2002; NGC 4945, Done et al. 2003; Mrk 3, Bianchi et al. 2005).
When the line profile is modeled with two narrow ( eV) Gaussian lines with energies fixed at 6.4 and 6.7 keV the result is statistically equivalent to a single broad line model (). In this case we measure an equivalent width eV and eV for the neutral and for the ionized component respectively. Finally, we find no improvement in the fit for the addition of a third ionized iron line at 6.97 keV from Fe XXVI. However upper limits on the flux ( erg cm-2 s-1) and the equivalent width ( eV) of this line can be derived.
In the following we discuss two distinct models capable of reproducing the broad band spectrum as well as the possible ionized iron lines: one through thermal emission, therefore involving the presence of a hot gas associated with a starburst, and the other one through reflection of the primary continuum by some optically thin photoionized gas.

3.2 The thermal emission model
| 2 APEC | 3 APEC | 3 APEC | |
| PN | PN | PN + MOS | |
| Apec(1) | |||
| [keV] | |||
| Apec(2) | |||
| [keV] | |||
| Apec(3) | |||
| [keV] | – | ||
| – | |||
| Power-law | |||
| [cm-2] | |||
| Fe K | |||
| [eV] | |||
| Total | |||
| 46.6 | 46.6 | 48.7 | |
| 1.54 | 1.54 | 1.66 | |
| dof | 84.2/80 | 63.8/78 | 130.0/134 |
At first we concentrate our analysis on the EPIC–PN spectrum. The better statistics, especially at high energies, permit more robust constraints of the model parameters. Once the best fit for the PN is found, we perform a combined fit of the PN and the two MOS, applying the same model, in order to further improve the statistics.
When the keV EPIC–PN spectrum is modeled with a simple absorbed (Galactic plus intrinsic) power law, we obtain a statistically unacceptable fit (). Strong residuals remain primarily above 4 keV, but also between 0.6 and 1 keV (Fig. 3).
As a starting point for our spectral modelling we adopt the best fit absorbed power law plus Gaussian model for the keV band (see Section 3.1) and extrapolate to 0.3 keV. A very prominent soft excess is clearly noticeable. Since we intend to investigate both the origin of the soft excess and of the possible ionized iron, in the following we fix the parameters of the Gaussian profile to keV and eV. This will be considered our baseline model.

Diffuse, optically thin, thermal plasma emission is often observed in Starburst galaxies and ULIRGs. It is typically associated with star–forming regions and shock–heated gas in merging systems. We try to model the soft, extended, X–ray emission with a thermal spectrum from a collisionally ionized plasma, using the APEC model (Smith et al. 2001) in Xspec. A single temperature plasma component gives a considerable improvement to the fit with respect to the baseline model (), but can not simultaneously account for the observed peak at about keV and the possible ionized iron lines.
Therefore, we add to the baseline model two collisionally ionized plasma components of different temperatures. The free parameters are now the temperature and the normalization of each plasma component, the column density of the absorber at the redshift of the source, the normalization of the power law and the normalization of the Gaussian line. The best fit parameters for this model are given in Table LABEL:broadband. A plasma temperature of keV is needed in order to model the peak in the emission at low energies, while a much hotter ( keV) plasma is required to fit part of the high energy continuum and also to give rise to the ionized iron line at 6.7 keV. The second, hotter, plasma is required with a high statistical significance ( for the addition of 2 free parameters). However the fit is still not completely satisfactory () due to the presence of some excess below about 0.6 keV.
The addition of a third, lower temperature, plasma component provides a further improvement to the fit ( for the addition of 2 free parameters). In this case we find an undoubtedly acceptable result (). The lowest temperature component is required with a probability of more than 99.99% according to an F–test. Its temperature ( keV) is consistent with the one derived from the spectrum of the extended hot gas halo ( keV) observed in the Chandra image (see Section 4.2).
The best fit to the keV PN spectrum is therefore obtained using three thermal plasma components with different temperatures, a highly absorbed power law and a neutral Fe K line (Figure 4). According to this model the emission below about 4 keV would be purely thermal. We will discuss the possible implications of these new findings in Section 5.


Simultaneously fitting the PN and the two MOS data results in an equivalent fit, as shown in Figure 4. All the parameters are consistent with those obtained using the PN only (see Table LABEL:broadband). It is worth noting that, combining the PN and the MOS, we find a temperature keV for the coolest thermal component, which is in very good agreement with the one measured by Chandra for the hot extended halo.
Finally, we remark that there is no need for further absorption at the redshift of the source for any of the three thermal components. When left free to vary the absorbing column density of each component is consistent with the Galactic value and do not improve the fit ( for the addition of one free parameter).
3.3 The photoionized gas model
An alternative interpretation for the origin of the soft X–ray continuum and the ionized iron line observed in the XMM-Newton spectrum is scattering of the primary radiation by some photoionized, Compton–thin, hot gas surrounding the AGN. Ionized Fe K emission lines from H– and He–like iron ions are expected to be produced through recombination and resonant scattering (Bianchi & Matt 2002).
The analysis of the Chandra image in Paper I revealed that the emission below 1 keV is extended on a region of radius kpc surrounding the nucleus and, partly, on a much larger region ( kpc) encompassing the tidal tail. A pure reflection model can not account for such extended X–ray emission, which must be of thermal origin. If we model the keV PN continuum with a highly absorbed (primary) plus a less absorbed (reflected) power law having the same spectral index, we find an unacceptable fit (). Therefore we added to the model two narrow Gaussian lines, at 6.4 keV from neutral iron and at 6.7 keV from Fe XXV, plus a hot collisionally ionized plasma component. In this case the fit result is acceptable (). However, there is no need for an additional lower temperature thermal plasma component, which is clearly detected by Chandra.
This apparent discrepancy between the two data sets may be reconciled simply by taking into account the absorption of the secondary power law, which is apparently negligible in the XMM-Newton spectrum, but cm-2 in the Chandra spectrum of the “nuclear” region (see Section 4.1). Therefore we fix the column density of the material obscuring the reflected power law to the value measured by Chandra. The free parameters of the model are: the temperature and the normalization of the thermal component; the column density of the absorber at the redshift of the source, which is obscuring only the primary power law; the normalizations of the two power law components; and the normalizations of the two Gaussian lines.
When this model is applied to the PN spectrum the fit result is still not completely satisfactory (), mostly due to some excess still present below 0.6 keV. The best fit parameters for this model are given in Table LABEL:refl.
The addition of a second, lower temperature, plasma component is a considerable improvement to the fit ( for the addition of 2 free parameters, ). Figure 5 shows the best fit obtained for this model. The cooler thermal plasma component is required with a probability of more than 99.99% according to an F–test. The temperature found keV is consistent, within the uncertainties, with that measured by Chandra for the extended hot gas halo.
The flux of the reflected power law amounts to % of the primary component. From this ratio we can estimate the column density of the reflecting material. Assuming a covering factor of 0.5, the column density of the photoionized gas would be approximately cm-2. The equivalent widths of the ionized iron lines expected to be produced by a hot gas with such a density are consistent with the measured values within the uncertainties.
The best fit model obtained here is similar to the one presented in Paper I, with the only noticeable differences being a slightly larger absorbing column density obscuring the primary radiation and a slightly smaller temperature of the cooler thermal component.
| 1 APEC | 2 APEC | |
| Apec(1) | ||
| [keV] | ||
| Apec(2) | ||
| [keV] | – | |
| – | ||
| Power-law(1) | ||
| [cm-2] | ||
| Power-law(2) | ||
| [cm-2] | ||
| Fe K | ||
| [keV] | ||
| [eV] | ||
| Fe XXV | ||
| [keV] | ||
| [eV] | ||
| Total | ||
| 44.5 | 42.1 | |
| 1.47 | 1.39 | |
| dof | 84.9/80 | 64.0/78 |

4 Comparison with Chandra
For a detailed spatial analysis of the Chandra X–ray image of Mrk 273 we refer the reader to Paper I. Here, as in Paper I, we extract separately the spectra of the nuclear region and that of the extendend soft halo from the two regions shown in Figure 1, in order to have the best possible signal–to–noise.
4.1 The inner 10′′ region
We apply to the Chandra spectrum of the inner region ( kpc surrounding the AGN) both models successfully tested in Section 3 for the XMM-Newton data.
The thermal emission model, which was not tested in Paper I, when applied to the Chandra spectrum of the “nuclear” region, gives also a good fit (). The best fit parameters are given in Table LABEL:chares. In this case, only two collisionally ionized plasma components are required, as shown in Figure 6.
The photoionized gas model, which we discuss here, is similar to the one presented in Paper I. It consists of a highly absorbed (primary) plus a less absorbed (secondary) power law having the same spectral index, two Fe K lines at 6.4 and 6.7 keV and a single thermal plasma component. This model also provides a good fit (, see Figure 7). A column density of N cm-2 obscuring the secondary power law is needed, in agreement with Paper I and the XMM-Newton results.
A narrow, unresolved, Fe K line is detected at about 3 significance in the ACIS–S spectrum. Its centroid is found at keV, which is slightly lower than the expected value of 6.4 keV from neutral iron, probably due to uncertainties in the calibration. No ionized iron lines are required by the data; however, we derive upper limits on the fluxes of the Fe XXV and Fe XXVI lines (respectively and erg cm-2 s-1), which are consistent with those measured by XMM-Newton.
The best fit parameters for both models (summarized in Table LABEL:chares) are consistent, within the uncertainties, with those found by XMM-Newton. The only exception is in the value of the column density obscuring the primary radiation, which is slightly different between the two observations ( and cm-2 for the Chandra and the XMM-Newton observation respectively).
| Model 1 | Model 2 | Hot Gas | |
| Inner | Inner | Halo | |
| Apec(1) | |||
| [keV] | – | – | |
| – | – | ||
| Apec(2) | |||
| [keV] | – | ||
| – | |||
| Apec(3) | |||
| [keV] | – | – | |
| – | – | ||
| Power-law(1) | |||
| [cm-2] | – | ||
| – | |||
| – | |||
| Power-law(2) | |||
| [cm-2] | – | – | |
| – | – | ||
| – | – | ||
| Fe K | |||
| – | |||
| [eV] | – | ||
| – | |||
| Total | |||
| 55.4 | 55.9 | 0.3 | |
| 1.84 | 1.86 | 0.01 | |
| dof | 65.0/75 | 62.0/75 | – |


4.2 The hot gas halo
The ACIS-S spectrum of the extended hot gas halo, which is extracted from the region defined in Section 2.2, is source dominated only in the keV band. Given the limited amount of photons (315) detected in this band, we prefer to use Cash statistics on the unbinned spectrum. As displayed in Figure 8, the spectrum is consistent with a single temperature plasma component with keV. We performed a Monte Carlo calculation to test the goodness of the fit and we found that 63% of the 104 simulated spectra have a fit statistics less than that for the data. A fraction of approximately 50% is expected, if the observed spectrum was produced by the model. If the statistics is applied to the spectrum grouped to have a minimum of 20 counts per bin, fixing the model parameters to those previously found (see Table LABEL:chares), we obtain .
In this analysis we adopted a more conservative approach in subtracting the background in comparison to Paper I. This resulted in a slightly smaller temperature for the extended hot gas halo with respect to the previous analysis, but in very good agreement with the XMM-Newton results.
5 Discussion
A broad Fe K emission line with keV is detected at high significance in the broad band ( keV) EPIC–PN spectrum ( for 3 additional free parameters, corresponding to more than 99% confidence level). The hypothesis of a broad iron line originating from the disc is plausible, but the high column density, obscuring the AGN up to about 4 keV, makes the detection of the redshifted wing of a relativistic iron line profile more difficult. The most likely explanation for such a broad line profile is the superposition of a narrow, unresolved, neutral iron line at 6.4 keV, probably associated with the AGN torus, and a blend of Fe XXV and Fe XXVI lines, associated with a hot plasma, in which this transitions are either thermally excited or induced by photoionization. Unfortunately, the modest statistics do not allow to singularly resolve the three possible lines. However the fluxes and equivalent widths measured by Chandra and XMM-Newton are consistent within the two observations.
There is no evidence for extra absorbing material obscuring any of the thermal plasma components. This could be due to a non–spherical geometry of the gas surrounding the nuclear region, given the complex morphology of this merger, or it could be simply due to the low statistics. A slightly different column density is found to be obscuring the primary radiation between the two observations. Again this could be, somehow, associated to the complex morphology of the merger, since, for instance, the projected separation between the two nuclei is , or it could be only an effect due to the low statistics available at high energies.
According to the thermal emission model, the temperatures of the three plasma components found in Mrk 273 are remarkably similar to those observed in other ULIRGs (e.g. NGC 6240 and Arp 220) and in the local starburst galaxy NGC 253 (Pietsch et al. 2001). The thermal emission at keV, as clearly shown from the Chandra image, extends on a large scale ( kpc) and embraces the long tidal tail of the merger. Therefore, it must be associated with hot gas distributed in the halo. Interestingly, thermal emission at keV seems to be ubiquitous in the spectra of ULIRGs, probably being associated with a nuclear or circumnuclear starburst (Franceschini et al. 2003). The presence of a high temperature ( keV) thermal component is less frequently observed, but not so unusual, being also detected in the XMM-Newton spectra of NGC 6240 (Boller et al. 2003) and Arp 220 (Iwasawa et al. 2005). The ratio of the keV unabsorbed X–ray luminosity of the highest temperature thermal component to the bolometric luminosity in Mrk 273 is (), a factor of 20 smaller than in NGC 6240 and a factor of 5 larger than in Arp 220.
On the other hand, the second model investigated suggests that a secondary hard X–ray component originates from the reflection of the primary continuum on some photoionized circumnuclear material. This is often observed in Compton–thick Seyfert 2 galaxies (Sambruna et al. 2001; Kinkhabwala et al. 2002; Done et al. 2003; Bianchi et al. 2005), which, in some cases, also show evidence for starburst activity (e.g. Circinus, Ruiz et al. 2001; NGC 1068, Smith & Wilson 2003). As was observed in Paper I, two bright clumps of soft X–ray emission coincide with [OIII] emission. This piece of evidence seems to support the hypothesis of a photoionized gas surrounding the nucleus, since in several Compton–thick Seyfert galaxies, the extended soft X–ray emission expected to be produced by reflection from that photoionized gas has been observed to coincide with the [OIII] emission and the ionization cone (e.g. Sako et al. 2000; Young et al. 2001).
The absorption corrected hard X–ray luminosity of Mrk 273 is erg s-1, which corresponds to of the far–IR luminosity (, e.g. Genzel et al. 1998). Such a ratio approaches values of pure starbursts and is orders of magnitude smaller than in Compton-thin AGNs (Risaliti et al. 2000). According to the thermal emission model, the absorption corrected keV luminosity due to the three thermal components would be approximately erg s-1. Comparable soft X–ray luminosities have been measured for NGC 6240 (Netzer et al. 2005) and other ULIRGs in which the starburst contribution to the bolometric luminosity is dominating (Franceschini et al. 2003). From the photoionized gas model the resulting thermal contribution to the X–ray luminosity is about a factor of 3 smaller. For Mrk 273 the unobscured AGN X-ray luminosity is a more modest fraction of the bolometric luminosity than in typical AGN. This suggests additional strong star formation which will naturally explain the thermal X-ray components invoked in one of our two scenarios. The presence of strong star formation agrees with the detection from mid-infrared spectroscopy (Genzel et al. 1998) of both very powerful star formation and an AGN in Mrk 273.
It must be mentioned that, besides the two models discussed above, other interpretations are possible. In fact X–ray emission from luminous radio supernovae like SN1995J (Fox et al. 2000), or the integrated contribution from low– and high–mass X–ray binaries, as observed from the spectra of local starburst galaxies (Persic & Rephaeli 2002), may both give rise to a very hot ( keV) thermal component, or a power law. Following Kennicutt (1998), the star formation rate estimated assuming that the entire is due to starburst would be yr-1. Therefore, the inferred supernova rate is yr-1, which is in agreement with the value estimated from radio observations Bondi et al. (2005). On the other hand, given a 200 yr-1 star formation rate, the estimated emission from X–ray binaries, following Franceschini et al. (2003), would be erg s-1, which is very close to the observed value ( erg s-1). Finally, it is worth noting that X–ray spectra from supernovae have shown evidence for strong Fe K line at 6.7 keV (e.g. SN1986J, Houck et al. 1998), therefore could also account for this feature, while emission from X–ray binaries can not.
6 Conclusions
We analyzed the X–ray spectral properties of Mrk 273 combining the high throughput of XMM-Newton with the high spatial resolution of Chandra.
From the XMM-Newton spectrum we found a broad Fe K emission line with a high statistical significance (99% c.l.). We suggested the superposition of multiple unresolved iron line features: one from neutral iron at 6.4 keV ( eV) and one from a blend of Fe XXV at 6.7 keV ( eV) and Fe XXVI at 6.97 keV ( eV).
We tested two different models capable of reproducing the possible ionized iron lines detected: one through thermal emission, therefore involving the presence of a hot gas associated with a starburst, and the other one through reflection of the primary continuum by some optically thin photoionized gas. Unfortunately, given the available statistics, we can not rule out any of the two possible explanations. Some indications that a reflection componet is indeed present in the nuclear region of Mrk 273 may come from polarization measures, which are already available in the IR (Siebenmorgen & Efstathiou 2001), but still not in the X–rays. High resolution spectroscopy could be helpful in order to detect some of the forbidden lines or the Radiative Recombination Continua (RRC), which are considered as typical signatures of photoionization (Porquet & Dubau 2000; Liedahl 1999; Liedahl & Paerels 1996).
Appendix A The unabsorbed Seyfert 2 Mrk 273x
Over recent years, much attention has been directed to the study of unabsorbed Seyfert 2 galaxies (e.g. Ptak et al. 1996; Panessa & Bassani 2002; Gallo et al. 2005). These galaxies are of interest for two reason: they may account for as much as 30% of the Seyfert 2 population (Panessa & Bassani 2002), and they are a challenge to explain with the existing Seyfert unification model.
Mrk 273x ( 0.458) is one of the better known unabsorbed Seyfert 2 galaxies, perhaps because it falls in the field-of-view of most observations of Mrk 273. In this appendix, we would like to discuss the properties of Mrk 273x as seen during the XMM-Newton observation of Mrk 273.
In the EPIC-PN image, Mrk 273x falls directly in a chip gap; hence we used the combined MOS 1/2 data for spectral analysis. The combined spectrum is source dominated in the keV band ( keV in the rest-frame). The total number of source plus background counts is 526, whereas the total number of background counts is 65 (scaled to source cell size).
The best-fit continuum model of Paper I to the data of Mrk 273x was a power law plus a weak thermal component. Significantly detected above the continuum was an emission line at 1.82 keV, which the authors suggested could be due to Si XVI. The XMM-Newton data are consistent with only a power law () modified by Galactic absorption (; Figure 9).

The 90% confidence upper limit on the intrinsic absorption is cm-2, at least a factor of three less than what was required in the model.
Multi-component continuum models (e.g. blackbody plus power law, double power law, or a broken power law) also fit the data well, but they are not significant improvements over the single power law. Neither the addition of a keV emission feature is required by the data ( for 2 additional free parameters; eV). Positive residuals at about 4.3 keV can be modelled with a narrow Gaussian profile with a rest-frame energy of keV. The addition of the Gaussian profile is an improvement to the residuals, but it is not statistically significant ( for 3 additional free parameters).
Based on the single power law fit, the unabsorbed keV flux is ( erg s-1 cm-2 ( erg s-1 cm-2 in the keV band). The intrinsic keV unabsorbed luminosity is erg s-1. The broad band flux measured during this XMM-Newton observation is comparable to the flux observed during the observation two years earlier. The ks light curve of Mrk 273x shows no variability and is perfectly fitted by a constant.
Acknowledgements.
We thank Günther Hasinger and Andrea Comastri for useful discussions, Stefano Bianchi and Paolo Tozzi for their help on the reduction and spectral analysis of the XMM-Newton and Chandra data and the anonymous referee for valuable comments and suggestions. This paper is based on observations obtained with XMM-Newton, an ESA science mission with instruments and contributions directly founded by ESA Member States and NASA.References
- Anders & Grevesse (1989) Anders, E. & Grevesse, N. 1989, Geochim. Cosmochim. Acta., 53, 197
- Bianchi & Matt (2002) Bianchi, S. & Matt, G. 2002, A&A, 387, 76
- Bianchi et al. (2005) Bianchi, S., Miniutti, G., Fabian, A. C., & Iwasawa, K. 2005, MNRAS, 426
- Boller et al. (2003) Boller, T., Keil, R., Hasinger, G., et al. 2003, A&A, 411, 63
- Bondi et al. (2005) Bondi, M., Perez-Torres, M.-A., Dallacasa, D., & Muxlow, T. 2005, Accepted for publication in MNRAS, astro-ph/0505370
- Braito et al. (2003) Braito, V., Franceschini, A., Della Ceca, R., et al. 2003, A&A, 398, 107
- Brandt et al. (1997) Brandt, W. N., Fabian, A. C., Takahashi, K., et al. 1997, MNRAS, 290, 617
- Carilli & Taylor (2000) Carilli, C. L. & Taylor, G. B. 2000, ApJ, 532, L95
- den Herder et al. (2001) den Herder, J. W., Brinkman, A. C., Kahn, S. M., et al. 2001, A&A, 365, L7
- Done et al. (2003) Done, C., Madejski, G. M., Życki, P. T., & Greenhill, L. J. 2003, ApJ, 588, 763
- Fox et al. (2000) Fox, D. W., Lewin, W. H. G., Fabian, A., et al. 2000, MNRAS, 319, 1154
- Franceschini et al. (2003) Franceschini, A., Braito, V., Persic, M., et al. 2003, MNRAS, 343, 1181
- Gallo et al. (2005) Gallo, L., Lehmann, I., Pietsch, W., et al. 2005, Submitted to MNRAS
- Genzel et al. (1998) Genzel, R., Lutz, D., Sturm, E., et al. 1998, ApJ, 498, 579
- Goldader et al. (1995) Goldader, J. D., Joseph, R. D., Doyon, R., & Sanders, D. B. 1995, ApJ, 444, 97
- Houck et al. (1998) Houck, J. C., Bregman, J. N., Chevalier, R. A., & Tomisaka, K. 1998, ApJ, 493, 431
- Iwasawa (1999) Iwasawa, K. 1999, MNRAS, 302, 96
- Iwasawa et al. (2005) Iwasawa, K., Sanders, D. B., Evans, A. S., et al. 2005, MNRAS, 357, 565
- Jansen et al. (2001) Jansen, F., Lumb, D., Altieri, B., et al. 2001, A&A, 365, L1
- Kennicutt (1998) Kennicutt, R. C. 1998, ARA&A, 36, 189
- Kii et al. (1997) Kii, T., Nakagawa, T., Fujimoto, R., et al. 1997, in X-Ray Imaging and Spectroscopy of Cosmic Hot Plasmas, 161–+
- Kinkhabwala et al. (2002) Kinkhabwala, A., Sako, M., Behar, E., et al. 2002, ApJ, 575, 732
- Knapen et al. (1997) Knapen, J. H., Laine, S., Yates, J. A., et al. 1997, ApJ, 490, L29+
- Koski (1978) Koski, A. T. 1978, ApJ, 223, 56
- Liedahl (1999) Liedahl, D. A. 1999, LNP Vol. 520: X-Ray Spectroscopy in Astrophysics, 520, 189
- Liedahl & Paerels (1996) Liedahl, D. A. & Paerels, F. 1996, ApJ, 468, L33+
- Lutz et al. (1998) Lutz, D., Spoon, H. W. W., Rigopoulou, D., Moorwood, A. F. M., & Genzel, R. 1998, ApJ, 505, L103
- Mason et al. (2001) Mason, K. O., Breeveld, A., Much, R., et al. 2001, A&A, 365, L36
- Mitsuda (1995) Mitsuda, K. 1995, in Seventeeth Texas Symposium on Relativistic Astrophysics and Cosmology, 213–+
- Netzer et al. (2005) Netzer, H., Lemze, D., Kaspi, S., et al. 2005, ApJ in press, astro-ph/0505016
- Panessa & Bassani (2002) Panessa, F. & Bassani, L. 2002, A&A, 394, 435
- Persic & Rephaeli (2002) Persic, M. & Rephaeli, Y. 2002, A&A, 382, 843
- Pietsch et al. (2001) Pietsch, W., Roberts, T. P., Sako, M., et al. 2001, A&A, 365, L174
- Porquet & Dubau (2000) Porquet, D. & Dubau, J. 2000, A&AS, 143, 495
- Ptak et al. (2003) Ptak, A., Heckman, T., Levenson, N. A., Weaver, K., & Strickland, D. 2003, ApJ, 592, 782
- Ptak et al. (1996) Ptak, A., Yaqoob, T., Serlemitsos, P. J., Kunieda, H., & Terashima, Y. 1996, ApJ, 459, 542
- Risaliti et al. (2000) Risaliti, G., Gilli, R., Maiolino, R., & Salvati, M. 2000, A&A, 357, 13
- Ruiz et al. (2001) Ruiz, M., Efstathiou, A., Alexander, D. M., & Hough, J. 2001, MNRAS, 325, 995
- Sako et al. (2000) Sako, M., Kahn, S. M., Paerels, F., & Liedahl, D. A. 2000, ApJ, 543, L115
- Sambruna et al. (2001) Sambruna, R. M., Netzer, H., Kaspi, S., et al. 2001, ApJ, 546, L13
- Sanders & Mirabel (1996) Sanders, D. B. & Mirabel, I. F. 1996, ARA&A, 34, 749
- Sanders et al. (1988a) Sanders, D. B., Soifer, B. T., Elias, J. H., et al. 1988a, ApJ, 325, 74
- Sanders et al. (1988b) Sanders, D. B., Soifer, B. T., Elias, J. H., Neugebauer, G., & Matthews, K. 1988b, ApJ, 328, L35
- Sanders et al. (1999) Sanders, D. B., Surace, J. A., & Ishida, C. M. 1999, in IAU Symp. 186: Galaxy Interactions at Low and High Redshift, 289–+
- Siebenmorgen & Efstathiou (2001) Siebenmorgen, R. & Efstathiou, A. 2001, A&A, 376, L35
- Smith & Wilson (2003) Smith, D. A. & Wilson, A. S. 2003, ApJ, 591, 138
- Smith et al. (2001) Smith, R. K., Brickhouse, N. S., Liedahl, D. A., & Raymond, J. C. 2001, ApJ, 556, L91
- Soifer et al. (2000) Soifer, B. T., Neugebauer, G., Matthews, K., et al. 2000, AJ, 119, 509
- Soifer et al. (1987) Soifer, B. T., Sanders, D. B., Madore, B. F., et al. 1987, ApJ, 320, 238
- Strüder et al. (2001) Strüder, L., Briel, U., Dennerl, K., et al. 2001, A&A, 365, L18
- Surace & Sanders (2000) Surace, J. A. & Sanders, D. B. 2000, AJ, 120, 604
- Turner et al. (2001) Turner, M. J. L., Abbey, A., Arnaud, M., et al. 2001, A&A, 365, L27
- Turner et al. (1997) Turner, T. J., George, I. M., Nandra, K., & Mushotzky, R. F. 1997, ApJS, 113, 23
- Turner et al. (1998) Turner, T. J., George, I. M., Nandra, K., & Mushotzky, R. F. 1998, ApJ, 493, 91
- Vignati et al. (1999) Vignati, P., Molendi, S., Matt, G., et al. 1999, A&A, 349, L57
- Xia et al. (2002) Xia, X. Y., Xue, S. J., Mao, S., et al. 2002, ApJ, 564, 196
- Young et al. (2001) Young, A. J., Wilson, A. S., & Shopbell, P. L. 2001, ApJ, 556, 6