Galaxy Cluster Masses Without Non-Baryonic Dark Matter
Abstract
We apply the modified acceleration law obtained from Einstein gravity coupled to a massive skew symmetric field, , to the problem of explaining X-ray galaxy cluster masses without exotic dark matter. Utilizing X-ray observations to fit the gas mass profile and temperature profile of the hot intracluster medium (ICM) with King “-models”, we show that the dynamical masses of the galaxy clusters resulting from our modified acceleration law fit the cluster gas masses for our sample of 106 clusters without the need of introducing a non-baryonic dark matter component. We are further able to show for our sample of 106 clusters that the distribution of gas in the ICM as a function of radial distance is well fit by the dynamical mass distribution arising from our modified acceleration law without any additional dark matter component. In previous work, we applied this theory to galaxy rotation curves and demonstrated good fits to our sample of 101 LSB, HSB and dwarf galaxies including 58 galaxies that were fit photometrically with the single parameter . The results there were qualitatively similar to those obtained using Milgrom’s phenomenological MOND model, although the determined galaxy masses were quantitatively different and MOND does not show a return to Keplerian behavior at extragalactic distances. The results here are compared to those obtained using Milgrom’s phenomenological MOND model which does not fit the X-ray galaxy cluster masses unless an auxiliary dark matter component is included.
keywords:
dark matter — galaxies: clusters: general — galaxies: kinematics and dynamics — gravitation — X-rays: galaxies: clusters1 Introduction
The question of galaxy rotation curves and cluster masses has been known to require some form of energy density that makes its presence felt only by its gravitational effects since Zwicky (1933) analyzed the velocity dispersion for the Coma cluster. By 1959 there were eight galaxy rotation curves available from radio observations demonstrating a “flat rotation velocity”. In Brownstein & Moffat (2005) – our study of galaxy rotation curves without non-baryonic dark matter – we demonstrated good fits to our sample of 101 LSB, HSB and dwarf galaxies including 58 galaxies that were fit photometrically with the single parameter (29 band and 29 band). As a follow-up, we apply here the same framework to the question of X-ray galaxy cluster masses (Moffat, 2005a, b; Brownstein & Moffat, 2005).
In this framework, we apply a generalization of Einstein’s general relativity (GR) based on a pseudo-Riemannian metric tensor and a skew symmetric rank three tensor field , called metric-skew-tensor-gravity (MSTG). A renormalization group (RG) framework (Reuter & Weyer, 2004a, b) for MSTG was developed to describe the running of the effective gravitational coupling constant , and the effective coupling constant that measures the strength of the coupling of the field to matter. A momentum cutoff identification associates the RG scales to points in spacetime. For the static, spherically symmetric solution, the RG flow equations allow a running with momentum and proper length for the effective Newtonian coupling constant , the coupling constant , and the effective mass of the skew field where denotes the radial coordinate. The form of as a function of , obtained from the modified Newtonian acceleration law, leads to agreement with solar system observations, terrestrial gravitational experiments and the binary pulsar PSR 1913+16 observations, while strong renormalization effects in the infrared regime at large distances lead to fits to galaxy rotation curves and X-ray cluster masses. In Moffat (2005b), a scalar-tensor-vector gravity theory is formulated, which yields the same weak field modified acceleration law as in MSTG Moffat (2005a), and equations that describe an effective running of , and with space and time.
A fit to the bulk properties (the gas mass) of 106 X-ray galaxy clusters is achieved without exotic dark matter by a best fit result using a nonlinear least-squares fitting routine including estimated errors for the one free parameter in the RG flow equations, , which fully describes the large distance renormalization of Newton’s constant, . The running of Newton’s constant, , is fully constrained by choosing the remaining free parameter in the RG flow equations, , to take on a value proportional to the scale of the galaxy cluster (for small clusters with galactic scale ICM gas masses) or to take on a particular constant value for the majority of the regular size galaxy clusters (where the ICM gas mass dominates over the masses of the individual galaxies). Thus, the individual cluster mass profiles as functions of radial position throughout the range of X-ray observations are parameter free predictions; and are consistent with X-ray observed gas mass profiles without exotic dark matter.
The galaxy cluster’s bulk properties fit and the specific fit to the individual clusters are compared to those obtained using Milgrom’s phenomenological MOND model which does not fit the X-ray galaxy cluster masses unless an auxiliary dark matter component is included (Sanders, 2003). The & White (1988) were able to account for the MOND discrepancy between the X-ray observationally determined gas mass and the dynamical mass of the Coma cluster by increasing the MOND acceleration by a factor of four greater than that used to fit the galaxy rotation curves. Aguirre et al. (2001) present evidence from the central 200 kpc of three clusters implying that MOND is inconsistent with the observed temperature gradient which inflates the discrepancy in the MOND acceleration to a factor of 10. More recently, Pointecouteau & Silk (2005) use X-ray data from the XMM-Newton satellite for eight clusters of varying temperature and masses to place constraints on the use of the MOND phenomenology. Without treating the MOND acceleration as a free parameter as opposed to a universal constant, MOND predicts dynamical masses greatly in excess of the X-ray observations – necessitating the ad hoc addition of dark matter to explain away the missing mass. We are able to show that there is no missing mass when applying the MSTG acceleration law to galaxy clusters.
2 Isotropic Isothermal Model
Recent observations from the XMM-Newton satellite suggest that the intracluster medium (ICM) is very nearly isothermal inside the region defined by the X-ray emission with temperatures ranging from 1–15 keV (or – K) for different clusters (Arnaud et al., 2001b). The combination of the observed density profile, , and the temperature profile, , obtained from X-ray observations of the galaxy cluster leads to a pressure profile, , which directly leads to a mass profile, , by assuming the gas is in nearly hydrostatic equilibrium with the gravitational potential of the galaxy cluster. Within a few core radii, the distribution of gas within a galaxy cluster may be fit by a King “-model”. The observed surface brightness of the X-ray cluster can be fit to a radial distribution profile (Chandrasekhar, 1960; King, 1966):
| (1) |
resulting in best fit parameters, and . A deprojection of the -model of equation (1) assuming a nearly isothermal gas sphere then results in a physical gas density distribution (Cavaliere & Fusco-Femiano, 1976):
| (2) |
where is the ICM mass density profile. Provided the number density, , traces the actual mass, we may assume that , which according to Reiprich (2001) is explicitly
| (3) |
and rewrite equation (2)
| (4) |
For a spherical system in hydrostatic equilibrium, the structure equation can be derived from the collisionless Boltzmann equation
| (5) |
where is the gravitational potential for a point source, and are mass-weighted velocity dispersions in the radial () and tangential () directions, respectively. For an isotropic system,
| (6) |
The pressure profile, , can be related to these quantities by
| (7) |
Combining equations (5), (6) and (7), the result for the isotropic sphere is
| (8) |
For a gas sphere with temperature profile, , the velocity dispersion becomes
| (9) |
where is Boltzmann’s constant, is the mean atomic weight and is the proton mass. We may now substitute equations (7) and (9) into equation (8) to obtain
| (10) |
Performing the differentiation on the left hand side of equation (8), we may solve for the gravitational acceleration:
| (11) | |||||
For the isothermal isotropic gas sphere, the temperature derivative on the right-hand side of equation (11) vanishes and the remaining derivative can be evaluated using the -model of equation (2):
| (12) |
3 Mass Profiles
Given an isotropic density distribution, , the associated mass profile is
| (13) |
where is the total mass contained within a sphere of radius r. For the -model of equation (2), we may approximate the integral of equation (13) for and (Reiprich, 2001):
| (14) |
This result clearly diverges in the limit as ; but galaxy clusters are observed to have finite spatial extent. This allows an approximate determination of the total mass of the galaxy cluster by first solving equation (2) for the position, , at which the density, , drops to , or 250 times the mean cosmological density of baryons:
| (15) |
Then, provided ,
| (16) |
The dynamical mass in Newton’s theory of gravitation can be obtained as a function of radial position by replacing the gravitational acceleration with Newton’s Law:
| (17) |
where is Newton’s “bare” gravitational constant so that equation (11) can be rewritten as
| (18) |
and the isothermal -model result of equation (12) can be rewritten as
| (19) |
Similarly, the dynamical mass in MSTG can be obtained as a function of radial position by substituting the MSTG gravitational acceleration law (Moffat, 2005a, b; Brownstein & Moffat, 2005):
| (20) |
so that our result for the isothermal -model becomes
| (21) |
We can express this result as a scaled version of equation (18) or the isothermal case of equation (19):
| (22) | |||||
where we have made explicit the form of the running of G(r) as in Moffat (2005a, b); Brownstein & Moffat (2005):
| (23) |
In the limit of large , we show in Moffat (2005a, b); Brownstein & Moffat (2005) that
| (24) |
and the total mass of the cluster in MSTG can be computed by taking equations (22) to the same limit:
| (25) | |||||
It is a simple matter to solve equations (22) and (25) explicitly for and , respectively, by squaring both sides and subsequently applying the canonical solution to the quadratic equation.
The derivation in Milgrom’s phenomenological MOND model (Milgrom, 1983; Sanders & McGaugh, 2002) follows the same procedure, but utilizes the MOND gravitational acceleration law, described by
| (26) |
where is a function that interpolates between the Newtonian regime, , when and the MOND regime, , when . The function and critical acceleration normally used for galaxy and cluster fitting are, respectively,
| (27) | |||||
| (28) |
Applying equation (26) to either equation (11) or the isothermal case of equation (12) yields the MOND dynamical mass in terms of the Newtonian dynamical mass of equation (18) or the isothermal case of equation (19):
| (29) |
It is a simple matter to solve equation (29) explicitly for by squaring both sides and subsequently applying the canonical solution to the quadratic equation.
Unlike the Newtonian and MSTG isothermal spheres whose densities fall off as in the limit of large , Milgrom (1984) showed that the MOND isothermal spheres have densities that fall of as where at large radii. In the Newtonian and MSTG cases, the behavior is Keplerian at large radii and so the isothermal spheres have masses which diverge with (Chandrasekhar, 1960). Thus according to equations (17) and (20) the acceleration at large radii for Newtonian and MSTG isothermal spheres goes as . Conversely, the MOND isothermal spheres have convergent masses regardless of the spatial extent Sanders (2003):
| (30) |
The MOND acceleration law regularizes the integral of equation (13) whereas a cutoff is necessary in the Newtonian and MSTG case, corresponding to the finite spatial extent of galaxy clusters as shown in equation (16). However, as clearly shown in Sanders (2003), the X-ray surface brightness distribution of these MOND isothermal spheres provides a poor representation of the observed surface brightness distribution. This distinction will become apparent in the section ahead where we study the MSTG and MOND mass profiles of the Coma cluster.
4 Running of Newton’s Constant
We have adopted the compilation of Reiprich (2001); Reiprich & Böhringer (2002) as our sample. The relevant cluster properties are listed in Table 1 arranged as follows: Column (1) lists the cluster name truncated to 8 characters. Column (2) is the observed X-ray temperature. Column (3) lists the ICM central mass density, , of the ICM in units of . Column (4) is the parameter. Column (5) is the core radius parameter, , in units of kpc assuming (Eidelman et al. , 2004). Column (6) is the position, at which the density, , drops to , or 250 times the mean cosmological density of baryons. Column (7) through (9) lists the ICM gas mass, , the Newtonian dynamic mass, , and the MSTG dynamic mass, , respectively, each integrated to . Column (10) lists the “convergent” MOND dynamic mass.
In order to calculate the MSTG dynamic mass we first need to phenomenologically determine the running of the parameters, , and – this describes the running of Newton’s constant at the scale of clusters according to equation (23). However, unlike the case of the galaxy rotation curves where a satisfactory fit to LSB and HSB galaxy data is obtained with the parameters (Brownstein & Moffat, 2005)
| (31) |
we found that a better fit was attained by dropping the simplifying assumption that is constant across clusters. In fact, we were able to account for all dwarf galaxies smaller than 12 kpc in Brownstein & Moffat (2005) by allowing to scale down to:
| (32) |
The three schemes we attempted to prescribe for the scale variation of for clusters are as follows:
-
1.
, where is the total ICM gas mass integrated to ,
-
2.
,
-
3.
.
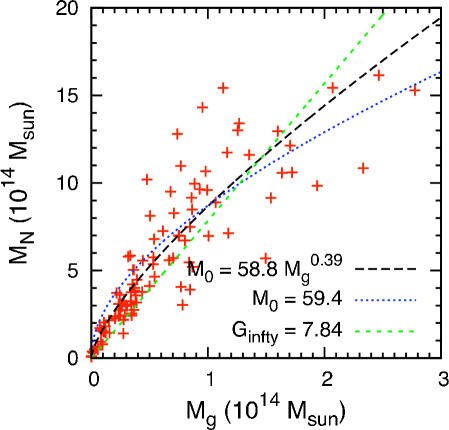
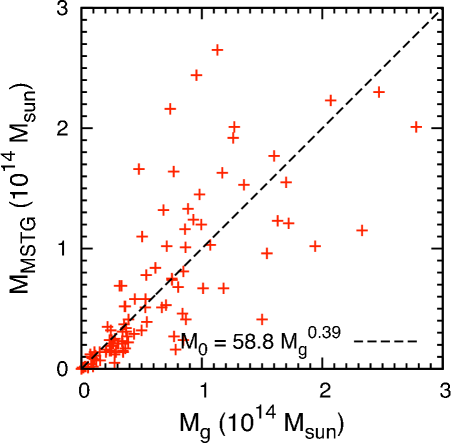
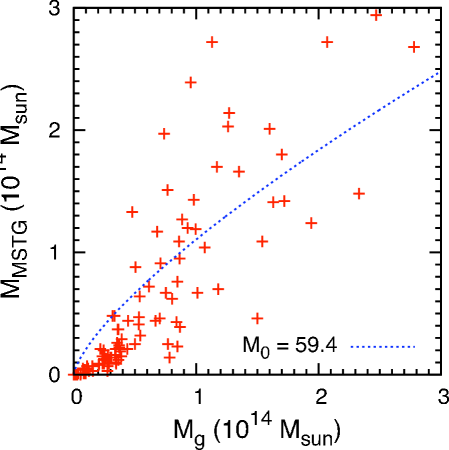
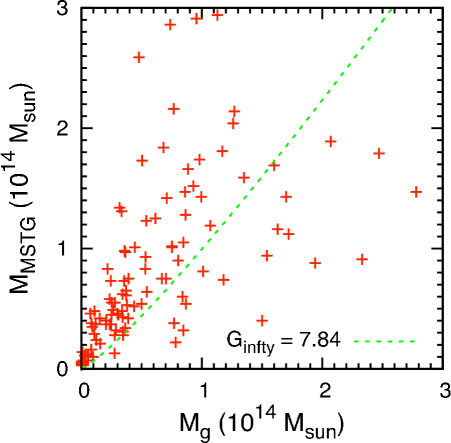
It is clear that case (ii) is the limit of case (i) taking and also that case (iii) is the limit of case (i) taking . By plotting against and then applying equation (25), we were able to constrain the parameter, , using a nonlinear least-squares fitting routine including estimated errors . The fits for each of the three above schemes are shown in Figure 1, with the results as follows:
-
1.
,
-
2.
,
-
3.
.
The quality of each of these prescriptions for is seen in their respective plots of Figure 1 where the MSTG mass is plotted against the ICM gas mass. Clearly, the plot corresponding to case (i) is the best scheme since the slope of unity best describes the bulk properties of the clusters. Indeed, the overall least sum of squares best fit is the scheme corresponding to case (i) with the other two acting as limiting cases. Meanwhile, both the MOND “convergent mass” and the Newtonian dynamic mass show a discrepancy with the ICM gas mass (Sanders, 2003).
In the galaxy rotation curves, we scaled down from equation (31) by a factor of 2 to account for the Dwarf galaxies (Brownstein & Moffat, 2005). For all but the smallest galaxy clusters where the mass of the ICM dominates over the mass of the individual galaxies, scaling up from equation (31) by a factor of 10 leads to satisfactory fits, whereas for the smallest galaxy clusters where the mass of the ICM is of the order of galactic masses – with – scaling to leads to satisfactory fits. Thus our prescription for the running of Newton’s constant (RG flow) for galaxy clusters is fully constrained:
| (33) | |||||
5 Individual Clusters
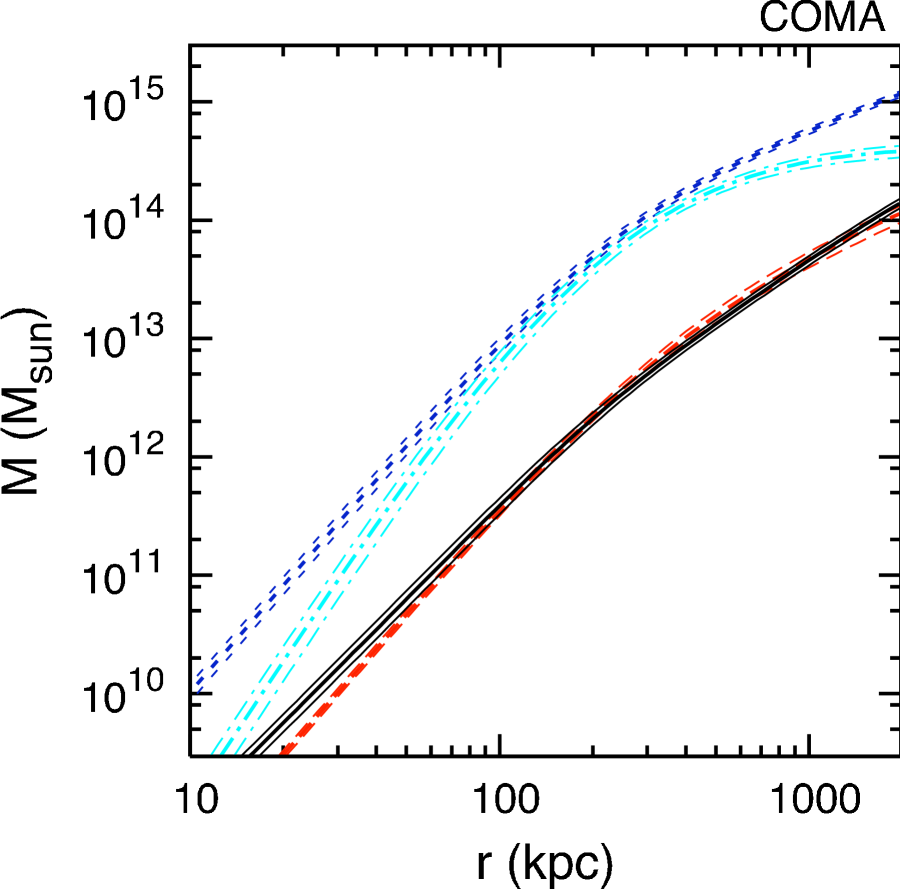
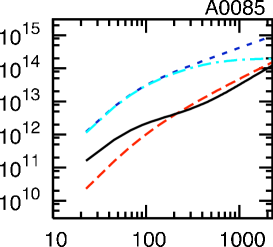
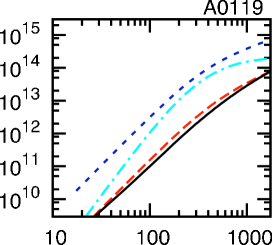
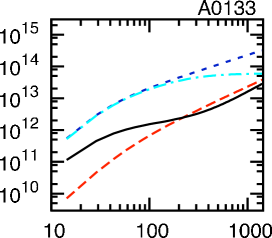
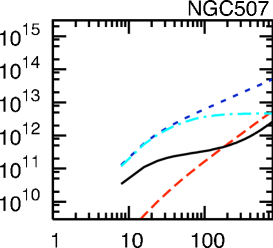
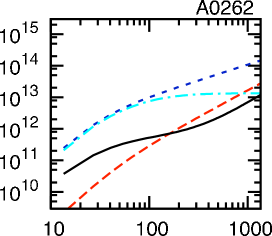
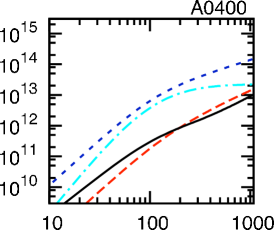
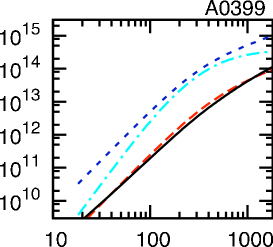
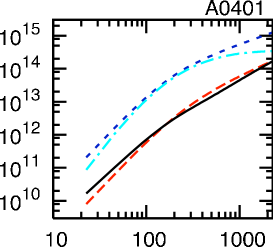
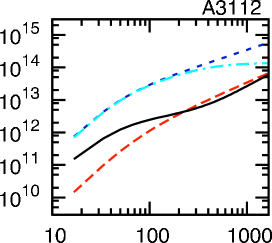
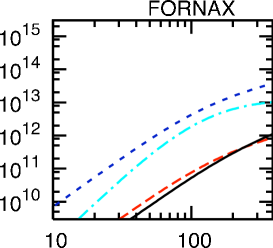
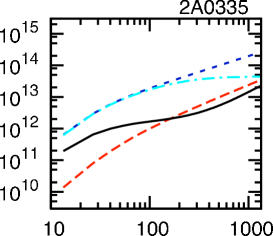
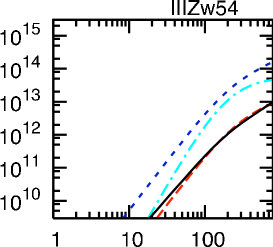
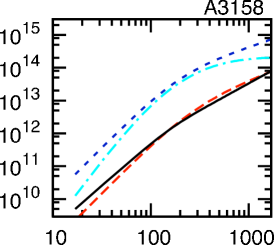
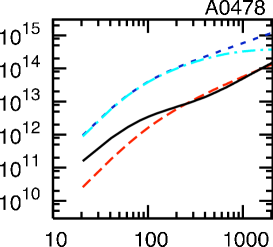
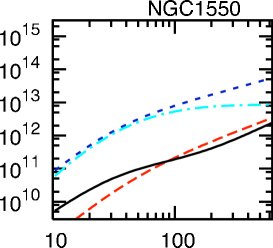
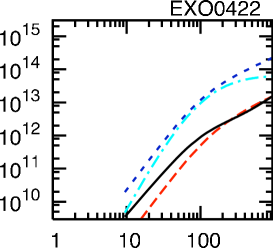
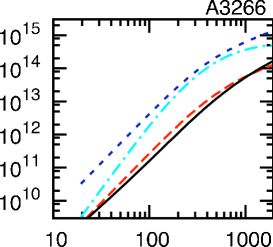
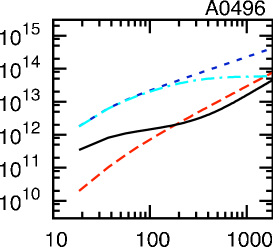
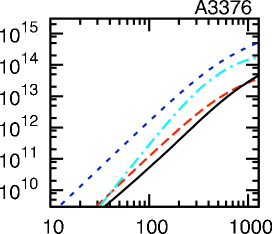
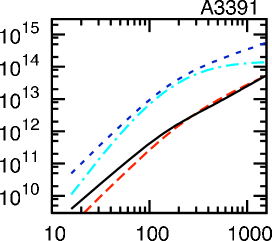
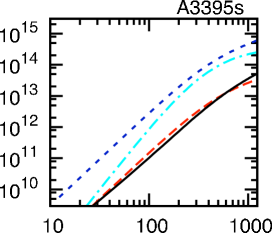
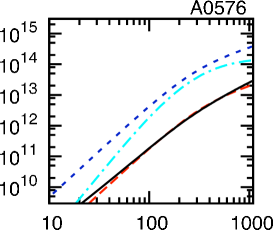
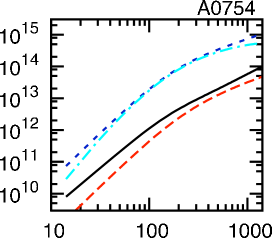
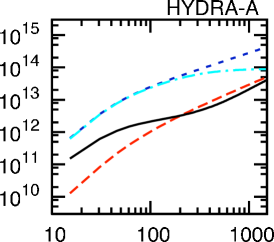
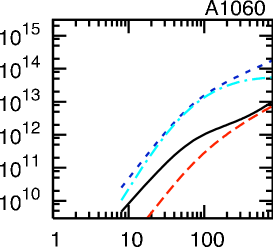
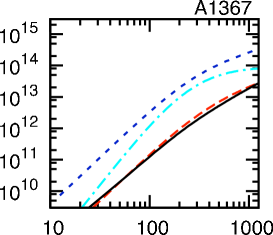
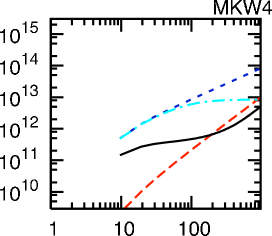
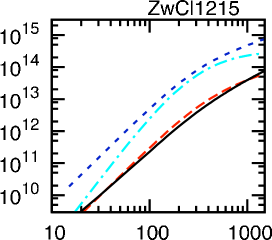
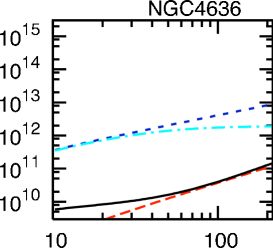
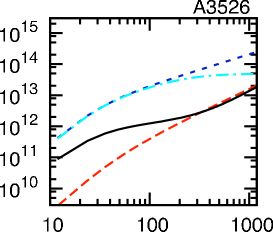
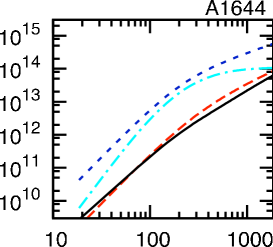
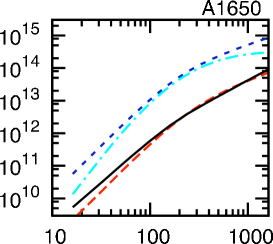
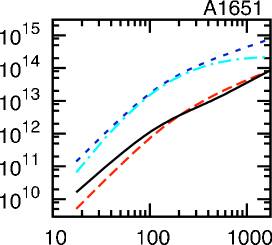
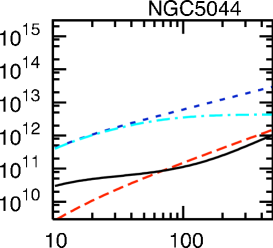
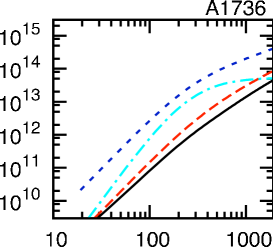
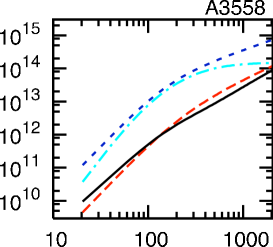
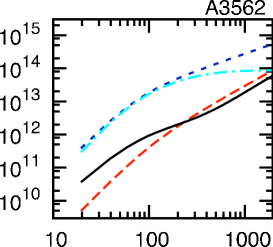
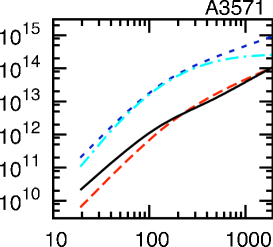
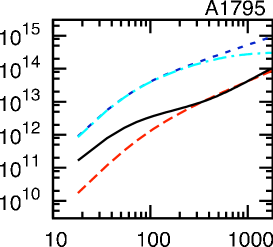
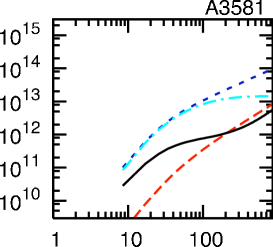
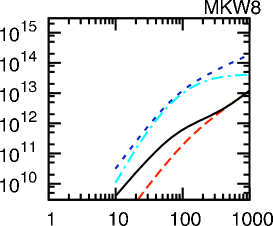
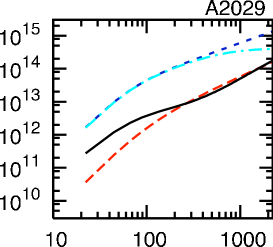
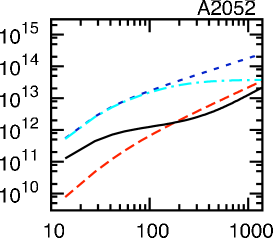
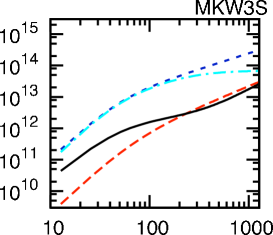
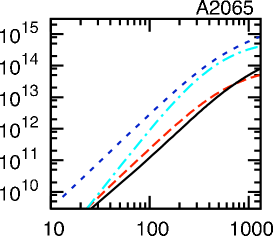
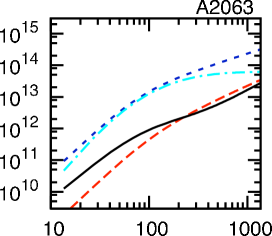
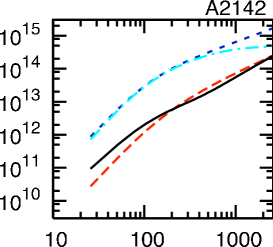
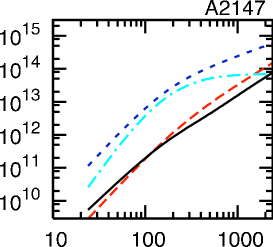
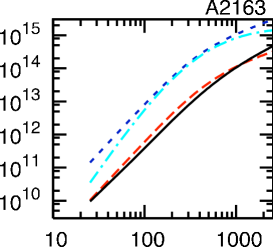
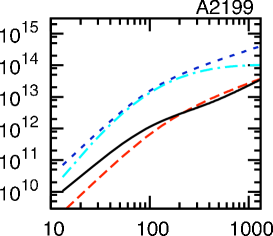
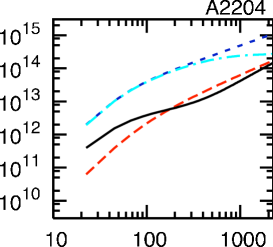
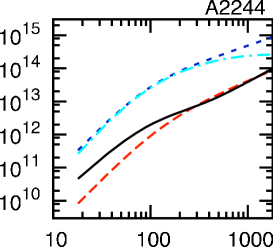
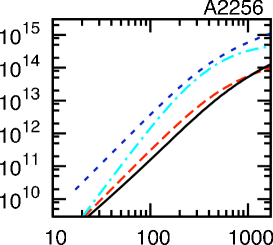
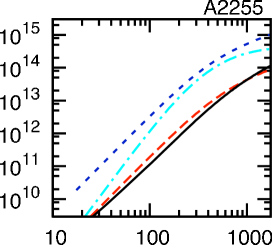
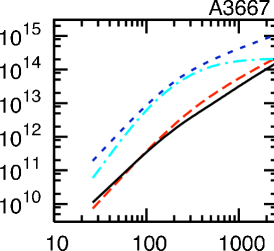
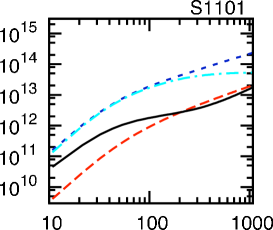
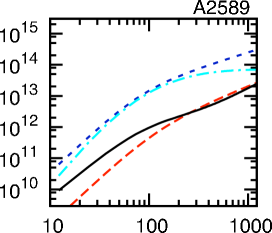
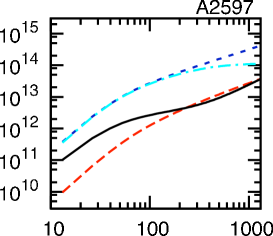
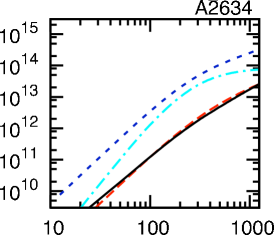
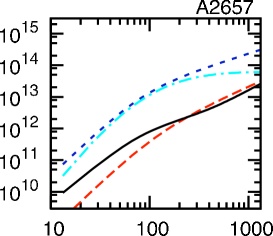
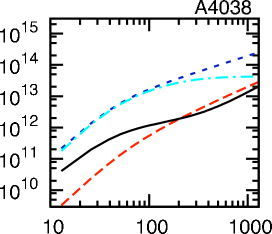
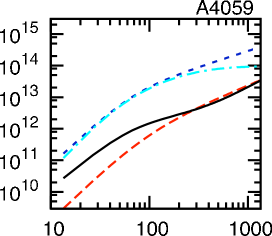
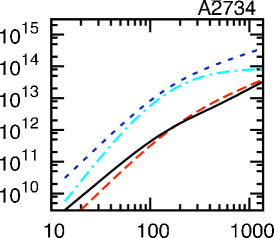
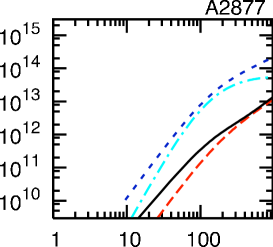
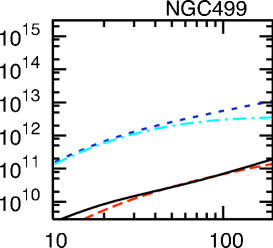
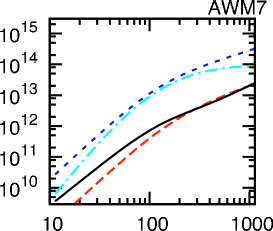
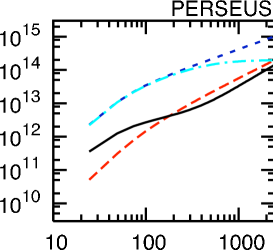
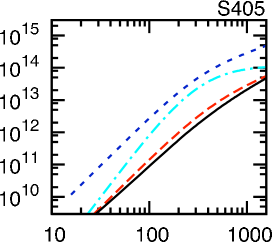
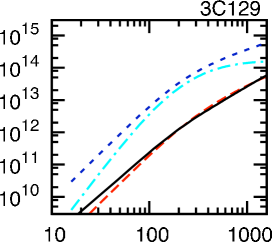
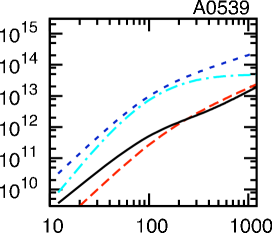
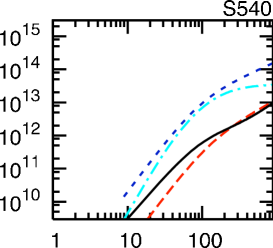
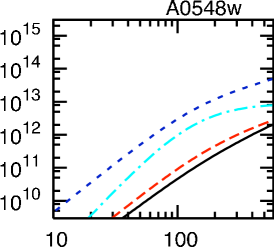
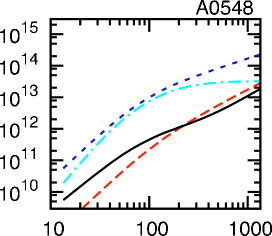
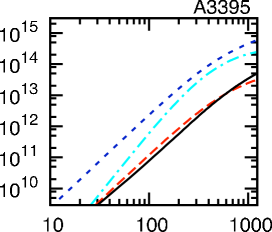
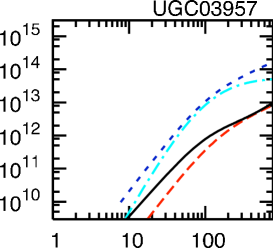
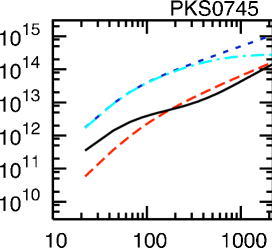
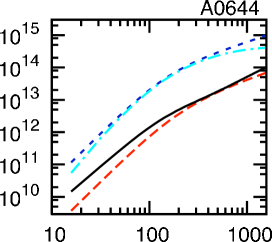
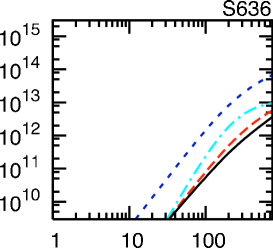
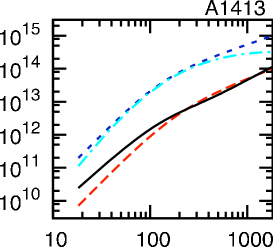
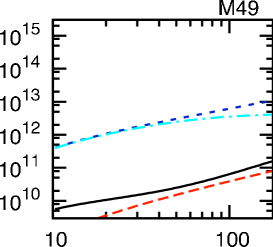
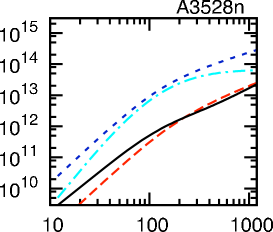
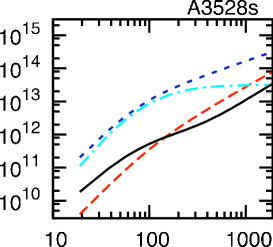
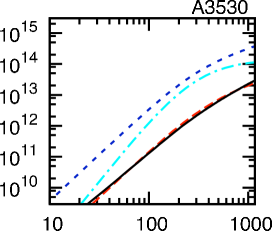
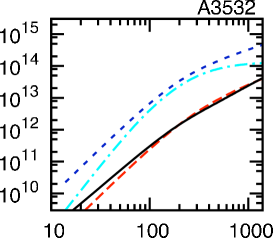
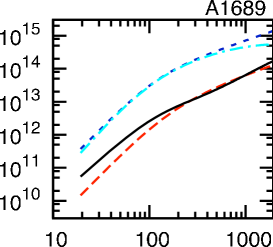
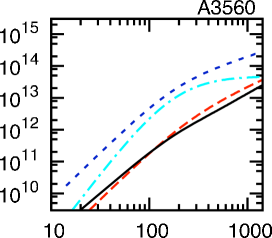
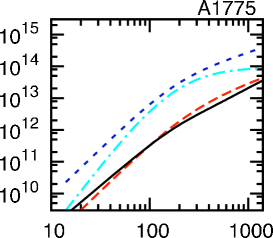
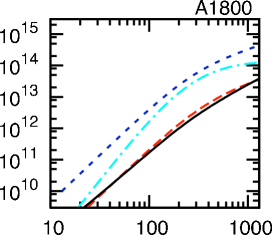
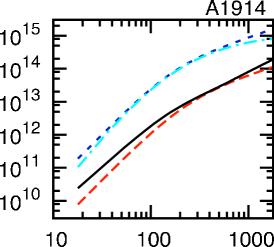
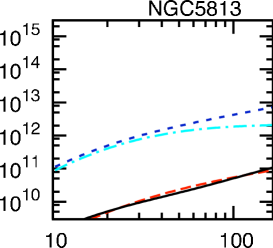
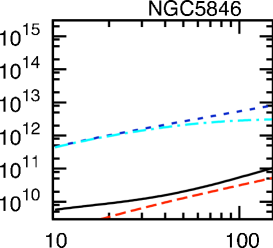
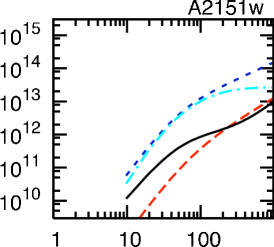
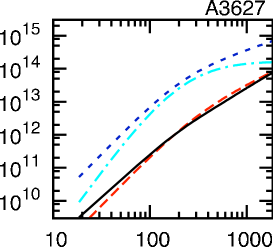
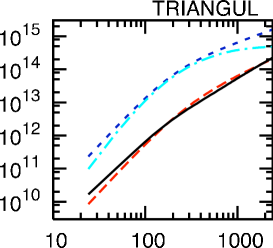
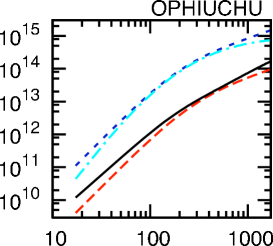
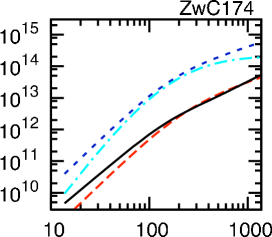
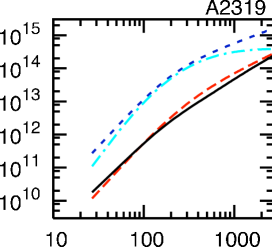
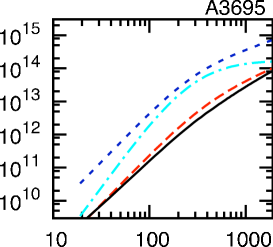
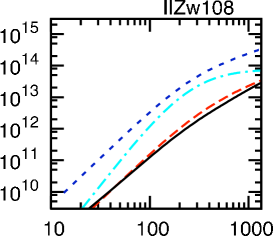
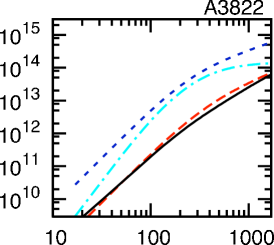
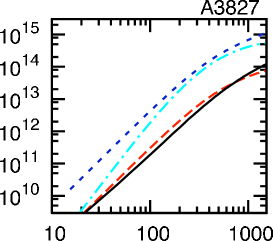
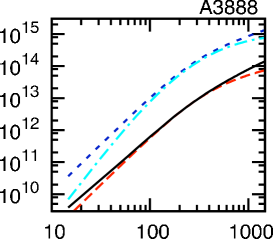
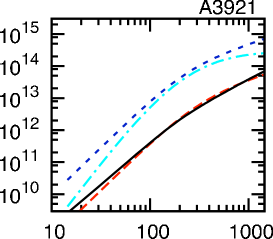
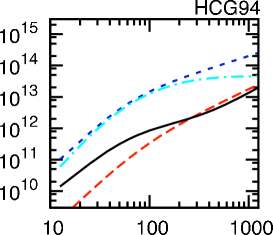
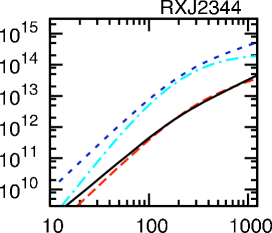
We now turn to the individual mass profiles for each cluster. Since the MSTG prediction for the mass profile has no free parameters upon enforcing equations (33), we need not perform any nonlinear least-squares fitting for the individual mass profiles as shown in Figure 2. The Coma cluster is shown first (with errorbands); and the remaining 105 clusters follow as thumbnails (without errorbands for clarity).
The -model is not always a good fit to the data, however, and so the mass profiles shown in Figure 2 have limited reliability and the results of Table 1 show errors ranging from a few percent to in some cases 100%. Ota & Mitsuda (2002) show that some clusters observed with ROSAT and ASCA are expressed better by the double -model with a second core; while Pointecouteau et al. (2005) show that clusters observed with XMM-Newton are well described by an NFW-type profile (Navarro et al. , 1997) showing strong agreement with CDM simulations. While these more sophisticated mass profile models have their advantages, the simplest isothermal isotropic -model based upon hydrostatic equilibrium has the fewest parameters and we have used it to show that it is possible and meaningful to fit the X-ray galaxy cluster data without the need for exotic dark matter.
There are also controversial measurements concerning the presence of temperature gradients in galaxy clusters (Reiprich & Böhringer, 2002). XMM-Newton is expected to probe the isothermal properties of the galaxy clusters. Early results such as the Arnaud et al. (2001a) study of the XMM-Newton observation of the Coma galaxy cluster and the Arnaud et al. (2001b) study of the XMM-Newton radial temperature profiles support the isothermal assumption deviating only near the cluster center where the observed X-ray temperatures decrease.
In those cases where the uncertainty in the -model parameters are sufficiently small (and therefore the -model provides a suitable fit), the MSTG mass profile traces the ICM gas mass profile down to sufficiently small radii and only deviates where the assumption that the ICM gas mass is isothermal is no longer valid. At sufficiently small radii, the observed X-ray temperatures decrease and thus the MSTG prediction based on an isothermal sphere is too large, confirmed by Figure 2.
6 Conclusions
A gravity theory consisting of a metric-skew-tensor action (MSTG) that leads to the modified acceleration law (Moffat, 2005a, b; Brownstein & Moffat, 2005) can be fitted to a large class of X-ray galaxy cluster mass profiles. The same acceleration law can also be applied to fit a large class of galaxy rotation curves as in Brownstein & Moffat (2005) – which achieved one parameter fits for the case of the photometric observations with a single parameter ; and also parametric fits which required no simplifying assumption on the constancy of (M/L) throughout the galaxy. Whereas MOND provides a good phenomenological fit to galaxy rotation curves, only MSTG fits both galaxy rotation curves and the X-ray galaxy cluster mass profiles without the need of introducing a non-baryonic dark matter component.
In addition, whereas MOND necessitates the asymptotic “flat rotation” velocity out to infinity, MSTG only gives the appearance of a “flat rotation” velocity within the confines of the galaxy and returns to the familiar Newton-Kepler form at large distances. Using the Sloan Digital Sky Survey (SDSS), Prada et al. (2003) have studied the velocities of satellites orbiting isolated galaxies. They detected approximately 3000 satellites, and they found that the line-of-sight velocity dispersion of satellites declines with distance to the primary. The velocity was observed to decline to a distance of kpc for the available data. This result contradicts the constant velocity prediction equation of MOND, but is consistent with the MSTG prediction.
The newest results from XMM-Newton reveal that the mass profiles of X-ray clusters show a steady rise out to the limit of X-ray observations (Pointecouteau et al. , 2005) and do not show the convergent behavior of MOND isothermal spheres. However, the XMM-Newton results are consistent with the MSTG isothermal sphere whose densities fall off as without unseen non-baryonic dark matter. Further results from XMM-Newton may reveal that the temperature profiles of X-ray clusters are not everywhere isothermal; and observed gradients may add a greater understanding of the physics of X-ray clusters of galaxies and the law of gravitation that best describes these largest of virialized objects.
Acknowledgments
This work was supported by the Natural Sciences and Engineering Research Council of Canada. We thank Thomas H. Reiprich for supplying the data for our galaxy cluster sample via electronic table111http://www.astro.virginia.edu/~thr4f/act/gcs/.
References
- Aguirre et al. (2001) Aguirre, A., Schaye, J. & Quataert, E. 2001, ApJ, 561, 550
- Arnaud et al. (2001a) Arnaud, M. et al. 2001, A&A, 365, L67
- Arnaud et al. (2001b) Arnaud, M., Neumann D. M., Aghanim, N., Gastaud, R., Majerowicz, S. & Hughes, J. P. 2001, A&A, 365, L80
- Brownstein & Moffat (2005) Brownstein, J. R. & Moffat, J. W. 2005, ApJ, submitted (astro-ph/0506370)
- Cavaliere & Fusco-Femiano (1976) Cavaliere, A. L. & Fusco-Femiano, R. 1976, A&A, 49, 137
- Chandrasekhar (1960) Chandrasekhar, S. 1960, Principles of Stellar Dynamics, Dover, New York
- Eidelman et al. (2004) Eidelman, S. et al. 2004, Phys. Lett. B592, 1, 2005 update (http://pdg.lbl.gov)
- King (1966) King, I. R. 1966, AJ, 71, 64
- Milgrom (1983) Milgrom, M. 1983, ApJ, 270, 365
- Milgrom (1984) Milgrom, M. 1983, ApJ, 287, 571
- Moffat (2005a) Moffat, J. W. 2005, J. Cosmology Astropart. Phys., 05, 003
- Moffat (2005b) Moffat, J. W. 2005, preprint (gr-qc/0506021)
- Navarro et al. (1997) Navarro, J. F., Frenk, C. S., & White, S. D. M. 1997, ApJ, 490, 493
- Ota & Mitsuda (2002) Ota, N. & Mitsuda, K. 2002, ApJ, 567, L23
- Pointecouteau et al. (2005) Pointecouteau, E., Arnaud, M. & Pratt, G. W. 2005, A&A, 435, 1
- Pointecouteau & Silk (2005) Pointecouteau, E. & Silk, J. 2005, MNRAS, submitted (astro-ph/0505017)
- Prada et al. (2003) Prada, F. et al. 2003, ApJ, 598, 260
- Reiprich (2001) Reiprich, T. H. 2001, Ph.D. Dissertation, Cosmological Implications and Physical Properties of an X-Ray Flux-Limited Sample of Galaxy Clusters, Ludwig-Maximilians-Universität München
- Reiprich & Böhringer (2002) Reiprich, T. H. & Böhringer, H. 2002, ApJ, 567, 716
- Reuter & Weyer (2004a) Reuter, M. & Weyer, H. 2004, J. Cosmology Astropart. Phys., 12, 001
- Reuter & Weyer (2004b) Reuter, M. & Weyer, H. 2004, Phys. Rev. D69, 104022
- Sanders (2003) Sanders, R. H. 2003, MNRAS, 342, 901
- Sanders & McGaugh (2002) Sanders, R. H. & McGaugh, S. S. 2002, ARA&A40, 263
- The & White (1988) The L. S. & White S, D. M. 1988, AJ, 95, 1642
- Zwicky (1933) Zwicky, F. 1933, Helv. Phys. Acta., 6, 110
 |
 |
 |
 |
 |
 |
 |
 |
 |
 |
 |
 |
 |
 |
 |
 |
 |
 |
 |
 |
Galaxy Cluster Mass Profiles
 |
 |
 |
 |
 |
 |
 |
 |
 |
 |
 |
 |
 |
 |
 |
Galaxy Cluster Mass Profiles
 |
 |
 |
 |
 |
 |
 |
 |
 |
 |
 |
 |
 |
 |
 |
Galaxy Cluster Mass Profiles
 |
 |
 |
 |
 |
 |
 |
 |
 |
 |
 |
 |
 |
 |
 |
Galaxy Cluster Mass Profiles
 |
 |
 |
 |
 |
 |
 |
 |
 |
 |
 |
 |
 |
 |
 |
Galaxy Cluster Mass Profiles
 |
 |
 |
 |
 |
 |
 |
 |
 |
 |
 |
 |
 |
 |
 |
Galaxy Cluster Mass Profiles
 |
 |
 |
 |
 |
 |
 |
 |
 |
 |
 |
 |
 |
 |
 |
Galaxy Cluster Mass Profiles
| Cluster | |||||||||
|---|---|---|---|---|---|---|---|---|---|
| [keV] | [] | [kpc] | [kpc] | [] | [] | [] | [] | ||
| (1) | (2) | (3) | (4) | (5) | (6) | (7) | (8) | (9) | (10) |
| A0085 | 0.34 | ||||||||
| A0119 | 0.03 | ||||||||
| A0133 | 0.42 | ||||||||
| NGC507 | 0.23 | ||||||||
| A0262 | 0.16 | ||||||||
| A0400 | 0.04 | ||||||||
| A0399 | 0.04 | ||||||||
| A0401 | 0.11 | ||||||||
| A3112 | 0.54 | ||||||||
| FORNAX | 0.02 | ||||||||
| 2A0335 | 1.07 | ||||||||
| IIIZw54 | 0.04 | ||||||||
| A3158 | 0.08 | ||||||||
| A0478 | 0.5 | ||||||||
| NGC1550 | 0.15 | ||||||||
| EXO0422 | 0.13 | ||||||||
| A3266 | 0.05 | ||||||||
| A0496 | 0.65 | ||||||||
| A3376 | 0.02 | ||||||||
| A3391 | 0.05 | ||||||||
| A3395s | 0.03 | ||||||||
| A0576 | 0.03 | ||||||||
| A0754 | 0.09 | ||||||||
| HYDRA-A | 0.63 | ||||||||
| A1060 | 0.09 | ||||||||
| A1367 | 0.03 | ||||||||
| MKW4 | 0.57 | ||||||||
| ZwCl1215 | 0.05 | ||||||||
| NGC4636 | 0.33 | ||||||||
| A3526 | 0.29 | ||||||||
| A1644 | 0.04 | ||||||||
| A1650 | 0.08 | ||||||||
| A1651 | 0.15 | ||||||||
| COMA | 0.06 | ||||||||
| NGC5044 | 0.67 | ||||||||
| A1736 | 0.03 | ||||||||
| A3558 | 0.09 | ||||||||
| A3562 | 0.11 | ||||||||
| A3571 | 0.14 | ||||||||
| A1795 | 0.5 | ||||||||
| A3581 | 0.31 | ||||||||
| MKW8 | 0.05 | ||||||||
| A2029 | 0.56 | ||||||||
| A2052 | 0.52 | ||||||||
| MKW3S | 0.31 | ||||||||
| A2065 | 0.04 | ||||||||
| A2063 | 0.12 | ||||||||
| A2142 | 0.27 | ||||||||
| 15 | 0.03 | ||||||||
| A2163 | 0.1 | ||||||||
| A2199 | 0.16 | ||||||||
| A2204 | 0.99 | ||||||||
| A2244 | 0.23 | ||||||||
| A2256 | 0.05 | ||||||||
| A2255 | 0.03 | ||||||||
| A3667 | 0.07 |
X-ray Cluster Properties of the Complete Sample: Cluster [keV] [] [kpc] [kpc] [] [] [] [] (1) (2) (3) (4) (5) (6) (7) (8) (9) (10) S1101 0.55 A2589 0.12 A2597 0.71 A2634 0.02 A2657 0.1 A4038 0.26 A4059 0.2 A2734 0.06 A2877 0.03 NGC499 0.2 AWM7 0.09 PERSEUS 0.63 S405 0.02 3C129 0.03 A0539 0.06 S540 0.08 A0548w 0.02 A0548 0.05 A3395 0.02 UGC03957 0.09 PKS0745 0.97 A0644 0.15 S636 0.01 A1413 0.19 M49 0.26 A3528n 0.07 A3528s 0.09 A3530 0.03 A3532 0.05 A1689 0.33 A3560 0.03 A1775 0.06 A1800 0.04 A1914 0.22 NGC5813 0.18 NGC5846 0.47 A2151w 0.16 A3627 0.04 TRIANGUL 0.1 OPHIUCHU 0.13 ZwC174 0.1 A2319 0.1 A3695 0.04 IIZw108 0.03 A3822 0.04 A3827 0.05 A3888 0.1 A3921 0.07 HCG94 0.11 RXJ2344 0.07 Note — We have adopted the compilation of Reiprich (2001); Reiprich & Böhringer (2002) as our sample. Column (1) Galaxy cluster name (truncated to 8 characters) Column (6) radius where Column (2) X-ray temperature Column (7) ICM gas mass integrated to Column (3) ICM central mass density Column (8) Newtonian dynamic mass integrated to Column (4) -model parameter Column (9) MSTG dynamic mass integrated to Column (5) -model core radius parameter Column (10) convergent MOND dynamic mass