Observations of Selected AGN with H.E.S.S.
A sample of selected active galactic nuclei (AGN) was observed in 2003 and 2004 with the High Energy Stereoscopic System (H.E.S.S.), an array of imaging atmospheric-Cherenkov telescopes in Namibia. The redshifts of these candidate very-high-energy (VHE, 100 GeV) -ray emitters range from =0.00183 to =0.333. Significant detections were already reported for some of these objects, such as PKS 2155304 and Markarian 421. Marginal evidence (3.1) for a signal is found from large-zenith-angle observations of Markarian 501, corresponding to an integral flux of I(1.65 TeV) = (1.50.6stat0.3syst) 10-12 cm-2 s-1 or 15% of the Crab Nebula flux. Integral flux upper limits for 19 other AGN, based on exposures of 1 to 8 hrs live time, and with average energy thresholds between 160 GeV and 610 GeV, range from 0.4% to 5.1% of the Crab Nebula flux. All the upper limits are the most constraining ever reported for these objects.
Key Words.:
Galaxies: active - BL Lacertae objects: Individual - Gamma rays: observations1 Introduction
Active galactic nuclei are known to emit radiation over the entire electromagnetic spectrum, from radio waves to TeV -rays. These objects, which are found in only a small fraction of the total number of observed galaxies, are very luminous, extremely compact, and can exhibit large luminosity variations on time scales ranging from less than an hour up to several years. Although AGN differ widely in their observed characteristics, a unified description (as reviewed in Urry & Padovani (1995)) has emerged in which an AGN consists of a super-massive black hole ( solar masses) surrounded in the inner regions by an accretion disk, and in the outer regions by a thick torus of gas and dust. In some AGN (the radio-loud population, 10%), a highly relativistic outflow of energetic particles exists approximately perpendicular to the accretion disk and torus plane. This flow forms collimated radio-emitting jets which generate the non-thermal emission observed from radio to -rays. It is believed that some of the numerous AGN classifications result from viewing these objects at various orientation angles with respect to the torus plane. Essentially all AGN detected at VHE energies (shown in order of redshift with references in Table 1) are radio-loud objects of the BL Lacertae (BL Lac) type, which have their jet pointed close to the observer’s line of sight. An exception to this exists with the detection of the Fanaroff-Riley type I radio galaxy M 87 at VHE energies. Although M 87 is believed to be a mis-aligned BL Lac M87_misalign (Tsvetanov et al. 1998), it is not clear whether the VHE emission comes from the jet or the central object.
| AGN | Reference | H.E.S.S. Reference | |
|---|---|---|---|
| M 87 | 0.004 | Aharonian et al. (2003) | Beilicke et al. (2005) |
| Markarian 421 | 0.030 | Punch et al (1992) | Aharonian et al. (2005c) |
| Markarian 501 | 0.034 | Quinn et al (1996) | |
| 1ES 2344+514 | 0.044 | Catanese et al. (1998) | |
| 1ES 1959+650 | 0.047 | Nishiyama et al. (1999) | |
| PKS 2005-489 | 0.071 | Aharonian et al. (2005b) | |
| PKS 2155-304 | 0.116 | Chadwick et al. (1999a) | Aharonian et al. (2005a) |
| 1ES 1426+428 | 0.129 | Horan et al. (2002) |
The known VHE AGN have helped to constrain significantly the models for production of VHE -rays through spectral and variability studies. However, there are still many differing models that describe the present data, making a larger sample of known VHE AGN necessary to make more definitive conclusions. Also, VHE photons are absorbed by interactions on the extragalactic background light (EBL) leading to an energy dependent horizon for viewing VHE sources. The energy spectrum of VHE AGN may exhibit characteristics, such as steepening of the spectrum and a cutoff, as a result of this absorption. Interpretation of such features can be used as a probe of the EBL in the optical and near-IR regimes (Stecker, de Jager & Salamon (1992); Schroedter (2005)), for which direct measurements are dominated by large systematic uncertainties. Since such an interpretation is complicated by discerning which features are a result of EBL absorption and which are intrinsic to the object, a large data set of VHE AGN at differing redshifts are needed to ascertain which effects can be attributed to the EBL.
A large sample of AGN located at z0.333 was observed by H.E.S.S. in 2003 and 2004. Most of these objects are BL Lacs, many of which are suggested as good candidates for detection as VHE emitters (Costamante & Ghisellini (2002); Perlman (1999); Stecker, de Jager & Salamon (1996)). A sample of nearby non-blazar AGN, like M 87, was also observed with the hope of extending the known VHE-bright AGN to other classes. These include a set of famous radio-loud galaxies, characterized by resolved radio, optical and X-ray jets (Cen A, Pictor A, 3C 120, and the quasar 3C 273) and a sample of radio-weak objects (the Seyfert galaxies NGC 1068, NGC 3783 and NGC 7469). The detections resulting from the H.E.S.S. AGN observation program have been reported elsewhere (see Table 1 for references). These include the confirmation of the VHE emission seen from M 87 and PKS 2155304, the detection of Markarian 421 using large-zenith-angle observations, and the discovery of VHE emission from PKS 2005489. Flux upper limits, the strongest ever produced, from the non-detection of the remaining objects are presented here.
2 H.E.S.S. Detector
The H.E.S.S. experiment, a square array (120 m side) of four imaging atmospheric-Cherenkov telescopes located in the Khomas Highland of Namibia (23∘ 16’ 18” S, 16∘ 30’ 1” E, 1800 m above sea level), uses stereoscopic observations of -ray induced air showers to search for astrophysical -ray emission above 100 GeV. Each telescope has a 107 m2 tessellated mirror dish and a 5∘ field-of-view (f.o.v.) camera consisting of 960 individual photomultiplier pixels. The sensitivity of H.E.S.S. (5 in 25 hours for a 1% Crab Nebula flux source at 20∘ zenith angle) allows for detection of VHE emission from objects at previously undetectable flux levels. More details on H.E.S.S. can be found in Bernlöhr et al. (2003), Funk et al. (2004), Hofmann (2003), and Vincent et al. (2003).
3 Observations
The H.E.S.S. observations of AGN in 2004 use the full four-telescope array. For some of the data, individual telescopes were excluded from the observations or analysis due to hardware problems. Also, 2003 observations of 1ES 0323+022 were made prior to the completion of the array and thus use only two or three telescopes. While the sensitivity of H.E.S.S. is less during observations with fewer telescopes, it is still unprecedented. Table 2 shows the candidate AGN observed by H.E.S.S. and gives details of the observations that pass selection criteria which remove data for which the weather conditions were poor or the hardware was not functioning properly. The data were taken in 28 minute runs using Wobble mode, i.e. the source direction is offset, typically by 0.5∘, relative to the center of the f.o.v. of the camera during observations, which allows for both on-source observations and simultaneous estimation of the background induced by charged cosmic rays. As the energy threshold of H.E.S.S. observations increases with zenith angle, the mean zenith angle of the exposure for each of the AGN along with the corresponding average energy threshold (after selection cuts) of those observations is also shown in Table 2. It should be noted that the H.E.S.S. Monte Carlo simulations show that the azimuthal angle at which an object is observed has a small effect on the energy threshold of observations. Sources which culminate in the south (i.e. those with declination less than the latitude of H.E.S.S.) have slightly higher energy thresholds (e.g. compare 1ES 0323+022 with Pictor A).
| Object | Type | Ntel | Nruns | T | Zobs | Eth | On | Off | Norm | Excess | S | |||
|---|---|---|---|---|---|---|---|---|---|---|---|---|---|---|
| [hh mm ss] | [dd mm ss] | [hrs] | [∘] | [GeV] | [] | |||||||||
| BL Lacs | ||||||||||||||
| 1ES 0145+138 | 01 48 29.8 | +14 02 19 | 0.125 | BL | 3,4 | 12 (4,8) | 4.3 (1.5,2.8) | 40 | 310 | 206 | 2287 | 0.08953 | 1.2 | 0.1 |
| 1ES 0229+200 | 02 32 48.6 | +20 17 17 | 0.140 | BL | 4 | 2 | 0.8 | 46 | 410 | 24 | 280 | 0.09077 | 1.4 | 0.3 |
| 1ES 0323+022 | 03 26 14.0 | +02 25 15 | 0.147 | BL | 2∗,3,4 | 12 (3,3,6) | 4.7 (1.3,1.1,2.3) | 29 | 210 | 279 | 3009 | 0.09034 | 7.2 | 0.4 |
| PKS 0548322 | 05 50 40.6 | 32 16 16 | 0.069 | BL | 4 | 11 | 4.1 | 20 | 190 | 340 | 3321 | 0.09065 | 39.0 | 2.1 |
| EXO 0556.43838 | 05 58 06.2 | 38 38 27 | 0.034 | BL | 4 | 3 | 1.2 | 33 | 250 | 101 | 934 | 0.08968 | 17.2 | 1.7 |
| RGB J0812+026 | 08 12 01.9 | +02 37 33 | — | BL | 3,4 | 4 (2,2) | 0.7 (0.5,0.2) | 30 | 220 | 44 | 519 | 0.08999 | 2.7 | 0.4 |
| RGB J1117+202 | 11 17 06.2 | +20 14 07 | 0.139 | BL | 3,4 | 9 (3,6) | 3.8 (1.2,2.6) | 52 | 610 | 155 | 1703 | 0.08990 | 1.9 | 0.1 |
| 1ES 1440+122 | 14 42 48.3 | +12 00 40 | 0.162 | BL | 4 | 2 | 0.9 | 38 | 290 | 59 | 633 | 0.08955 | 2.3 | 0.3 |
| Markarian 501 | 16 53 52.2 | +39 45 37 | 0.034 | BL | 4 | 4 | 1.8 | 64 | 1650 | 95 | 742 | 0.09017 | 28.1 | 3.1 |
| RBS 1888 | 22 43 42.0 | 12 31 06 | 0.226 | BL | 4 | 6 | 2.6 | 15 | 170 | 190 | 2330 | 0.08958 | 18.7 | 1.3 |
| Q J225482725 | 22 54 53.2 | 27 25 09 | 0.333 | BL | 4 | 5 | 2.1 | 13 | 170 | 200 | 2294 | 0.08986 | 6.1 | 0.4 |
| PKS 2316423 | 23 19 05.9 | 42 06 49 | 0.055 | BL | 4 | 5 | 2.2 | 21 | 190 | 169 | 2032 | 0.08952 | 12.9 | 0.9 |
| 1ES 2343151 | 23 45 37.8 | 14 49 10 | 0.226 | BL | 3,4 | 6 (2,4) | 2.6 (0.9,1.7) | 11 | 160 | 235 | 2652 | 0.08966 | 2.8 | 0.2 |
| Radio-Loud Galaxies | ||||||||||||||
| 3C 120 | 04 33 11.1 | +05 21 16 | 0.033 | FR I | 4 | 12 | 5.0 | 32 | 230 | 232 | 3023 | 0.09087 | 42.7 | 2.5 |
| Pictor A | 05 19 49.7 | 45 46 45 | 0.034 | FR II | 4 | 18 | 7.4 | 27 | 220 | 516 | 5451 | 0.09041 | 23.2 | 1.0 |
| 3C 273 | 12 29 06.7 | +02 03 09 | 0.158 | FSRQ | 4 | 9 | 3.9 | 37 | 280 | 245 | 2634 | 0.08978 | 8.5 | 0.5 |
| Cen A | 13 25 27.6 | 43 01 09 | 0.00183 | FR I | 4 | 10 | 4.2 | 21 | 190 | 465 | 7065 | 0.06461 | 8.5 | 0.4 |
| Radio-Weak Galaxies | ||||||||||||||
| NGC 1068 | 02 42 40.8 | 00 00 48 | 0.00379 | Sy II | 4 | 10 | 4.3 | 27 | 210 | 246 | 2580 | 0.09047 | 12.6 | 0.8 |
| NGC 3783 | 11 39 01.8 | 37 44 19 | 0.00965 | Sy I | 2∗,3,4 | 5 (1,2,2) | 1.8 (0.4,0.8,0.8) | 27 | 220 | 106 | 1205 | 0.08947 | 1.8 | 0.2 |
| NGC 7469 | 23 03 15.8 | +08 52 26 | 0.016 | Sy I | 4 | 10 | 4.3 | 33 | 250 | 271 | 3373 | 0.08962 | 31.2 | 1.8 |
4 Analysis Technique
The data passing the run selection criteria are calibrated as detailed in Aharonian et al. (2004b), and the event reconstruction and background rejection are performed as described in Aharonian et al. (2005a), with some minor improvements discussed in Aharonian et al. (2005b). The background is estimated using all events passing selection cuts in a number of circular off-source regions offset by the same distance, relative to the center of the f.o.v., in the sky as the on-source region (for more details see Aharonian et al. (2001)). The on-source region, the size of which is optimized for the detection of point sources, is a circle of radius 0.11∘ centered on the source, and each off-source region has approximately111The off-source data are first placed into a pixelated two-dimensional map and then integrated in an approximate circle for each region. The difference in total area is of order 1%. the same area as the on-source region. The maximum number of non-overlapping off-source regions fitting in the field of view are used. An area around the on-source position, completely containing the H.E.S.S. point-spread-function, is excluded to eliminate possible contamination from poorly reconstructed -rays. For the typical on-source offset of 0.5∘, eleven off-source regions are possible. In the case of observations of Cen A, offset by 0.7∘, sixteen regions are used. The statistical error on the background measurement is reduced by the use of a larger background sample, and there is no need for a radial acceptance correction, which accounts for the strongest acceptance change across the f.o.v., since the off-source regions are offset by the same radial distance as the on-source region. The significance of any excess is calculated following the method of Equation (17) in Li & Ma (1983) and all upper limits are determined using the method of Feldman & Cousins (1998).
5 Results
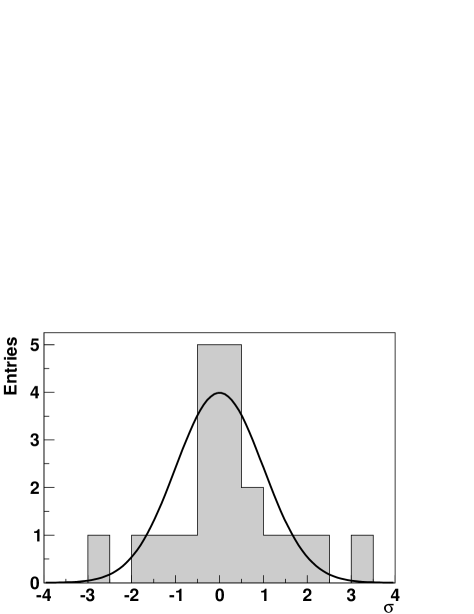
Figure 1 shows the distribution of the significance observed from the direction of each of the twenty AGN. No significant excess of VHE -rays is found from any of the AGN in the given exposure time (8 hrs each), with the possible exception of Markarian 501 (3.1). Specific details of the results for each AGN are shown in Table 2. Additionally, a search for serendipitous source discoveries in the H.E.S.S. f.o.v. centered on each of the AGN yielded no significant excess.
Given that it is well established that Markarian 501 is a VHE -ray emitter, the excess (3.1) from the only night (MJD 53172) of observations of Markarian 501 can be treated as significant and a flux calculated. Assuming the spectrum measured above 1.5 TeV by the High Energy Gamma Ray Astronomy (HEGRA) experiment HEGRA_501 (Bradbury et al. 1997), a power law with a photon index of =2.6, the corresponding integral flux above the 1.65 TeV energy threshold is I(1.65 TeV) = (1.50.6stat0.3syst) 10-12 cm-2 s-1 or 15% of the H.E.S.S. Crab Nebula flux above this threshold. While the VHE flux from Markarian 501 is known to be highly variable, the measured flux is similar to the value reported in Bradbury et al. (1997).
| Object | Eth | I(Eth) | Crab | Previous Observations | |
|---|---|---|---|---|---|
| [GeV] | [10-12 cm-2 s-1] | % | |||
| BL Lacs | |||||
| 1ES 0145+138 | 0.125 | 310 | 2.11 | 1.5 | HEGRA, Whipplec |
| 1ES 0229+200 | 0.140 | 410 | 2.76 | 3.1 | HEGRA, Whippleb,c, Milagro |
| 1ES 0323+022 | 0.147 | 210 | 3.92 | 1.5 | HEGRA, Whipplec, Mark VIa, Milagro |
| PKS 0548322 | 0.069 | 190 | 6.65 | 2.2 | Whipplea, CANGAROOa,b,d, Mark VIb |
| EXO 0556.43838 | 0.034 | 250 | 10.1 | 5.1 | |
| RGB J0812+026 | — | 220 | 7.49 | 3.1 | Milagro |
| RGB J1117+202 | 0.139 | 610 | 1.44 | 3.0 | HEGRA, Whippleb, Milagro |
| 1ES 1440+122 | 0.162 | 290 | 5.11 | 3.3 | HEGRA, Milagro |
| RBS 1888 | 0.226 | 170 | 3.19 | 0.9 | |
| Q J225482725 | 0.333 | 170 | 5.83 | 1.6 | |
| PKS 2316423 | 0.055 | 190 | 4.13 | 1.4 | Whipplea, CANGAROOa, Mark VIa |
| 1ES 2343151 | 0.226 | 160 | 6.43 | 1.6 | |
| Radio-Loud Galaxies | |||||
| 3C 120 | 0.033 | 230 | 0.92 | 0.4 | HEGRA |
| Pictor A | 0.034 | 220 | 3.33 | 1.4 | |
| 3C 273 | 0.158 | 280 | 2.90 | 1.8 | HEGRA, Whipplea |
| Cen A | 0.00183 | 190 | 5.68 | 1.9 | CANGAROOc, Mark VIa |
| Radio-Weak Galaxies | |||||
| NGC 1068 | 0.00379 | 210 | 3.28 | 1.3 | |
| NGC 3783 | 0.00965 | 220 | 6.04 | 2.5 | |
| NGC 7469 | 0.016 | 250 | 1.27 | 0.6 |
For the remaining undetected AGN, 99.9% upper limits on the integral flux (assuming a power law spectrum with =3.0) above the energy threshold of the observations, and references to previously published limits (when available), are shown in Table 3. The photon index, =3.0, was chosen for two reasons: First, the recently measured VHE spectra of several AGN (e.g. PKS 2155304, PKS 2005489) are softer than the Crab Nebula-like index of =2.5 often used for VHE upper limits in past publications. Second, the softer index was chosen to account for the possible steepening of the observed spectra of the AGN due to the absorption of -rays on the EBL. Assuming a different photon index (i.e. between 2.5 and 3.5) has less than a 10% effect on the reported limits, and the systematic error on the upper limits is estimated to be 20%. The percentage of the Crab Nebula flux shown in Table 3 is calculated relative to the integral flux, above the same threshold, determined from the H.E.S.S. Crab Nebula spectrum. The H.E.S.S. limits are considerably (5 times) stronger than any reported to date. However, due to the generally variable nature of AGN emission, these upper limits constrain the maximum average brightness of the AGN only during the observation time. Hence they are limits on the steady-component or quiescent flux from the AGN. Future flaring behavior may increase the VHE flux from any of these AGN to significantly higher levels.
A search for VHE flux variability from each observed AGN was also performed. Here the nightly integral flux above the average energy threshold was calculated assuming a photon index of =3.0 and fit by a constant. Any flaring behavior would be demonstrated in the form of a poor probability for the fit. Table 4 shows the dates each AGN was observed and the resulting probability. As can be seen, no evidence for VHE flux variability is found.
| Object | MJD50000 | P() |
| BL Lacs | ||
| 1ES 0145+138 | 3202,3205,3210-14 | 0.85 |
| 1ES 0229+200 | 3317 | - |
| 1ES 0323+022 | 2904-05,3267 | 0.87 |
| PKS 0548322 | 3296,3299-300,3303 | 0.83 |
| EXO 0556.43838 | 3347,3354 | 0.67 |
| RGB J0812+026 | 3081 | - |
| RGB J1117+202 | 3054,3112,3114,3116 | 0.85 |
| 1ES 1440+122 | 3110,3119 | 0.13 |
| RBS 1888 | 3207-08,3210 | 0.72 |
| Q J225482725 | 3201,3210-11 | 0.90 |
| PKS 2316423 | 3201,3207-08 | 0.50 |
| 1ES 2343151 | 3211-13 | 0.71 |
| Radio-Loud Galaxies | ||
| 3C 120 | 3316-19,3353-55 | 0.81 |
| Pictor A | 3269,3318-19,3351,3353-54 | 0.35 |
| 3C 273 | 3109-10,3148-49 | 0.25 |
| Cen A | 3111-13 | 0.13 |
| Radio-Weak Galaxies | ||
| NGC 1068 | 3290,3292-94,3296 | 0.55 |
| NGC 3783 | 3107-08 | 0.52 |
| NGC 7469 | 3202,3206,3211-12 | 0.89 |
The lack of any significant VHE detection or flaring behavior is perhaps expected from the beahvior of the individual AGN in the X-ray regime. Quick-look results provided by ASM/RXTE team show that none of the AGN (for which all-sky monitor data exists) were particularly active during the dates of the H.E.S.S. observations. On these dates, the measured daily average count rate from each AGN never deviated by more than 2 from the mean value averaged over the whole X-ray data set.
6 Discussion
Since AGN are known to emit radiation in all wavebands, understanding and modelling their emission must take into account their entire spectral energy distribution (SED). Constraining any model is difficult as only a limited number of high-energy measurements currently exist (see Fichtel et al. (1994) for EGRET upper limits on blazars, Seyfert galaxies and radio-loud galaxies). This is especially true at VHE energies, making the upper limits presented in Table 3 quite useful due to their unprecedented strength. While such modelling is beyond the scope of this paper, the applicability and usefulness of the limits for each of the three classes of observed AGN are discussed.
6.1 BL Lacs
BL Lacs belong to the sub-class of radio-loud AGN known as blazars, which are AGN thought to possess a jet which is viewed close to the line of sight (Urry & Padovani (1995)). The distinction between BL Lacs and other blazars is primarily based on their optical spectra which are characterized by weak or absent emission lines. As mentioned in the introduction, almost all VHE bright AGN belong to this class. These AGN have dominantly non-thermal emission and are characterized by a double-humped SED. The low-energy component is widely accepted as originating from synchrotron radiation of relativistic electrons in the magnetic field around the object. However, the origin of the high-energy component is the subject of much debate. Various models involving either leptonic or hadronic processes have been proposed and can be constrained using the H.E.S.S. results. However, some caveats are required for interpreting a blazar SED with the H.E.S.S. upper limits.
Blazars are known to be highly variable at all wavelengths, typically characterized by low-emission quiescent states interrupted by periods of flaring behavior where the flux increases dramatically. In some cases this increase is several orders of magnitude. Due to this extreme variability, it has been shown that fitting the SED of blazars has very large uncertainties when non-simultaneous multiwavelength (MWL) data are used (see e.g. Böttcher, Mukherjee & Reimer (2002)). As a result the usefulness of non-simultaneous upper limits, as is the case for the H.E.S.S. observations, in modelling these object is limited. The H.E.S.S. upper limits, in the absence of simultaneous MWL data, are only relevant for modelling the quiescent state of the blazar using archival low-state MWL data. An additional problem using these upper limits arises due to the absorption of VHE photons on the EBL. The upper limit on the flux intrinsic to the object can be significantly higher than those presented in Table 3 depending on the redshift. As a result the upper limits must have the effects of the EBL removed before they can be used for modelling. Unfortunately, parameterizations of the EBL are poorly constrained leading to numerous models with dramatically different behaviors, adding another significant uncertainty when using VHE upper limits to help model blazar emission. Given the wide range of EBL interpretations, this deabsorption is not performed here.
Taking note of the caveats regarding the effects of the EBL and the issues with non-simultaneous observations, a comparison of the upper limits is made, where possible, to three sets of VHE flux predictions based on the SEDs of blazars. The first set (Stecker, de Jager & Salamon (1996)), referred to as SDS henceforth, uses simple scaling arguments to predict VHE fluxes for Einstein Slew survey objects. In the case of the SDS flux predictions the effects of EBL absorption are already accounted for with an ”averaged” model. The other two sets of predictions are taken from Costamante & Ghisellini (2002). The first, referred to as FOS, uses a phenomenological description of the average SED of blazars based on their bolometric luminosity Fossati (Fossati et al. 1998), modified by Donato et al. (2001), and derives predictions on the basis of the individual blazar’s radio luminosity and synchrotron peak frequency. The second, referred to as CG, uses fits of a synchrotron self-Compton model to existing multiwavelength data. Both the FOS and CG predictions do not have the effects of EBL absorption accounted for. This could change the flux predictions by factors of 5 above 300 GeV and by factors 100 above 1 TeV for objects at 0.2.
Table 5 shows the 99.9% H.E.S.S. flux upper limits extrapolated (assuming ) to above 300 GeV and above 1 TeV, as well as which predictions are available above these thresholds. The H.E.S.S. upper limits are below the SDS predictions above 300 GeV in three of the five cases (factors ranging from 2 to 5), and below two of the five predictions above 1 TeV (factors of 1.3 and 5). Even if the EBL absorption effects are accounted for in the SDS predictions, the discrepancies can easily be accounted for by the aforementioned simultaneity caveats and thus the H.E.S.S. upper limits do not make any strong statements regarding the SDS predictions. All the FOS predictions are above the H.E.S.S. upper limits, from factors of 1.4 to 16 for the predictions above 300 GeV and factors of 5 to 40 for the predictions above 1 TeV. While at first this seems severe, accounting for TeV absorption can reduce these discrepancies dramatically. In addition the FOS predictions are claimed to be more suitable for ”high” state VHE flux predictions, whereas the H.E.S.S. upper limits are most appropriate for constraining the quiescent state of the AGN. Given that variability of up to two orders of magnitude have been seen in VHE blazars such as Markarian 421, it is clear that it is again difficult to test these predictions with the H.E.S.S. upper limits. However, the disagreement suggests that different sets of parameters might be necessary to account for the quiescent state of the source. The CG predictions, which are claimed to be more appropriate for the quiescent state of the AGN tested by the H.E.S.S. upper limits, are all below the upper limits.
| Blazar | H.E.S.S. | H.E.S.S. | Pred. |
| 300 GeV | 1 TeV | ||
| 0145+138 | 2.25 | 0.203 | SDS |
| 0229+200 | 5.15 | 0.464 | SDS, FOS, CG |
| 0323+022 | 1.92 | 0.173 | SDS, FOS, CG |
| 0548322 | 2.67 | 0.240 | SDS, FOS, CG |
| 0556384 | 7.03 | 0.632 | FOS |
| 0812+026 | 4.03 | 0.363 | FOS |
| 1117+202 | 5.99 | 0.539 | FOS |
| 1440+122 | 4.77 | 0.429 | SDS, FOS, CG |
6.2 Other Radio-Loud Galaxies
Speculation exists for detectable levels of VHE emission from the jets of AGN without doppler boosting along the line of sight (see e.g. Aharonian, Coppi & Völk (1994)). Therefore, the H.E.S.S. observation program also included four other radio-loud AGN. Like BL Lacs they all possess jets. One of these, 3C 273, meets some, but not all, of the phenomenological criteria for classification as a blazar. However, it is most accurately characterized as a quasar. It is the brightest and one of the most nearby quasars. The other three AGN, Cen A, 3C 120 and Pictor A, are found in Fanaroff-Riley (FR) radio galaxies. These galaxies fall into two classes, FR I and FR II. The distinction is based on their radio morphology FR-morph (Fanaroff & Riley 1974). FR I objects, such as Cen A (the prototype), 3C 120 and the VHE-emitter M 87, show extended jets with no distinct termination point, and FR II objects, like Pictor A, have narrow, collimated jets with terminal ”hotspots.” These FR objects differ from BL Lacs mainly due to a large viewing angle (5080∘) with respect to the jet axis.
Chandra observations (for a review see e.g. Harris (2001)) show that Pictor A, 3C 120, and 3C 273 all possess bright X-ray features like knots and hot spots in their large-scale extragalactic jets. The X-ray fluxes of these features are at least a factor of 10 larger than the radio and optical fluxes. This behavior is the opposite of the predictions from synchrotron self-Compton and inverse-Compton models and requires alternative theoretical explanations (see e.g. Aharonian (2002)). Use of the H.E.S.S. upper limits for these objects should aid in constraining some of the presented scenarios. However, they are still subject to the aforementioned variability and EBL absorption (mainly for 3C 273) caveats.
Located at a distance of 3.4 Mpc, Cen A (NGC 5128) is the closest radio-loud AGN. It is one of the best-studied extragalactic objects due to its large apparent brightness in all wavebands (for a recent review see Israel (1998)). The proximity of Cen A means that the intrinsic spectrum of the object is unaffected by absorption on the EBL, considerably simplifying the use of the H.E.S.S. upper limit in the modelling of its VHE emission. However, the lack of simultaneous observations is still an issue as Cen A, like blazars, exhibits large flux variability, albeit on much longer time scales (years).
During the early days of VHE astronomy, a detection of emission above 300 GeV from Cen A was claimed using a non-imaging Cherenkov system Grindlay (Grindlay et al. 1975) during a historically high emission state. The flux reported, I(300 GeV) = (4.41.0) 10-11 cm-2 s-1, is over an order of magnitude above the H.E.S.S. 99.9% flux upper limit extrapolated to above 300 GeV, I(300 GeV) 2.3 10-12 cm-2 s-1. The H.E.S.S. result does not contradict the claimed detection as RXTE ASM observations show that Cen A was in a low emission state when observed by H.E.S.S.. During a similar low emission state, EGRET detected 100 MeV -ray emission from Cen A EGRET_cenA (Sreekumar et al. 1999). This is the only EGRET detection associated with an AGN that is not a member of the blazar class. Extrapolating the EGRET spectrum to above the H.E.S.S. threshold yields I(190 GeV) = 3.5 10-12 cm-2 s-1 which is 60% of the upper limit shown in Table 3. The H.E.S.S. limit is similar, 5.5 10-12 cm-2 s-1, when assuming the measured EGRET spectrum of =2.40. These results imply that future identification of a high-emission state in Cen A should motivate further VHE observations.
6.3 Radio-Weak Galaxies
All of the radio-weak AGN observed by H.E.S.S. are located in Seyfert galaxies which differ from the galaxies previously discussed in many respects. Like the other AGN, they have outflows, albeit typically with low velocity and uncollimated, approximately perpendicular to the accretion disk. Some even have collimated jets that emit synchrotron radiation. However, the jets are neither as collimated as in radio-loud AGN, nor do they show any indications of relativistic motion. Two kinds of Seyfert galaxies (types I and II) exist whose differences can be explained in terms of viewing angle Seyfert (Antonucci & Miller 1985). It is believed that Seyfert I galaxies are viewed ”face on” and thus the nuclear regions are directly visible, whereas Seyfert II galaxies are viewed ”edge on” causing the nuclear regions to be obscured by material (the torus or warped disk). Currently, no Seyfert galaxies are known to be VHE emitters.
Three bright well-studied Seyfert galaxies were observed by H.E.S.S.: NGC 1068, NGC 3783, and NGC 7469. NGC 1068 (M 77), the prototypical type II object, is the brightest and closest known Seyfert galaxy and as such is perhaps the best candidate for detection of this class at VHE energies. Here it should be noted that since the emission from Seyferts is not beamed, their orientation is not as important as with blazars. NGC 3783, a classical type I object, is also one of the brightest and closest Seyfert galaxies, and one of the most well studied. It is also interesting in that exceptionally deep measurements made using the Chandra X-ray Observatory reveal a fast ( km hr-1) wind of highly ionized atoms blowing away from the galaxy’s suspected central black hole chandra_ngc3783 (Kaspi et al. 2002). NGC 7469, also type I, is unusual in that it has an inner ring of gas very close to the nucleus that is undergoing massive star formation starburst (Genzel et al. 1995).
None of these objects were detected and the upper limits shown in Table 3 are quite constraining. While Seyfert-type galaxies are not necessarily expected to emit VHE -rays at observable levels, the H.E.S.S. results easily provide constraints for modelling. This is because these AGN generally show less variability than blazars, and all the ones observed are close enough to only have minimal effects from the absorption of VHE photons on the EBL. The H.E.S.S. results could be interpreted as implying that Seyfert-type AGN are not significant emitters of VHE photons. However, the observed sample and exposure times are small, making it premature to rule the class out all together.
7 Conclusions
H.E.S.S. observed greater than twenty AGN in 2003 and 2004 as part of a campaign to identify new VHE-bright AGN. Several significant detections from this campaign have been reported elsewhere (see Table 1 for references). Results presented here detail the AGN observations for which no significant excess was found, apart from a marginal signal from the well-known VHE-emitter Markarian 501. Despite the limited exposure (8 hours) for each of these AGN, the upper limits on the VHE flux determined by H.E.S.S. are the most stringent to date, demonstrating the unprecedented sensitivity of the instrument. Clearly the strength of the limits makes them quite useful, yet it must again be stressed that any interpretation using the H.E.S.S. limits must take into account both the EBL and the state of the source using simultaneous data at different wavelengths.
The H.E.S.S. AGN observation program is not complete as many proposed candidates have not yet been observed. Further, more time is scheduled for observations of some of the AGN presented here as part of a monitoring effort for blazars. H.E.S.S. has already detected -ray emission from four AGN, including one (PKS 2005489) never previously detected in the VHE regime. Clearly the prospects of finding additional VHE-bright AGN are excellent.
Acknowledgements.
The support of the Namibian authorities and of the University of Namibia in facilitating the construction and operation of H.E.S.S. is gratefully acknowledged, as is the support by the German Ministry for Education and Research (BMBF), the Max-Planck-Society, the French Ministry for Research, the CNRS-IN2P3 and the Astroparticle Interdisciplinary Programme of the CNRS, the U.K. Particle Physics and Astronomy Research Council (PPARC), the IPNP of the Charles University, the South African Department of Science and Technology and National Research Foundation, and by the University of Namibia. We appreciate the excellent work of the technical support staff in Berlin, Durham, Hamburg, Heidelberg, Palaiseau, Paris, Saclay, and in Namibia in the construction and operation of the equipment.References
- Aharonian, Coppi & Völk (1994) Aharonian, F.A., Coppi, P.S. & Völk, H.J., 1994, ApJ, 423, L5
- Aharonian et al. (2001) Aharonian, F., Akhperjanian, A., Barrio, J., et al., 2001, A&A, 370, 112
- Aharonian (2002) Aharonian, F., 2002, MNRAS, 332, 215
- Aharonian et al. (2003) Aharonian, F., Akhperjanian, A., Beilicke, M., et al., 2003, A&A, 403, L1
- (5) Aharonian, F., Akhperjanian, A., Beilicke, M., et al., 2004a, A&A, 421, 529
- Aharonian et al. (2004b) Aharonian, F., Akhperjanian, A.G., Aye ,K.-M., et al., 2004b, Astropart Phys, 22, 109
- Aharonian et al. (2005a) Aharonian, F., Akhperjanian, A.G., Aye ,K.-M., et al., 2005a, A&A, 430, 865
- Aharonian et al. (2005b) Aharonian, F., Akhperjanian, A.G., Aye ,K.-M., et al., 2005b, A&A, 436, L17
- Aharonian et al. (2005c) Aharonian, F., Akhperjanian, A.G., Aye ,K.-M., et al., 2005c, A&A, 437, 95
- (10) Antonucci, R.R. & Miller, J.S., 1985, ApJ, 297, 621
- Beilicke et al. (2005) Beilicke, M., Cornils, R., Heinzelmann, G., et al., 2005, Proc. of the 22nd Texas Symposium on Relativistic Astrophysics (Stanford)
- Bernlöhr et al. (2003) Bernlöhr, K., Carrol, O., Cornils, R., et al., 2003, Astropart Phys, 20, 111
- Böttcher, Mukherjee & Reimer (2002) Böttcher, M., Mukherjee, R., & Reimer, A., 2002, ApJ, 581, 143
- (14) Bradbury, S.M., Deckers, T., Petry, D., et al., 1997, A&A, 320, L5
- Buckley (1999) Buckley, J., 1999, Astropart Phys, 11, 119
- Catanese et al. (1998) Catanese, M., Akerlof, C.W., Badran, H.M., et al., 1998, ApJ, 501, 616
- Chadwick et al. (1999a) Chadwick, P.M., Lyons, K., McComb, T.J.L., et al., 1999a, ApJ, 513, 161
- (18) Chadwick, P.M., Lyons, K., McComb, T.J.L., et al., 1999b, ApJ, 521, 547
- Chadwick et al. (2000) Chadwick, P.M., Daniel, M.K., Lyons, K., et al., 2000, A&A, 364, 450
- Costamante & Ghisellini (2002) Costamante, L. & Ghisellini G., 2002, A&A, 384, 56
- de la Calle Perez et al. (2003) de la Calle Perez, I., Bond, I.H., Boyle, P.J., et al., 2003, ApJ, 599, 909
- Donato et al. (2001) Donato, D., Ghisellini, G., Tagliaferri, G., et al., 2001, A&A, 375, 739
- (23) Fanaroff, B.L. & Riley, J.M, 1974, MNRAS, 167, 31
- Feldman & Cousins (1998) Feldman, G.J. & Cousins, R.D., 1998, Phys Rev D, 57, 3873
- Fichtel et al. (1994) Fichtel, C.G., Bertsch, D.L., Chiang, J., et al., 1994, ApJS, 94, 551
- (26) Fossati, G., Maraschi, L., Celotti, A., et al., 1998, MNRAS, 299, 433
- Funk et al. (2004) Funk, S., Hermann, G., Hinton, J., et al., 2004, Astropart Phys, 22, 285
- (28) Genzel, R., Weitzel, L., Tacconi-Garman, L.E., et al., 1995, ApJ, 444, 129
- (29) Grindlay, J.E., Helmken, H.F., Brown, R.H., et al., 1975, ApJ, 197, L9
- Harris (2001) Harris, D.E, 2001, ASP Conference Proceedings, 250, 204
- Hofmann (2003) Hofmann, W., 2003, Proc. of the 28th ICRC (Tsukuba), 2811
- Horan et al. (2002) Horan, D., Badran, H.M., Bond, I.H., et al., 2002, ApJ, 571, 753
- Horan et al. (2004) Horan, D., Badran, H.M., Bond, I.H., et al., 2004, ApJ, 603, 51
- Israel (1998) Israel, F.P., 1998, A&AR, 8, 237
- (35) Kaspi, S., Brandt, W.N., George, I.M., et al., 2002, ApJ, 574, 643
- Li & Ma (1983) Li, T. & Ma, Y., 1983, ApJ, 272, 317
- Nishijima (2002) Nishijima, K., 2002, Publ. Astron. Soc. Aust., 19, 26
- Nishiyama et al. (1999) Nishiyama, T., Chamoto, N., Chikawa, M., et al., 1999, Proc. of the 26th ICRC (Salt Lake City), 3, 370
- Perlman (1999) Perlman, E.S., 1999, AIP Conf. Proc., 515, 53
- Punch et al (1992) Punch, M., Akerlof, C.W., Cawley, M.F., et al., 1992, Nature, 358, 477
- Quinn et al (1996) Quinn, J., Akerlof, C.W., Biller, S.D., et al., 1996, ApJ, 456, L83
- Roberts et al. (1998) Roberts, M.D., Dazeley, S.A., Edwards, P.G., et al., 1998, A&A, 337, 25
- Roberts et al. (1999) Roberts, M.D., McGee, P., Dazeley, S.A., et al., 1999, A&A, 343, 691
- Rowell et al. (1999) Rowell, G.P., Dazeley, S.A., Edwards, P.G., et al., 1999, Astropart Phys, 11, 217
- Schroedter (2005) Schroedter, M., 2005, ApJ, in Press, arXiv:astro-ph/0504397
- (46) Sreekumar, P., Bertsch, D.L., Hartmann, R.C., et al., 1999 Astropart Phys, 11, 221
- Stecker, de Jager & Salamon (1992) Stecker, F.W., de Jager, O.C., & Salamon, M.H., 1992, ApJ, 390, 49
- Stecker, de Jager & Salamon (1996) Stecker, F.W., de Jager, O.C., & Salamon, M.H., 1996, ApJ, 473, L75
- (49) Tsvetanov, Z.I., Hartig, G.F, Ford, H.C., et al., 1998, ApJ, 493, L83
- Urry & Padovani (1995) Urry, C.M. & Padovani, P., 1995, PASP, 107, 803
- Vincent et al. (2003) Vincent, P., Denance, J.-P., Huppert, J.-F., et al., 2003, Proc. of the 28th ICRC (Tsukuba), 2887
- (52) Williams, D., 2004, AIP Conference Proceedings, 745, 499