CH stars at High Galactic Latitudes
CH stars at High Galactic Latitudes
Abstract
Carbon-rich stars of population II, such as CH stars, can provide direct information on the role of low to intermediate-mass stars of the halo on the early Galactic evolution. Thus an accurate knowledge of CH stellar population is a critical requirement for building up scenarios for early Galactic chemical evolution. In the present work we report on several CH stars identified in a sample of Faint High Latitude Carbon stars from Hamburg survey and discuss their medium resolution spectra covering a wavelength range 4000 - 6800 Å . Estimation of the depths of bands (1,0) 12C12C 4737 and (1,0) 12C13C 4744 in these stars indicate isotopic ratio 12C/13C 3, except for a few exceptions; these ratios are consistent with existing theories of CH stars evolution. The stars of Hamburg survey, a total of 403 objects were reported to be carbon star candidates with strong C2 and CN molecular bands. In the first phase of observation, we have acquired spectra of ninety one objects. Inspection of the objects spectra show fifty one objects with C2 molecular bands in their spectra of which thirteen stars have low flux below about 4300 Å . Twenty five objects show weak or moderate CH and CN bands , twelve objects show weak but detectable CH bands in their spectra and there are three objects which do not show any molecular bands due to C2, CN or CH in their spectra. Objects with C2 molecular bands and with good signals bluewards of 4300 Å which show prominent CH bands in their spectra are potential candidate CH stars. Thirty five such candidates are found in the present sample of ninty one objects observed so far. The set of CH stars identified could be the targets of subsequent observation at high resolution for a detail and comprehensive analysis for understanding their role in early Galactic chemical evolution.
keywords:
stars: CH stars - variable: carbon - stars: spectral characteristics - stars: AGB - stars: population II1 Introduction
Knowledge of stellar population offers a fossil record of formation and evolution of galaxies and thus provide strong constraints on the scenarios of the Galaxy formation and evolution. Carbon stars, for instance, were thought to be giants without exceptions and sought as tracers of the outer halo. Recent surveys on stellar populations have led to the discovery of different types of stars, numerous metal-poor stars, carbon and carbon-related objects etc. (Beers et al. 1992, Totten and Irwin 1998, Beers 1999). One of the results of these efforts is the great discovery that the fraction of carbon-rich stars increases with decreasing metallicity (Rossi, Beers and Sneden 1999). Extensive analysis of many carbon-enhanced metal-poor stars at high resolution (Norris et al. 1997a, 1997b, 2002, Bonifacio et al. 1998, Hill et al. 2000, Aoki et al. 2002b) have revealed many more intriguing results; however, the specific trend of increase in carbon-enhanced stars with decreasing metallicity still remains unexplained. Also, the production mechanisms of carbon in these stars still remain unknown. There are different types of carbon-enhanced stars; (i) stars showing carbon enhancement with -process element enhancement, (ii) carbon enhancement with -process element enhancement and (iii) carbon enhancement with normal -capture element abundances. There is yet another type of very metal-poor stars with strong -process enhancement but only slightly carbon-enhanced ([C/Fe] = +0.2; Hill et al. 2002). Certainly a single well defined production mechanism is unlikely to lead to such a diversity in abundances. To shed light on the production mechanisms of carbon-excess resulting in different types of carbon-enhanced stars and to understand the nucleosynthesis of -process, and -process elements at low metallicity it is desirable to conduct analysis of as many different types of C-enhanced stars as possible.
Christlieb et al. (2001) reported a sample of 403 Faint High Latitude Carbon (FHLC) stars identified by means of line indices - i.e. ratios of the mean photographic densities in the carbon molecular absorption features and the continuum band passes, which were the basis for the Hamburg catalog of high Galactic latitude carbon stars. The identification was primarily based on the presence of strong C2 and CN molecular bands shortward of 5200 Å ; it did not consider CH bands. At high galactic latitudes, although the surface density of FHLC stars is low, different kinds of carbon stars are known to populate the region (Green et al. 1994). One kind is the normal asymptotic giant-branch (AGB) stars, carbon-enriched by dredge-up during post-main-sequence phase which are found among the N-type carbon stars. Another kind is the FHLC stars showing significant proper motions and having luminosities of main- sequence dwarf called dwarf carbon stars (dCs). A third kind of FHLC stars is the so-called CH-giant stars, similar to the metal-poor carbon stars found in Globular clusters and some in dwarf spheroidal (d Sph) galaxies (Harding 1962). Among these, at high galactic latitudes warm carbon stars possibly some C-R stars are also likely to be present. The sample of stars offerred by Christlieb et al. (2001) being high latitude objects, with smaller initial mass and possible lower metallicity is likely to contain a mixture of these objects. Different kinds of objects have different astrophysical implications and hence it is important to distinguish them from one another, although in certain cases it is not easy to do so. For example, dCs are difficult to distinguish from C-giants as they exhibit remarkable similarity in their spectra with those of C-giants. They are however distinguishable through their relatively high proper motion and apparently anomalous JHK infrared colours (Green et al. 1992).
Interpretation of chemical compositions of the intermediate-mass stars formed from the interstellar matter is not straight forward as the interstellar matter is already affected by the ejecta of many generations of more massive stars. In comparison, the halo red giant stars offer more direct information on the role of intermediate-mass stars of the halo. Thus, existance of CH stellar component has important astrophysical implications for Galactic chemical evolution. The processes responsible for carbon excess in these stars to a large extent are responsible for the origin and evolution of carbon, nitrogen and heavy elements in the early Galaxy. Furthermore, isotopic ratios of 12C/13C in C and C-related stars provide useful probes of nucleosynthesis processes and their location leading to carbon excess in these stars. To determine these ratios useful candidates are those with strong isotopic carbon bands in their spectra; CH stars provide an useful set of candidates.
Determination of the chemical compositions as well as carbon isotopic ratios 12C/13C would require high resolution spectroscopy. But before this, a target list of CH stars needs to be generated and this can be done from spectral analysis of stars using even low resolution spectroscopy. Prompted by this we have undertaken to identify the CH as well as other types of stellar objects in the sample of FHLC stars of Christlieb et al. using low resolution spectroscopy. These identifications and the low resolution spectroscopic analysis of the candidate CH stars is the main theme of this paper.
Observations and data reductions are described in section 2. In section 3 we briefly discuss different types of C stars and their spectral characteristics. JHK photometry of the stars is briefly described in section 4. Description of the program stars spectra and results are drawn in section 5. Section 6 contains a brief discussion on the atmospheres of candidate CH stars. Concluding remarks are presented in section 7.
2 Observation and Data Reduction
The stars listed in Table 1 (51 stars) and Table 2 (40 stars) have been observed with 2-m Himalayan Chandra Telescope (HCT) at the Indian Astronomical Observatory (IAO), Mt. Saraswati, Digpa-ratsa Ri, Hanle during June 2003 - May 2004. Spectra of a number of carbon stars such as HD 182040, HD 26, HD 5223, HD 209621, Z PSc, V460 Cyg and RV Sct are also taken for comparison. A spectrum of C-R star HD 156074 taken from Barnbaum et al.’s (1996) atlas is also used for comparison. The spectrograph used is the Himalayan Faint Object Spectrograph Camera (HFOSC). HFOSC is an optical imager cum a spectrograph for conducting low and medium resolution grism spectroscopy (http://www.iiap.ernet.in/iao/iao.html). The grism and the camera combination used for observation provided a spectral resolution of 1330( ); the observed bandpass ran from about 3800 to 6800 Å .
Observations of Th-Ar hollow cathod lamp taken immediately before and after the stellar exposures provided the wavelength calibration. The CCD data were reduced using the IRAF software spectroscopic reduction packages. For each object two spectra were taken each of 15 minutes exposures, the two spectra were combined to increase the signal-to-noise ratio. 2MASS JHK measurements for the stars in Table 1 are also listed. These measurements are available on-line at http://irsa.ipac.caltech.edu/ . In Table 2, the objects observed on 2nd and 3rd March, 2004 are acquired using OMR spectrograph at the cassegrain focus of the 2.3 m Vainu Bappu Telescope (VBT) at Kavalur. With a 600 lmm-1 grating, we get a dispersion of 2.6 Å per pixel. The spectra of these objects cover a wavelength range 4000 - 6100 Å , at a resolution of 1000.
3 Types of C stars and their spectral characteristics
Carbon stars are classified into different spectral types based on their characteristic spectral properties. We briefly discuss here the main characteristics essential for our purpose. More detail discussion on this can be found in literature including Wallerstein (1998) and references therein. Among the carbon stars, the C-N stars have lower temperatures and stronger molecular bands than those of C-R stars. C-N stars exhibit very strong depression of light in the violet part of the spectrum. They are used as tracers of an intermediate age population in extragalactic objects. The C-R stars as well as CH stars have warmer temperatures and blue/violet light is accessible to observation and atmospheric analysis. C-N stars are easily detected in infrared surveys from their characteristic infrared colours. The majority of C-N stars show ratios of 12C/13C more than 30, ranging nearly to 100 while in C-R stars this ratio ranges from 4 to 9. The strength/weakness of CH band in C-rich stars provides a measure of the degree of hydrogen deficiency in carbon stars.
The characteristic behaviour of -process elements in C-stars can also be used as an useful indicator of spectral type. The s-process element abundances are nearly solar in C-R stars (Dominy 1984); whereas most of the carbon and carbon related stars show significantly enhanced abundances of the s-process elements relative to iron (Lambert et al. 1986, Green and Margon 1994).
CH stars are characterised by strong G-band of CH in their spectra. These stars are not a homogeneous group of stars. They consist of two populations, the most metal-poor ones have a spherical distribution and the ones slightly richer in metals are characterised by a flattened ellipsoidal distribution (Zinn 1985). These stars form a group of warm stars of equivalent spectral types G and K giants, but show weak metallic lines. The ratio of the local density of CH stars is as high as 30% of metal-poor giants (Hartwick & Cowley 1985); and being the most populous type of halo carbon stars known, are important objects for our understanding of galactic chemical evolution, the evolution of low mass stars and nucleosynthesis in metal poor stars.
Most of the CH stars are known to be high velocity objects. ‘CH-like’ stars, where CH are less dominant have low space velocities Yamashita (1975). At low resolution to make a distinction between CH and C-R stars is difficult as many C-R stars also show quite strong CH band. In such cases secondary P-branch head near 4342 Å is used as a more useful indicator. Another important feature is the strength of Ca I at 4226 Å which in case of CH stars is weakened by the overlying faint bands of the CH band systems. In C-R star this feature is quite strong. These spectral characteristics allow for an identification of CH and C-R stars even at low resolution. Enhanced lines of s-process elements, weaker Fe group elements as well as various strengths of C2 bands are some other distingushing spectral features of CH stars. However, at low dispersion the narrow lines are difficult to estimate and essentially do not provide with a strong clue to distinguish C-R stars from CH stars. Although CH and C-R stars have similar range of temperatures the distribution of CH stars place most of them in the Galactic halo, their large radial velocities , typically 200km s-1 are indicative of their being halo objects (McClure 1983, 1984).
The objects observed from Hanle are classified considering these spectral characteristics. In the following we discuss the medium resolution spectra of the objects listed in Table 1 with their photometric data.

Table 1: HE stars with prominent C2 molecular bands
Star No.
RA(2000)a
DEC(2000)a
B
Va
B-Va
U-Ba
J
H
K
Dt of Obs
HE 0002+0053
00 05 25.0
+01 10 04
99.71
-59.61
14.5
13.3
1.72
1.25
11.018
10.386
10.118
06.11.04
HE 0017+0055
00 20 21.6
+01 12 07
106.90
-60.70
12.6
9.309
8.693
8.498
15.11.03
HE 0038-0024
00 40 48.2
-00 08 05
117.09
-62.89
15.4
14.4
1.86
1.67
12.433
11.768
11.573
06.11.04
HE 0043-2433
00 45 43.9
-24 16 48
98.33
-86.88
13.8
13.1
1.04
1.00
11.064
10.493
10.365
07.11.04
HE 0110-0406
01 12 37.1
-03 50 30
136.11
-66.17
13.4
10.523
9.988
9.866
17.9.03
HE 0111-1346
01 13 46.5
-13 30 49
145.01
-75.42
13.3
10.684
10.155
10.039
07.11.04
HE 0151-0341
01 53 43.3
-03 27 14
157.78
-62.04
14.6
13.4
1.27
0.87
11.847
11.364
11.248
07.11.04
HE 0207-0211
02 10 12.0
-01 57 39
163.12
-58.55
15.5
14.0
2.16
2.13
11.505
10.605
10.010
07.11.04
HE 0308-1612
03 10 27.1
-16 00 41
201.12
-55.96
12.5
10.027
9.475
9.331
17.9.03
HE 0310+0059
03 12 56.9
+01 11 10
178.95
-45.73
12.6
9.871
9.296
9.196
17.9.03
HE 0314-0143
03 17 22.2
-01 32 37
182.98
-46.69
12.7
8.993
8.222
8.000
17.9.03
HE 0319-0215
03 21 46.3
-02 04 34
184.58
-46.17
14.6
13.6
1.43
1.01
11.785
11.218
11.063
16.9.03
HE 0322-1504
03 24 40.1
-14 54 24
201.90
-52.39
15.0
13.8
1.63
1.24
12.105
11.533
11.340
06.11.04
HE 0429+0232
04 31 53.7
+02 39 01
192.72
-29.17
14.2
13.3
1.35
1.08
11.088
10.520
10.325
07.11.04
HE 0457-1805
04 59 43.6
-18 01 11
217.85
-32.51
12.1
11.2
1.25
1.20
8.937
8.421
8.186
07.11.04
HE 0507-1653
05 09 16.5
-16 50 05
217.54
-29.96
15.6
12.4
1.06
0.68
10.883
10.430
10.315
06.11.04
HE 0518-2322
05 20 35.5
-23 19 14
225.62
-29.74
13.7
11.151
10.672
10.568
15.11.03
HE 0915-0327
09 18 08.2
-03 39 57
235.26
+30.09
14.5
12.9
2.29
2.12
9.968
8.989
8.609
10.4.04
HE 0932-0341
09 35 10.2
-03 54 33
238.38
+33.41
14.8
13.9
1.23
1.02
12.295
11.807
11.708
06.11.04
HE 1008-0636
10 10 37.0
-06 51 13
248.12
+38.35
14.5
12.9
2.28
2.11
9.952
9.073
8.527
29.3.04
HE 1027-2501
10 29 29.5
-25 17 16
266.68
+27.42
13.9
12.7
1.73
1.51
30.3.04
HE 1056-1855
10 59 12.2
-19 11 08
269.48
+36.29
13.6
10.784
10.249
10.090
20.12.04
HE 1104-0957
11 07 19.4
-10 13 16
265.35
+44.92
14.7
8.262
7.561
7.317
20.12.04
HE 1107-2105
11 09 59.6
-21 22 01
273.53
+35.65
14.3
12.1
3.11
2.44
8.279
7.229
6.696
30.3.04
HE 1125-1357
11 27 43.0
-14 13 32
274.20
+43.93
15.2
14.1
1.41
1.40
11.730
11.057
10.842
12.4.04
HE 1145-0002
11 47 59.8
-00 19 19
271.30
+58.60
13.5
13.6
1.48
1.49
10.911
10.240
10.006
11.4.04
HE 1204-0600
12 07 11.6
-06 17 06
283.56
+54.91
14.9
14.0
1.36
1.45
11.517
10.898
10.703
11.4.04
HE 1211-0435
12 14 12.0
-04 52 26
285.83
+56.76
15.0
14.2
1.08
0.90
12.492
11.962
11.916
12.4.04
HE 1228-0402
12 30 50.6
-04 18 59
293.16
+58.16
16.3
15.1
1.68
1.92
12.805
12.070
11.847
11.4.04
HE 1254-1130
12 56 57.0
-11 46 19
305.08
+51.08
16.1
14.5
2.13
2.37
10.731
9.821
9.406
30.3.04
HE 1259-2601
13 01 52.4
-26 17 16
305.84
+36.52
13.9
12.8
1.77
1.56
03.3.04
HE 1304-2046
13 06 50.1
-21 02 10
307.75
+41.69
15.2
14.3
1.32
1.36
11.978
11.386
11.219
30.3.04
HE 1305+0132
13 08 17.8
+01 16 49
312.52
+63.84
13.8
12.8
1.35
1.25
10.621
9.994
9.814
28.3.04
HE 1418+0150
14 21 01.2
+01 37 18
346.80
+56.66
14.2
9.988
9.356
9.127
10.4.04
HE 1425-2052
14 28 39.5
-21 06 05
331.40
+36.64
13.6
12.7
1.27
1.29
10.043
9.446
9.273
28.3.04
HE 1429-0551
14 32 31.3
-06 05 00
343.02
+48.76
13.5
10.734
10.272
10.066
05.9.03
HE 1446-0112
14 49 02.2
-01 25 24
352.42
+49.80
14.5
13.5
1.38
1.39
10.983
10.379
10.162
06.9.03
HE 1501-1500
15 04 26.3
-15 12 00
344.28
+36.78
16.5
15.3
1.65
1.61
12.725
12.030
11.830
10.4.04
HE 1523-1155
15 26 41.0
-12 05 43
351.87
+35.63
14.2
13.4
1.14
0.70
11.372
10.846
10.748
29.3.04
HE 1524-0210
15 26 56.9
-02 20 45
0.98
+42.35
14.4
13.3
1.53
1.25
11.740
11.079
10.896
06.9.03
HE 1528-0409
15 30 54.3
-04 19 40
359.87
+40.30
15.8
15.0
1.10
0.78
12.945
12.455
12.358
29.3.04
HE 2144-1832
21 46 54.7
-18 18 15
34.65
-46.78
12.6
8.768
8.180
7.958
16.9.03
HE 2145-1715
21 48 44.5
-17 01 03
36.63
-46.73
14.2
13.2
1.39
1.18
11.032
10.356
10.255
17.9.03
HE 2207-0930
22 09 57.5
-09 16 06
50.27
-47.96
14.4
13.1
1.82
1.40
10.527
9.812
9.607
16.9.03
HE 2207-1746
22 10 37.5
-17 31 38
38.87
-51.77
11.8
9.115
8.579
8.450
06.9.03
HE 2218+0127
22 21 26.1
+01 42 20
65.46
-43.80
14.6
14.0
0.80
0.31
11.826
11.509
11.433
16.9.03
HE 2221-0453
22 24 25.7
-04 38 02
59.04
-48.38
14.7
13.7
1.36
1.11
11.524
10.997
10.815
17.9.03
HE 2239-0610
22 41 53.1
-05 54 22
61.61
-52.61
14.1
13.1
1.34
1.59
13.830
13.296
13.164
07.11.04
HE 2319-1534
23 22 11.1
-15 18 16
58.09
-66.14
15.3
13.8
2.09
2.16
10.866
9.937
9.367
17.9.03
HE 2331-1329
23 33 44.5
-13 12 34
66.55
-67.12
16.2
14.5
2.29
2.19
11.841
10.990
10.652
06.11.04
HE 2339-0837
23 41 59.9
-08 21 19
78.51
-65.05
14.9
14.0
1.32
0.62
12.632
12.107
12.026
06.11.04
a From Christlieb et al. (2001)
Table 2: HE stars without prominent bands
Star No.
RA(2000)a
DEC(2000)a
Ba
Va
B-Va
U-Ba
Bands
Dt of Obs
noticed
HE 0201-0327
02 03 49.0
-03 13 05
161.94
-60.49
14.1
13.4
1.02
0.95
CH, CN
07.11.04
HE 0333-1819
03 35 18.8
-18 09 54
208.37
-51.32
12.6
CH, CN
16.9.03
HE 0359-0141
04 02 21.2
-01 33 05
192.03
-37.64
14.5
13.4
1.26
1.08
CH, CN
15.11.03
HE 0408-1733
04 11 06.0
-17 25 40
211.87
-43.11
13.1
12.2
1.28
1.26
CH, CN
17.9.03
HE 0417-0513
04 19 46.8
-05 06 17
198.66
-35.82
14.6
13.7
1.31
1.21
CH, CN
15.11.03
HE 0419+0124
04 21 40.4
+01 31 46
192.17
-31.92
15.7
13.0
1.44
1.37
CH, CN
07.11.04
HE 0443-1847
04 46 10.9
-18 41 40
217.23
-35.75
13.1
12.9
1.27
1.21
CH, CN
16.9.03
HE 0458-1754
05 00 34.5
-17 50 21
217.73
-32.26
13.5
12.7
1.18
1.09
CH, CN
02.3.04
HE 0508-1604
05 10 47.0
-16 00 40
216.82
-29.31
12.8
12.1
1.04
1.15
CH, CN,
20.12.04
HE 0518-1751
05 20 28.4
-17 48 43
219.71
-27.84
13.5
12.8
1.05
1.22
CH, CN
07.11.04
HE 0519-2053
05 21 54.4
-20 50 36
223.06
-28.62
13.6
13.7
1.18
1.14
CH, CN
15.11.03
HE 0536-4257
05 37 40.4
-42 55 39
248.71
-31.11
13.8
12.7
1.44
1.41
03.3.04
HE 0541-5327
05 42 14.3
-53 26 31
261.05
-31.59
13.6
03.3.04
HE 0549-4354
05 50 34.3
-43 53 24
250.28
-28.98
13.7
12.8
1.31
1.18
CH
03.3.04
HE 0900-0038
09 02 50.5
-00 50 20
230.15
+28.43
14.2
13.3
1.27
1.19
CH, CN
29.3.04
HE 0916-0037
09 18 47.6
-00 50 35
232.63
+31.79
13.7
12.8
1.24
1.02
CH
03.3.04
HE 0918+0136
09 21 26.1
+01 23 28
230.81
+33.55
14.0
13.1
1.30
1.21
CH
03.3.04
HE 0919+0200
09 22 13.0
+01 47 56
230.52
+33.93
13.5
12.6
1.31
1.20
CH
03.3.04
HE 0930-0018
09 33 24.7
-00 31 46
234.74
+35.01
14.2
14.7
1.43
1.45
CH
02.3.04
HE 0935-0145
09 37 59.0
-01 58 36
236.99
+35.12
13.8
12.9
1.16
1.07
CH
02.3.04
HE 0939-0725
09 42 11.9
-07 39 06
243.19
+32.50
14.0
13.1
1.20
1.13
CH, CN,
20.12.04
HE 1042-2659
10 44 24.2
-27 15 30
271.05
+27.64
14.7
12.6
CH
03.3.04
HE 1117-2304
11 19 42.8
-23 21 07
277.08
+34.87
13.3
CH, CN
11.4.04
HE 1119-3229
11 22 21.9
-32 46 19
282.08
+26.47
14.0
13.1
1.18
1.25
CH
03.3.04
HE 1227-3103
12 30 34.5
-31 19 54
297.72
+31.33
14.3
13.3
1.39
1.54
02.3.04
HE 1304-3020
13 07 24.2
-30 36 36
306.99
+32.14
13.5
12.7
1.17
1.06
CH
02.3.04
HE 1356-2752
13 59 25.0
-28 06 59
320.71
+32.40
13.3
CH
03.3.04
HE 1455-1413
14 57 51.6
-14 25 10
343.27
+38.36
13.1
CH
03.3.04
HE 1500-1101
15 03 40.9
-11 13 09
347.25
+40.01
13.8
12.9
1.28
1.24
CH
29.3.04
HE 1514-0207
15 16 38.9
-02 18 33
358.67
+44.29
13.6
CH, CN
05.9.03
HE 1521-0522
15 24 12.2
-05 32 52
357.20
+40.70
14.7
13.8
1.24
1.11
CH, CN
11.4.04
HE 1527-0412
15 29 42.3
-04 22 22
369.56
+40.49
13.8
12.9
1.21
1.19
CH, CN
05.9.03
HE 2115-0522
21 18 11.8
-05 10 07
46.39
-34.80
17.4
14.3
1.22
1.15
CH, CN
07.11.04
HE 2121-0313
21 23 46.2
-03 00 51
49.51
-34.90
14.9
13.9
1.35
1.47
CH, CN
05.9.03
HE 2124-0408
21 27 06.8
-03 55 22
49.09
-36.09
14.8
13.9
1.26
1.15
CH, CN
17.9.03
HE 2138-1616
21 41 16.6
-16 02 40
36.95
-44.70
14.7
13.9
1.01
0.91
CH, CN
16.9.03
HE 2141-1441
21 44 25.7
-14 27 33
39.43
-44.77
14.3
13.5
1.13
1.03
CH, CN
16.9.03
HE 2145-0141
21 47 48.3
-01 27 50
55.23
-39.10
13.4
12.6
1.10
1.02
CH, CN
16.9.03
HE 2224-0330
22 26 47.9
-03 14 58
61.23
-48.01
14.3
13.5
1.08
0.94
CH, CN
16.9.03
HE 2352-1906
23 54 49.0
-18 49 31
62.50
-74.57
12.9
CH, CN
16.9.03
a From Christlieb et al. (2001)
4 JHK photometry
Infrared colours made from JHK photometry provide a supplementary diagnostics for stellar classification. Figure 1 is a two colour JHK diagram where J-H versus H-K colours of HE stars listed in Table 1 are plotted. The HE stars 2MASS JHK measurements are available on-line at http://iras.ipac.caltech.edu/.
The two boxes superimposed in the figure representing the location of CH stars (thick line solid box) and the C-N stars (thin line solid box) illustrate the loci of the separate carbon-star types and are taken from Totten et al. (2000). In this figure, the CH stars classified by us (following our discussions in the subsequent sections), plotted with open circles fall well within the CH box, except the three outliers HE 1429-0551, HE 2218+0127 and HE 0457-1805. These three stars are represented by solid circles. The spectral characteristics of these stars led us to classify them as CH stars. Their spectra do not show any peculiarities from which their location in the J-H, H-K plane seems obvious. A difference between the spectra of the first two stars lies in molecular C2 bands in the spectral region 5700 - 6800 Å . In this region HE 1429-0551 does not show molecular C2 bands (or could be marginally detected) whereas HE 2218+0127 shows molecular C2 bands as strongly (or marginally stronger) as they are seen in CH star HD 5223. Ba II feature at 6496 Å is weak in HE 1429-0551. In HE 2218+0127, this feature appears to be of equal depth to its counterpart in HD 5223. HE 2218+0127 seems to be the warmest among the candidate CH stars (Table 3). HE 0457-1805, another CH star outside the CH box resembling HD 26, a known CH star, shows stronger CN molecular band around 4215 Å and slightly stronger features due to Ba II at 6496 Å and Na I D. Hα feature is marginally weaker but G-band of CH appears almost of equal strength. There are ten stars in the present sample which show spectral characteristics of C-N stars, they are represented by solid triangles. Four of them fall well within the C-N box, three of them just outside the C-N box and the rest two fall within the CH box. Stars HE 2319-1534 and HE 1008-0636 at the redder edge of the C-N box show Hα and Hβ in emission whereas HE 2331-1329, HE 0915-0327 and HE 1254-1130 with lower H-K values do not show Hα and Hβ features in their spectra. HE 1501-1500, HE 1228-0402 and HE 1107-2005 (inside the CH box) do not have flux below 4500 Å . CN molecular bands are weaker in HE 1228-0402 than their counterparts in other C-N stars. This is not the case with HE 1501-1500. Hα and Hβ features are not detectable in these two stars. At present it remains to be understood why these two stars occupy a location among the CH stars in the J-H, H-K plane.
5 Results
5.1 Spectral characteristics of the program stars
The spectra are examined in terms of the following spectral characteristics.
1. The strength (band depth) of CH band around 4300 Å .
2. Prominance of Secondary P-branch head near 4342 Å .
3. Strength/weakness of Ca I feature at 4226 Å .
4. Isotopic band depths of C2 and CN, in particular the Swan bands
of 12C13C and 13C13C near 4700 Å .
5. Strength of other C2 bands in the 6000 -6200 Å region.
6. 13CN band near 6360 Å and other CN bands across the wavelength
range.
7. Strength of s-process element such as Ba II features at 4554 Å and
6496 Å .
To establish the membership of a star in a particular group we have conducted a differential analysis of the program stars spectra with the spectra of carbon stars available in the low resolution spectral atlas of carbon stars of Barnbaum et al. (1996). We have also acquired spectra for some of the objects from this Atlas and used them for comparison of spectra at the same resolution.
5.2 Candidate CH stars: Description of the spectra
At low resolution the spectra of C-R and CH stars look very similar and
this makes distinction between them a difficult task. The differences
are made apparent by making a comparison between spectra of known C-R
and CH stars. Application of this comparison to the program stars helped
in an easy identification of their spectral class. In figures 2 and 3 we
show a comparison of the spectra of a pair of C-R stars HD 156074 and HD 76846
and a pair of CH stars HD209621 and HD 5223.
Although we have considered here four stars,
the comparison is generally true for any C-R and CH stars.
A comparison of known C-R and CH stars spectra
(i) Wavelength region 4000 - 5400 Å (Figure 2):
G-band of CH is strong in all the spectra, almost of equal strength. However,
the secondary P-branch head around 4343 Å is distinctly seen in the CH
stars spectra. In C-R stars spectra this feature is merged with contributions
from molecular bands.
In C-R stars the Ca I at 4226 Å line depth is almost equal to the CN band depth at 4215 Å whereas in CH stars spectra this line is marginally noticed. CN band around 4215 Å is much deeper in C-R stars than in the CH stars.
Narrow atomic lines are blended with contributions from molecular bands and hence their real strength could not be estimated at this resolution. In the above wavelength range Hβ and Ba II at 4554 Å are the two features clearly noticeable in the CH stars. In C-R star this region is a complex combination of atomic and molecular lines. There is no obvious distinction in the isotopic bands around 4700 Å in C-R and CH stars. C2 molecular bands around 5165 Å and 5635 Å are two prominent features in this region.
(ii) Wavelength region 5400 -6800 Å (Figure 3)
C2 molecular bands around 5635 Å is the most
prominent feature in this region.
This region too is a complex mixture of atomic and molecular lines.
A blended feature of Na I D1 and Na I D2 in C-R stars is sharper
with two distinct dips. In CH stars this feature is shallower and the
individual contribututions of Na I D1 and Na I D2 are not
distinguishable.
Hα feature appears as a distinct
feature in CH stars; in C-R stars this feature seems to be contaminated
by molecular contributions. Ba II feature at 6496 Å is also
blended with contributions from CN bands around 6500 Å ; in CH stars this
blending is not so severe.
CN molecular bands, although present are in general weaker in CH stars
than in C-R stars.
The main features of the above comparison are used to identify the
spectral type ( CH or C-R ) of the program stars. A small number of C-N stars
were easily identified from their distinct spectral properties. In figure
4 we present the spectra of the comparison stars in the wavelength
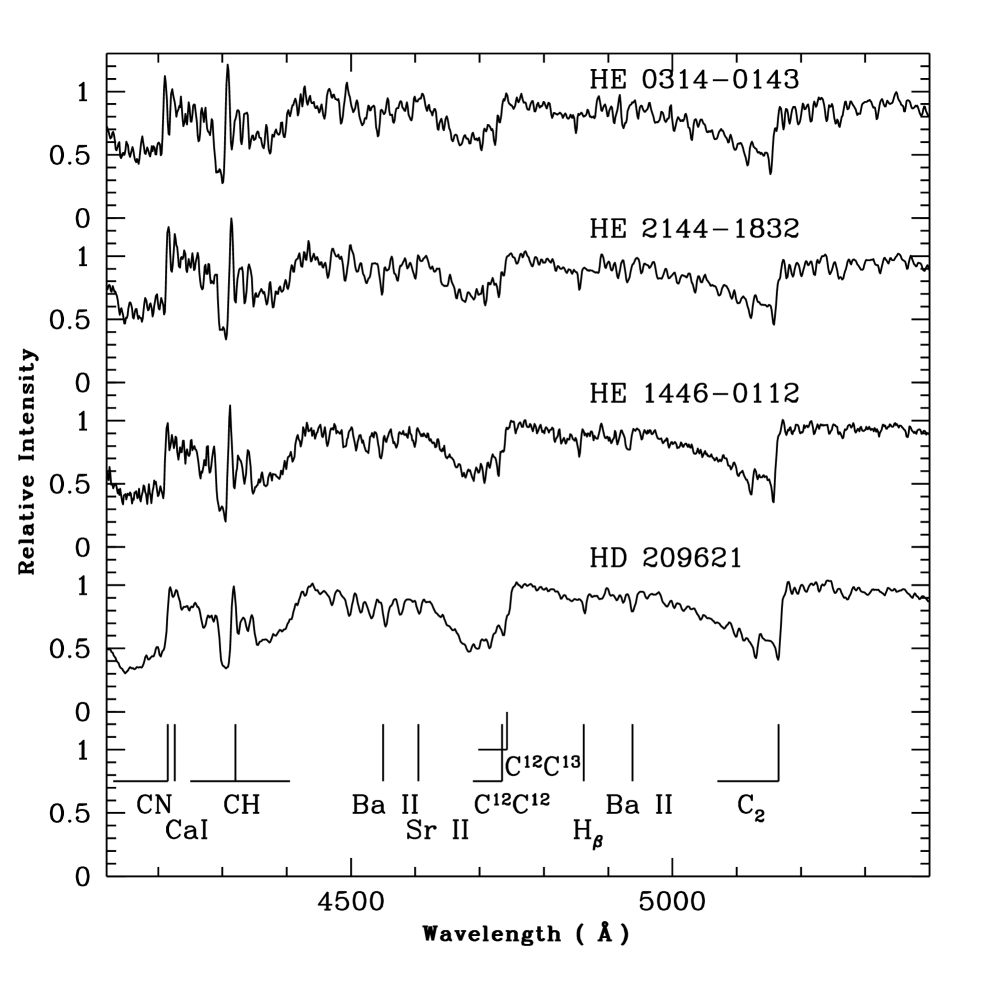
region 4000 -6800 Å . In figure 5 we show one example of HE stars
corresponding to each comparison star’s spectrum in figure 4, in
the sequence top to bottom.
In the following we present the spectral description of the individual star.
HE 2145-1715,
HE 0518-2322, HE 0457-1805, HE 0043-2433, HE 1056-1855
The spectra of these objects closely resemble the spectrum of HD 26,
a known CH star.
CH bands around 4300 are of almost equal strength in the
spectra of these stars. Ca I 4226 Å line is very weak, 4271 Fe I line
is barely
detectable. Strength of G-band of CH, prominent secondary P-branch head
around 4342 Å and a weak Ca I feature at 4226 Å show that these stars
could be CH stars.
C2 molecular bands around 4730 Å , 5165 Å and 5635 Å are much
deeper in HE 2145-1715 than their counterparts in HD 26. Hβ
features are
of equal strength. Ba II line around 4545 Å is marginally weaker in the
spectrum of HE 2145-1715 whereas Ba II feature at 6496 Å and Hα
are of
equal strength. The effective temperature of HD 26 is 4880 K,
and [Fe/H]=-0.5 (Aoki & Tsuji 1997). A marginally weaker NaI D feature than
in HD 26 spectrum and the deeper C2 bands in HE 2145-1715 perhaps is
an indication of slightly lower metallicity and lower temperature for
HE 2145-1715 than HD 26. This statement however can be asscertained only
from high resolution spectral analysis.
In HE 0518-2322, CN molecular band depth matches well with that of HD 26.
Na I D appears weakly in emission, Ba II at 6496 Å and Hα
features are marginally stronger. Hα feature has an weak emission
at the absorption core. HE 0043-2433 has a stronger CN band around 4215 Å
but Hα, Hβ and Ba II at 6496 Å appear with almost
similar strength to those in HD 26. Na I D feature appears weakly in
absorption in this star. In HE 0457-1805, Na I D is stronger than in HD 26
but Hα, Hβ and Ba II at 6496 Å appear with almost
similar strength. In HE 1056-1855, Hα and Hβ are
marginally weaker but Ba II at 6496 Å appear with almost equal strength
as in HD 26.
HE 0310+0059, HE2239-0610, HE 0932-0341, HE 0429+0232
These four stars spectra resemble the spectrum of HD 26 to a large
extent. G-band of CH around 4300 Å is of similar strength to that
in HD 26 but the secondary P-branch head around 4342 Å is not seen
prominently as it is seen in CH stars. Further, in contrast to HD 26,
these stars spectra
exhibit strong Ca I feature at 4226 Å in their spectra. These stars
do not seem to be potential candidate CH stars.
In HE 0310+0059, lines appear much sharper than in HD 26 and especially
Na I D feature is seen as a much stronger feature in absorption.
In HE 0429+0232,
this feature is marginally weaker than in HD 26.
In HE 2239-0610 and HE 0932-0341
Na I D features appear in weak emission. CN bands are stronger in HE 0310+0059
but C2 bands are of similar strength. Hα, Hβ,
and Ba II feature at 6496 Å appear in these stars almost with equal
strength as in HD 26.
HE 0110-0406, HE 0308-1612, HE 0314-0143, HE 1125-1357,
HE 1211-0435, HE 1225-2052, HE 1446-0112, HE 1524-0210, HE 1528-0409,
HE 2144-1832, HE 2207-1746
The spectra of these stars closely resemble the spectrum of HD 209621
except for some marginal differences in the molecular band depths.
The star HD 209621
is a known CH giant with effective temperature 4700 K and metallicity
-0.9 (Wallerstein 1969, Aoki & Tsuji 1997).
Except for HE 1446-0112 and HE 1524-0210 the CN band depth around
4215 are weaker in the program stars spectra than in the spectrum
of HD 209621. Ca I at 4226 Å is not detectable in the spectra of
HE 1446-0112, HE 1127-1357, and HE 1211-0435, but appears weakly in the
rest of the stars spectra.
In the first three stars although Ca I feature at 4226 Å is seen
with its depth almost half the depth of CN band around 4215 Å
it should be noted that in these three stars CN band itself is much
weaker than its counterpart in HD 209621 and in C-R stars.
CH band at 4300 in the spectra of the program stars
are equal or stronger than in the spectrum of HD 209621
except for HE 2207-1746, HE 0308-1612 and HE 0110-0406 where
this features are slightly weaker. In these stars CN band around 4215 Å
is also weak, much weaker than in C-R stars.
Secondary P-branch head around 4342 Å is seen prominently
in all the cases. We assign the membership of these stars to the CH group.
Molecular band heads of C2 around 4700 is of equal strength
in HE 1446-0112, HE 1524-0210 and HE 1127-1357; in the rest of the stars
spectra this
band is slightly weaker than in HD 209621. C2 band depth
around 5165 and 5635 are almost of equal strength
except for stars HE 2207-1746, HE 1211-0435, HE 0308-1612, and HE 0110-0406.
Ba II feature at 4554 Å is detectable and of similar strength;
however Hβ feature is weaker in HE 1524-0210 and
HE 1528-0409. Except in HE 1446-0112 and HE 1528-0409 where
NaI D feature appears slightly weaker, in the rest of the stars
spectra this feature is of similar strength with that of NaI D feature
in HD 209621.
Ba II feature at 6496 Å which is distinctly seen in HD 209621
appears blended with CN molecular band in HE 1446-0112. In HE 1125-1357,
HE 1528-0409 and HE 1211-0435 this feature appears slightly weaker than
in HD 209621 and in the rest they seem to be of equal strength. H
profile is of equal strength in all the stars except in HE 0314-0143
where this feature is slightly weaker.
In figure 6, we show as an example a comparison of spectra of three objects
in the wavelength region 4125 - 5400 Å with the spectrum of HD 209621.
HE 1429-0551, HE 1523-1155, HE 2218+0127, HE 2221-0453,
HE 1204-0600, HE 1418+0150, HE 2207-0930, HE 1145-0002, HE 0111-1346,
HE 0151-0341, HE 0507-1653, HE 0038-0024, HE 0322-1504, HE 2339-0837
With marginal differences in the molecular band depths these stars spectra
closely resemble the spectrum of HD 5223, a well known CH giant
with effective temperature 4500 K, and metallicity -1.3
(Aoki & Tsuji 1997).
The CN band depth around 4215 in the HE stars spectra are very similar to the CN band depth in the spectrum of HD 5223 except in HE 1145-0002 where this feature is weaker and does not show a sharp clear band head. G-band of CH around 4300 in the spectra of the program stars resemble greatly to their counterparts in HD 5223. Ca I at 4226 Å is seen in the spectra of HE 2218+0127, HE 1204-0600 and HE 2207-0930 but not as prominently as they are seen in C-R stars. Moreover, the line depth of this feature is quite shallow compared to the CN molecular band depth around 4215 Å . We note, in C-R stars these two features appear almost with equal depth and CN band depth is deeper in C-R stars than in CH stars.
The Ca I feature is seen marginally also in the rest of the stars spectra. Fe I at 4271.6 Å although weak could be marginally detected in all the spectra. Prominance of secondary P-branch head near 4342 Å , strong G-band of CH and weak or marginally detectable Ca I feature at 4226 Å allow these stars to be placed in CH group. The dominance of CH is shown not only by the marked band depths, but also by the weakness of Ca I at 4226 Å and distortion of metallic lines between 4200 and 4300 Å . In figure 7, we show a comparison of three spectra in the wavelength region 4000 - 5400 Å with the spectrum of HD 5223.
Isotopic bands of Swan system around 4700 appear to be of equal strength in HE 1204-0600 and HE 2218+0127 with their counterpart in HD 5223. These bands are slighly deeper in HE 2207-0930, HE 1145-0002 and HE 2221-0453 and marginally swallower in HE 1429-0551 and HE 1523-1155. C2 bands around 5165 and 5635 greatly resemble those in the spectrum of HD 5223, except for stars HE 2207-0930 and HE 1145-0002 where these bands are slightly deeper. As in the case of HD 5223, Ba II feature at 4554 Å is distinctly seen in the program stars spectra. However in HE 1429-0551, HE 1523-1155 and HE 2218+0127 this feature is marginally weaker, and in the rest the feature is of similar strength. Hβ feature appears in all the spectra with similar strength as in HD 5223. Except in HE 1429-0551, HE 1523-1155, and HE 2121-0453, NaI D feature appears slightly stronger as compared to this feature in HD 5223. Ba II feature at 6496 Å appears weaker in HE 1429-0551, HE 1523-1155 and HE 2218-0127 than in HD 5223, this feature appears blended with contributions from CN molecular bands in HE 1204-0600, HE 2207-0930 and HE 1145-0002. H profile is of equal strength in HE 1429-0551, HE 1523-1155, HE 2218-0127, and HE 2221-0453; this feature appears slightly weaker in HE 1204-0600, HE 2207-0930 and HE 1145-0002 and blended with contributions from molecular bands. The spectra of HE 1204-0600, HE 2207-0930 and HE 1145-0002 resemble closely the spectrum of HD 5223 in the wavelength region 4000 - 5800Å ; they show marginally stronger CN bands in the wavelength region 5700 - 6800 Å .
The spectra of HE 0111-1346 and HE 0322-1502 show a very good match with the spectrum of HD 5223, with similar depths in molecular bands and also line depths of H, Hβ and Ba II at 6496 Å appear with similar strength. In HE 0322-1502 Na I D appears weakly in emission.
In HE 0151-0341, G-band of CH around 4300 Å and CN band around 4215 Å
have similar strength but C2 bands are marginally weaker than in HD 5223.
H and Hβ are of equal strength but Na I D and
Ba II at 6496 Å are much weaker than in HD 5223.
HE 0507-1653 has marginally weaker bands and also Na I D feature is slightly
weaker than in HD 5223; H,
Hβ and Ba II at 6496 Å appear with similar strength.
The spectra of HE 0038-0024 and HE 2339-0837 show marginally stronger
CN band around 4215 Å and G-band of CH around 4300 Å but
exhibit slightly weaker C2 molecular bands. Na I D feature appears
in weak emission, H, is of similar strength but Ba II at 6496 Å appear in equal strength in HE 0038-0024 which is marginally weaker in
HE 2339-0837.
HE 1305+0132, HE 1027-2501, HE 1304-2046, HE 0017+055, HE 0319-0215
The spectra of these stars also show spectral
characteristics of CH stars. The spectra exhibit strong G-band of CH.
Secondary P-branch head of CH near 4342 Å is distinctly seen as
usually seen in CH
stars spectra. Ca I feature at 4226 Å is weak or undetectable in their
spectra. We place these stars in
CH group. Ba II at 4554 Å , Sr II around 4606 Å and Hβ
are seen in their spectra.
Strong molecular bands include
C2 Swan bands around 4700 Å and C2 bands around 5165 Å and
5635 Å . Ba II feature around 6496 Å is blended with contributions
from CN bands. CN bands around 5730 Å and 6300 Å are detected. Na I D
features appear very similar as seen in most of the CH stars
except in HE 0319-0215, where this feature appears in weak emission.
5.3 Candidate C-N stars: Description of the spectra
HE 2319-1534, HE 1008-0636, HE 2331-1329,
HE 0207-0211, HE 1107-2105
The spectra of these stars show a
close resemblance with the spectrum of C-N star Z Psc with similar strengths
of CN and C2 bands in them seen across the wavelength regions.
In figure 8, we show as an example, a comparison of spectra for three objects
in the wavelength region 5500 - 6800 Å with the spectrum of Z Psc.
The spectra of HE 2319-1534, HE 1008-0636 and HE 1107-2105
have low flux below about 4500 Å . In
HE 1008-0636 the SiC2 bands around 4800 - 5000 Å are seen. These
red-degraded features are not seen in the other four and Z Psc. Na I D
feature is much deeper in HE 1008-0636 than in HE 2319-1534.
In the spectrum of HE 2331-1329, Ca I feature
at 4226 Å is much weaker than in Z PSc. G-band of CH around
4300 Å and C2 molecular bands are of similar strength
but CN bands are much weaker in HE 2331-1329 than their counterparts in Z PSc.
Na I D, Hα and Hβ are marginally detectable in this star.
In HE 0207-0211 CN bands are much weaker than in Z PSc but C2 bands
are in good match; Na I D feature is weak and barely detectable.
In HE 0207-0211 and HE 1107-2105 Hα and Hβ appear in
emissionr; these two
features are also seen strongly in emission in the spectra
of HE 2319-1534 and HE 1008-0636
are indicative of a possible strong chromospheric activity or
shock-waves of the type associated with Mira variables.
HE 1228-0402, HE 0915-0327, HE 1254-1130, HE 1501-1500, HE 1259-2601
The specta of these stars
show very low flux below about 4500 Å . Their spectra mostly resemble
the spectra of C-N star with prominent CN and C2 bands seen across the
wavelength regions. The spectrum of C-N star V460 Cyg compares closest
to the spectra of these stars. Na I D feature is weaker in their spectra
as compared to their counterparts in V460 Cyg.
We place these stars in C-N group. In V460 Cyg the molecular bands of C2
as well as CN are much deeper than in Z Psc.
HE 0002+0053, HE 1104-0957
The spectra of these two objects
greatly resemble the spectrum of C-R star RV Sct. C2
bands in the spectrum of HE 0002+0053 match closely with those in RV Sct
but CN bands are much weaker. In
HE 1104-0957 molecular bands due to both CN and C2 are much weaker than
those in RV Sct. In both the stars, Hα and Hβ are
weakly seen in absorption. Na I D is marginally detectable but weaker than
in RV Sct. but G-band of CH around 4300 Å is marginally stronger in these
stars. Ca I feature around 4226 Å which appears weakly in
the spectrum of RV Sct is missing in the spectra of these two stars.
13C isotopic band around 4700Å
is absent in these two stars. CN
band around 5200 and 5700 Å distinctly seen in RV Sct is marginally
detected in HE 0002-0053 but not seen in HE 1104-0957.
Table 3: Estimated effective temperatures (Teff) of the
candidate CH stars
Star Names
T
T
T
12C/13C
(J-K)
(J-H)
(V-K)
HE 0017+0055
3919.1
4124.4
-
1.3
HE 0038-0024
3783.8
3929.2
4306.2
1.9
HE 0043-2433
4263.8
4271.3
4379.3
-
HE 0110-0406
4405.6
4444.0
-
2.1
HE 0111-1346
4449.5
4481.0
-
2.5
HE 0151-0341
4619.2
4696.5
4912.7
1.7
HE 0308-1612
4274.8
4369.2
-
2.8
HE 0314-0143
3454.4
3561.6
-
76.8
HE 0319-0215
4188.9
4314.8
4480.4
4.7
HE 0322-1504
4054.8
4293.7
4614.6
2.2
HE 0457-1805
4097.6
4513.4
4165.5
-
HE 0507-1653
4740.2
4846.3
4983.1
6.7
HE 0518-2322
4680.9
4689.1
-
-
HE 1027-2501
-
-
-
1.8
HE 1056-1855
4280.5
4427.3
–
-
HE 1145-0002
3665.5
3905.5
3691.2
1.4
HE 1125-1357
3708.6
3897.9
3910.2
3.7
HE 1204-0600
3910.0
4102.6
3881.6
1.7
HE 1211-0435
4710.3
4476.0
4732.4
3.7
HE 1304-2046
4073.0
4200.9
4061.1
1.7
HE 1305+0132
3931.4
4061.2
4131.2
1.4
HE 1425-2052
4038.5
4179.1
3824.0
1.7
HE 1418+0150
3781.1
4042.8
-
1.5
HE 1429-0551
4367.4
4800.0
-
1.9
HE 1446-0112
3891.9
4160.2
3854.9
1.8
HE 1523-1155
4524.2
4491.1
4380.8
2.5
HE 1524-0210
3826.9
3942.1
4611.2
2.3
HE 1528-0409
4666.7
4662.4
4388.4
2.4
HE 2144-1832
3922.2
4226.4
-
2.1
HE 2145-1715
4019.1
3862.1
4214.1
2.2
HE 2207-0930
3628.5
3751.7
3736.5
1.4
HE 2207-1746
4378.8
4448.4
-
3.2
HE 2218+0127
5544.6
5631.3
-
4.2
HE 2221-0453
4231.7
4487.1
4163.8
12.6
HE 2339-0837
4592.6
4499.1
5104.5
2.3
HD 26
5.9
HD 209621
8.8
HD 5223
6.1
6 Atmospheres of CH stars
6.1 Effective temperature
Preliminary estimates of the effective temperatures of the candidate CH stars are determined by using temperature calibrations derived by Alonso et al. (1996). These calibrations were derived by using a large number of lower main sequence stars and subgiants, whose temperatures were measured by infrared flux method, and holds within a temperature and metallicity range 4000 Teff 7000 K and -2.5 [Fe/H] 0 . This calibration relates Teff with Stromgren indices as well as [Fe/H] and colours (V-B), (V-K), (J-H) and (J-K). By considering the uncertainties arising from different sources such as uncertainties in the Stromgren photometry, reddening and the calibration of the absolute flux in the infrared, Alonso et al. (1996) estimated an uncertainty of 90 K in Teff determination. The broad band B-V colour is often used for the determination of Teff, however B-V colour of a giant star depends not only on Teff but also on metallicity of the star and the molecular carbon absorption features, due to the effect of CH molecular absorption in the B band. For this reason, we have not used the empirical Teff scale for the B-V colour indices. Since there is a negligible difference between the 2MASS infrared photometric system and the photometry data measured on TCS system used by Alonso et al. (1998) in deriving the Teff scales; we have used the empirical Teff scales with 2MASS photometric data. We have further assumed that the effects of reddening on the measured colours are negligible. In estimating the Teff from Teff - (J-H) and Teff - (V-K) relations we had to adopt a value for metallicity of the star as the metallicity of these stars are not known. We assumed the metallicity of the stars to be same as their closest comparison star. This assumption has definitely affected the accuracy of the Teff measurements. Estimated effective temperatures are listed in Table 3.
For a reliable determination of metallicity, effective temperatures and chemical compositions of these stars, observation at high resolution is necessary. High resolution spectra will also enable us for an accurate measurement of 12C/13C ratios.
6.2 Isotopic ratio 12C/13C from molecular band depths
Carbon isotopic ratio 12C/13C provides an important probe of stellar evolution but low resoltuion of the spectra does not allow a meaningful estimation of this ratio.
We have estimated the ratio of the molecular band depths using the bands of (1,0) 12C12C 4737 and (1,0) 12C13C 4744. For a majority of the sample stars, we find from the depths of molecular bands the ratio 12C/13C 3, with an exception of three stars for which this ratio is 7, 13 and 77 respectively. The ratios are presented in Table 3. This ratio measured on the spectra of the welknown CH stars HD 26, HD 5223 and HD 209621 are respectively 5.9 , 6.1 and 8.8 . Tsuji et al. (1991) had suggested two kinds of CH stars; one with very high 12C/13C ratio and the other with the values less than about 10. Our estimated ratios of 12C/13C are consistent with this.
Several explanations on the significance of the range of values of 12C/13C ratios are put forward in terms of the stars evolutionary scenarios. One explanation for a lower value of 12C/13C ratio is that, generally, the 12C/13C ratio and total carbon abundances decrease due to the convection which dredges up the products of internal CNO cycle to stellar atmosphere as ascending RGB. If it reaches AGB stage, fresh 12C may be supplied from the internal He burning layer to stellar surface leading to an increase of 12C/13C ratio again. Since the abundance anomalies observed in CH giants are believed to have originated by the transfer of mass from a now extinct AGB companion, the CH giant’s atmosphere should be enhanced in triple products from the AGB star’s interior- primarily 12C. This explanation is in favour of stars which give high 12C/13C ratios. The low carbon isotope ratios imply that the material transferred from the now unseen companion has been mixed into the CN burning region of the CH star or constitutes a minor fraction of the envelope mass of the CH star, thus giving isotope ratios typical of stars on their first ascent of the giant branch.
7 Concluding Remarks
Large samples of high latitude carbon stars such as one reported by Christlieb et al. allows a search for different kinds of carbon stars; the present work is a step in this direction. The sample of carbon star candidates offered by Christlieb et al. being high latutude objects, smaller initial masses and possible lower metallicity, it is likely that a reasonable fraction of it could be CH stars. Indentification of several CH stars and description of their spectra are the main results of this paper. Another effort is known to be underway to make a medium-resolution spectroscopic study of the complete sample of stars from Christlieb et al. 2001 (Marsteller et al. 2003, Beers et al. 2003). From the sample list we have acquired spectra for ninety one stars in the first phase of observation. Out of these, fifty one objects were found to exhibit strong C2 molecular bands in their spectrs of which thirteen stars have low flux below about 4300 Å . Twenty five objects show weak or moderate CH and CN bands, twelve objects show weak but detectable CH bands in their spectra and there are three objects which do not show any molecular bands due to C2, CN or CH in their spectra. As an example, in figure 9 we show three spectra: a spectrum of HE 0443-1847 which exhibits very weak molecular bands due to CN around 4215 Å and a weak G-band of CH around 4300 Å (but no C2 molecular bands); a spectrum of HE 0930-0018 which show a weak signature of G-band of CH around 4300 Å and a spectrum of HE 1227-3103 which do not show any molecular bands due to C2, CN or CH in its spectrum.
Although spectroscopically, appearance of strong C2 molecular bands is an obvious indication of a star being a carbon star, the conventional defination of a carbon star is a star with C/O 1 (Wallerstein et al. 1997). Hence if one adopts this conventional definition non appearance of any C2 molecular bands will not necessarily disqualify a star from being a carbon star as this does not exclude the condition C/O 1; which at our resolution of the spectra is not derivable.
Westerlund et al. (1995) defined dwarf carbon stars as having J-H 0.75, H-K 0.25 mag. None of the stars occupies a region defined by these limits in J-H, H-K plane. With respect to J-H, H-K colours there is a clear separation between the C-N type stars and dwarf carbon-star populations; there are CH stars with J-H 0.75 but their H-K values are less than the lower limit of 0.25 mag set for dwarf carbon stars. We find that the sample of stars under investigation is comprised mostly of CH stars and a small number of C-N and C-R stars.
We have derived the effective temperatures of the candidate CH stars from correlations of Alonso et al. (1996) making use of (J-K), (J-H) and (V-K) colour indices. They vary over a wide range of temperature with an average of 240 K. These temperature estimates provide a preliminary temperature check for the program stars and can be used as starting values in deriving atmospheric parameters from high resolution spectra using model atmospheres. For majority of the sample stars, we find carbon isotopic ratio 12C/13C 3 with an exception of three stars HE 0507-1653, HE 2221-0453 and HE 0314-0143 for which this ratio is 7, 13 and 77 respectively. It was suggested by Tsuji et al. (1991) that there could be two kinds of CH stars, one with very high 12C/13C ratio and the other with values 10. Our 12C/13C estimates are consistent with this. This range of ratios is the same as found for the population II giants and globular cluster giant stars (Vanture 1992). Different evolutionary scenarios are held responsible for the two groups of CH stars, one with high and the other with low 12C/13C ratios.
From radial velocity survey CH stars are known to be binaries. For the moderately metal-poor classical CH stars ([Fe/H] -1.5), a scenario for abundance anomalies and the origin of carbon was proposed in which the carbon-enhanced star is a member of a wide binary system that accreted material from a former primary, during the asymptotic giant branch (AGB) phase of the latter, as described by McClure & Woodsworth (1990). In such a scenario CH stars with large 12C/13C ratios indicates that their atmosphere is enhanced in triple products. The process of convection dredges up the products of internal CNO cycle to the stellar atmospheres as ascending RGB and this leads to a decrease of or a small value of 12C/13C ratio and a small total carbon abundance; on reaching the AGB stage 12C/13C ratio increases again due to the receipt of fresh 12C supplied from the internal helium burning layer to the stellar surface. According to the models of McClure (1983, 1984) and McClure & Woodsworth (1990) the CH binaries have orbital characteristics consistent with the presence of a white dwarf companion, these stars have conserved the products of carbon rich primary and survived untill the present in the Galactic halo.
However, in case of a few
carbon-enhanced, metal-poor stars (subgiants) monitoring of radial
velocity over a period of eight years did not reveal radial velocity
variations greater than 0.4 km s-1 which is against the mass transfer
scenario for these stars (Norris et al. 1997a, Aoki et al. 2000, Preston
and Sneden 2001).
Furthermore, it is expected that
the star we observe today should display an enrichment of -process
elements, produced by the former primary in its AGB phase, while the
carbon-enhanced metal-poor star CS 22957-027 (Norris et al. 1997b,
Bonifacio et al. 1998),
as well as the stars reported by Aoki et al. 2000
do not exhibit this behaviour.
The carbon-enhanced metal-poor stars that do show -process enrichment
provide strong observational constraints for theoretical
models of the structure, evolution and nucleosynthesis of early-epoch
AGB stars and permit studies of the -process operating at very low
metallicities.
It was shown by Goriely & Siess (2001) that even at the absence of iron
seeds efficient production of -process elements can take place at
zero metallicity provided protons are mixed into carbon-rich layers
producing 13C, which acts as a strong neutron source via
13C( ,n)16O. The recent discovery of
carbon-enhanced metal-poor stars with strong overabundances of Pb
support these predictions ( Aoki et al. 2000, Van Eck et al. 2001).
Thus CH stars being the most prominent of the few types of heavy
element stars that exist
in both the field of the Galaxy and globular clusters are an important
class of objects which can provide
some of the very few direct observational tests to stellar evolution
theory.
While in the present work, the spectra of the stars
listed in table 1, are discussed the analysis and description of the
spectra of the
stars listed in table 2 will be discussed in a subsequent work.
Acknowledgement
We thank the staff at IAO and at the remote control station at CREST,
Hosakote for assistance during the observations. This work made use of
the SIMBAD astronomical database, operated at CDS, Strasbourg, Franch, and
the NASA ADS, USA. I am grateful to the referee Prof Timothy Beers for
his many constructive suggestions which has improved considerably the
readability of the paper. The author would also like to thank Professor
N. K. Rao for his guidance in the observational program, and helpful
suggestions.
References
- [1] Alonso, A. et al. 1996, A&A, 313, 873
- [2] Alonso, A. et al. 1998, A&AS, 131, 209
- [3] Aoki, W. & Tsuji, T. 1997, A&A, 317, 845
- [4] Aoki, W., Norris, J. E., Ryan, S. G., Beers, T. C. & Ando, H. 2002, ApJ, 567, 1166
- [5] Aoki, W., Norris, J. E., Ryan, S. G., Beers, T. C., & Ando, H. 2000, ApJ, 536, L97 The Third Stromlo Symposium: the Galactic Halo, ed. B. K. Gibson, T. S. Axelrod & M. E. Putman (San Francisco: ASP), 202
- [6] Barnbaum, C., Stone, R. P. S. & Keenan, P. 1996, ApJS, 105, 419
- [7] Beers, T. C. et al. 2003, IAUJD..15E..59B
- [8] Beers, T. C., Preston, G. W. & Shectman, S. A. 1992, AJ, 103, 1987
- [9] Beers, T. C. 1999, in ASP Conf Ser. 165,
- [10] Bonifacio, P. et al. 1998, A&A, 332, 672
- [11] Chriestlieb, N. et al. 2001, A&A, 375, 366
- [12] Dominy, J. F. 1984, ApJS, 55, 27
- [13] Goriely, S & Siess, L. 2001, A&A, 378, L25
- [14] Green, P. J. et al. 1992, ApJ, 400, 659
- [15] Green, P. J. et al. 1994, ApJ, 433, 319
- [16] Green, P. J. & Margon, B. 1994, ApJ, 423, 723
- [17] Harding, G. A., 1962, Observatory, 82, 205
- [18] Hartwick, F. D. A. & Cowley, A. P. 1985, AJ, 90, 2244
- [19] Hill, V. et al. 2002, A&A, 387, 560
- [20] Lambert, D. L. et al. 1986, ApJS, 62, 373
- [21] Marsteller, B. et al. 2003, AAS…20311216M20311216M
- [22] McClure, R. D. & Woodsworth, A. W., 1990, ApJ, 352, 709
- [23] McClure, R. D. 1983, ApJ, 268, 264
- [24] McClure, R. D. 1984, ApJ, 280, L31
- [25] Norris, J. E., Ryan, S. G., & Beers, T. C. 1997a, ApJ, 488, 350
- [26] Norris, J. E., Ryan, S. G., & Beers, T. C. 1997b, ApJ, 489, L169
- [27] Norris, J. E., Ryan, S. G., Beers, T. C., Aoki, W. & Ando, H. 2002, ApJ, 569, L107
- [28] Preston, G. W. & Sneden, C 2001, AJ, 122, 1545
- [29] Rossi, S., Beers, T. C. & Sneden, C. 1999, in ASP Conf Ser. 165, The Third Stromlo Symposium: the Galactic Halo, ed. B. K. Gibson, T. S. Axelrod & M. E. Putman (San Francisco: ASP), 264
- [30] Tsuji, T. et al. 1991, A&A, 252, L1
- [31] Totten, E. J. & Irwin, M. J. 1998, MNRAS, 294, 1
- [32] Totten, E. J. et al. 2000, MNRAS, 314, 630
- [33] Van Eck, S., Goriely, S.i, Jorissen, A., & Plez, B. 2001, Nature, 412, 793
- [34] Vanture, Andrew D. 1992, AJ, 104, 1997
- [35] Wallerstein, G. 1969, ApJ, 158, 607
- [36] Wallerstein, G. & Knapp, G. 1998, ARA&A, 36, 369
- [37] Westerlund, B. E., Azzopardi, M., Breysacher, J. Rebeirot, E. 1995, A&A, 303, 107
- [38] Yamashita, Y. 1975, PASJ, 27, 325
- [39] Zinn, R. 1985, ApJ, 293, 424