11email: adam.dobrzycki@eso.org 22institutetext: Observatoire de Genève, CH-1290 Sauverny, Switzerland
22email: laurent.eyer@obs.unige.ch 33institutetext: Harvard-Smithsonian Center for Astrophysics, 60 Garden Street, Cambridge, MA 02138, USA
33email: kstanek@cfa.harvard.edu 44institutetext: Department of Astronomy, The Ohio State University, Columbus, OH 43210 55institutetext: National Optical Astronomy Observatory, 950 North Cherry Avenue, Tucson, AZ 85719, USA
55email: lmacri@noao.edu.
Discovery of nine quasars behind the Large Magellanic Cloud††thanks: Based on observations collected at the Magellan Baade 6.5-m telescope and at the European Southern Observatory, Chile (ESO Programme 074.A-0069).
We present the discovery of nine quasars behind the Large Magellanic Cloud, with emission redshifts ranging from 0.07 to 2.0. Six of them were identified as part of the systematic variability-based search for QSOs in the objects from the OGLE-II database. Combination of variability-based selection of candidates with the candidates’ colours appears to be a powerful technique for identifying quasars, potentially reaching 50% efficiency. We report an apparent correlation between variability magnitude and variability timescale, which – if confirmed – could put even more constraints on QSO candidate selection. The remaining three quasars were identified via followup spectroscopy of optical counterparts to X-ray sources found serendipitously by the Chandra X-ray Observatory satellite. Even though the locations of the candidates were quite uniformly distributed over the LMC bar, the confirmed QSOs all appear near the bar’s outskirts.
Key Words.:
Magellanic Clouds – quasars: general1 Introduction
Recent advances in observational techniques and the availability of large variability monitoring databases have opened up a possibility for searches for quasars behind dense stellar fields. Until recently, those areas were avoided in QSO surveys, primarily because of candidate confusion problems. At the same time, such quasars are very interesting, e.g. as background sources for absorption studies (e.g. Prochaska et al. 2002), as fixed reference points for dynamical studies (e.g. Anguita et al. 2000), or even as means to determine very accurate distances to the foreground objects (Draine & Bond 2004). The launch of the Chandra X-ray Observatory – with its superb pointing accuracy and spatial resolution – enabled X-ray based searches, while microlensing campaigns (such as MACHO and OGLE) provided the possibility for variability-based identifications.
The fields of particular interest are nearby galaxies, such as the Magellanic Clouds. Application of new techniques resulted in the number of known quasars in the general direction of the Clouds more than trebling since 2002 (Dobrzycki et al. 2002, 2003a, 2003b; Geha et al. 2003), and this difference is more dramatic in the direction of the inner parts of the Clouds, where almost all presently known QSOs were discovered in recent years.
Despite the remarkable success shown by these methods, there remained an area which was still mostly unexplored: the bar of the Large Magellanic Cloud, where only four quasars were known. At the same time, this was the region where finding QSOs would be most interesting for studying the dynamics of the LMC. The expected proper motion at the distance to the LMC is of the order of only few miliarcseconds per year (Anguita et al. 2000 and references therein). To study bulk motions it is thus critical to have a sizable number of fixed reference points placed in “strategic” positions, preferably behind the bar.
There were two main reasons for the scarcity of known QSOs in this region. First, the X-ray-based searches – which are responsible for three out of four quasars behind the LMC bar – are limited by the relatively small number of Chandra pointings towards the LMC; on top of that the known fields have been only partially explored. Second, the only variability-based sample that has so far been followed up spectroscopically is the MACHO sample (Geha et al. 2003). This sample – although it is the biggest contributor to the number of known quasars in the vicinity of the LMC – has not been followed up completely, and the completed part is somewhat biased towards the outer parts of the LMC.
In this paper we present the results of the search for QSOs behind the Large Magellanic Cloud. The variability-based identification of candidates in the OGLE-II (Udalski et al. 2000; Żebruń et al. 2001) data, which cover 4.6 deg2 containing the bar of the LMC, was performed by Eyer (2002), and this list was the main part of our candidate pool. We also followed up on several candidates from the X-ray selected sample (Dobrzycki et al. 2002).
This work is a part of an ongoing project (Dobrzycki et al. 2002, 2003a, 2003b). The variability-based technique in the vicinity of the Small Magellanic Cloud turned out to be very efficient, nearing 40%, although the sample is rather small (five quasars among seventeen candidates). Due to several effects – some related to the intrinsic differences between the Clouds and some related to the nature of the OGLE data – the list of candidates in the direction of the LMC was expected to be more contaminated with non-quasars. See Sections 2 and 3 in Eyer (2002) for a discussion of those effects.
2 New quasars
2.1 Observations and identifications
The spectroscopic observations of the candidates were performed on several nights using two instruments. On 2002 January 22-23, 2002 November 07 and 17 we used the Magellan Baade 6.5-meter telescope, the LDSS-2 imaging spectrograph with 20482048 SITe#1 CCD, 1.03 arcsec slit and 300 l/mm MedBlue grism, yielding a nominal resolution of 13.3 Å. On 2004 December 13-17 we used the ESO 3.6-meter telescope, the EFOSC2 imaging spectrograph and Loral/Lesser 20482048 CCD#40 detector, 1 arcsec slit and 300 l/mm grism #06, yielding a nominal resolution of 12.9 Å.
During all nights, we observed Hamuy et al. (1992) spectrophotometric standards and took exposures of He-Ne-Ar lamps for wavelength calibrations. All spectra were reduced in the standard way using IRAF.


| J2000.0 coordinates | [mag] | Sel. | ID111Candidate identification in Eyer2002 | |
| J050514.37–700050.9 | 1.83 | 20.08 | Var. | L98 |
| J051244.64–693857.2 | 0.31 | 19.51 | Var. | L81 |
| J051433.58–693245.7 | 1.37 | 18.87 | Var. | L84 |
| J052141.75–703029.2 | 1.17 | 19.31 | Var. | L154 |
| J052627.69–693424.7 | 2.09 | 19.81 | Var. | L24 |
| J053400.06–703127.9 | 1.14 | 19.39 | Var. | L1 |
| J050550.35–675017.5 | 0.07 | 19.00 | X-ray | |
| J050900.76–672114.1 | 1.63 | 20.58 | X-ray | |
| J050940.60–685320.6 | 0.67 | 19.79 | X-ray |
2.2 Variability selected quasars
The set of candidates was constructed from the objects in the OGLE-II database of variable objects (Żebruń et al. 2001) using several criteria. In addition to colour-magnitude and colour-colour criteria, which removed many variable stars with known characteristics (e.g. Cepheids), a more elaborate criterion, aimed at selecting objects which (like QSOs) show larger variability on longer time scales, was applied. This was done by calculating variogram, a function showing time lag versus the spread of all magnitude differences than the lag. The variogram is steeper for objects which behave in the desired way, and an empirical cutoff on the variogram slope for long timescales was applied. See Eyer (2002) for details.
In total, the list of variability-selected QSO candidates contained 118 objects. One of them, object L92 in Eyer (2002), was identified as a QSO in the X-ray-based search of Dobrzycki et al. (2002). Of remaining objects, six were also identified as QSO candidates in the MACHO database by Geha et al. (2003). Two of those objects, L114 and L155, were identified as quasars at, respectively, and ; the other four objects turned out to be stars.
During our observing runs, we completed observations of 108 objects out of the remaining 111 candidates, identifying six of them as QSOs. OGLE light curves of those six quasars are shown in Figure 2. We do not see qualitative differences between quasars and stars in the appearances of their light curves, but see Section 3.3 below for discussion of possible quantitative difference between them in how variogram slope relates to variability scale.
We consider the sample to be fully observed, since the remaining three objects are very unlikely to be quasars, given their distinctly non-QSO colour properties (see Section 3.1).
Combined with three quasars identified previously, we found the original variability-selected sample to include nine identified QSOs, i.e. a 8% success rate. This is lower that the rate seen in a similar search in the direction of the Small Magellanic Cloud (Dobrzycki et al. 2003a) but, as mentioned earlier, not unexpected. The variability-selected quasars have emission redshifts ranging from 0.31 to 2.09, and their discovery spectra (Fig. 1) seem to show only typical quasar features.
2.3 X-ray selected quasars
During the runs we took several spectra of the X-ray selected candidates from the list from Dobrzycki et al. (2002). We refer the reader to this paper for detailed description of the sample; we only mention here that this sample is in no way homogeneous, therefore we will not derive any quantitative properties regarding the efficiency of the method or completeness of the resulting quasar harvest.
In total, we observed 30 objects. Of those, three turned out to be quasars, at emission redshifts of 0.07, 0.67 and 1.63. We note here that the first of them, QSO J050550.35–675017.5, is a relatively strong and highly variable X-ray source (observed Chandra ACIS-7 count rate of 0.12-0.38 counts/sec), and perhaps could be used for geometrical LMC distance determination using the method described in Draine & Bond (2004), although it is likely that a next generation X-ray telescope would be needed. We also note that this object was detected in the analysis of the XMM-Newton data by Shtykovskiy & Gilfanov (2005), but not identified as a QSO.
We also note that the narrow emission lines seen in the spectrum of QSO J050940.60–685320.6 near Å are not intrinsic to the quasar. The line of sight to this object intersects an emission nebula and those features are spectral extraction residuals from the [O iii] lines. The strong emission line is real; lack of other emission features in the spectrum identifies it as Mg ii2798 at .
The analysis of the properties of these and other QSOs seen in X-rays will be presented in the forthcoming paper. The non-quasars among the X-ray-selected objects were mostly low mass X-ray binaries and hot stars. We will present the analysis of those and other X-ray objects observed during the course of our project in a separate paper.
3 Properties of variability-selected quasars
Combining objects presented here with objects identified in previous studies, we end up with fourteen quasars selected from the OGLE-II LMC and SMC databases based on their variability: in the SMC five QSOs identified by Dobrzycki et al. (2003a), and in the LMC: six identified in this paper, two identified by Geha et al. (2003) and one by (Dobrzycki et al. 2002). This sample is quite well defined: all those objects were selected using the same technique from homogeneous, good quality photometric data. We will present below the analysis of some observable properties of those objects.
3.1 Colour-colour diagram

In Dobrzycki et al. (2003a) we found that variability-selected quasars could be distinguished from non-QSOs based on the colour, since quasars were typically redder than other variable candidates. This effect is clearly seen with new quasars added. In Figure 3 we show the vs. colour-colour diagram for all LMC and SMC candidates. One can clearly see that setting a cutoff at would dramatically increase the efficiency of the variability-based selection method, to 40–50%.
We note here that the three objects which were not observed – L142, L143 and L146 in Eyer (2002) – all have . Their location on Fig. 3 indicates that they are rather unlikely to be quasars.
It is, of course, a very well known fact that quasars preferable occupy specific regions in colour-colour diagrams and this information was applied to quasar surveys (e.g. Cristiani et al. 1989; Newberg & Yanny 1997; Newberg et al. 1999; Richards et al. 2001). However, we stress that the diagram presented in Fig. 3 only shows the distinction between colour properties of stars and quasars which were QSO candidates, already preselected with colour-based criteria. Applicability of this plot is therefore limited to our sample.
3.2 Brightness-colour relation
Several papers (e.g. Paltani & Courvoisier 1994; Helfand et al. 2001; Vanden Berk et al. 2004 and references therein) indicate existence of a brightness-colour relation in variable QSOs: quasars tend to be bluer in higher states.
In addition to a few hundred measurements in the band, the OGLE-II database provides a few tens of measurements in the and bands. It is therefore possible to investigate this effect in our sample.

The diagram in Figure 4 shows the parameters of the vs. relation obtained from linear least square fits. The x-axis shows the Pearson’s correlation coefficient while the y-axis shows the fitted slope and corresponding uncertainty. The objects in which the “brighter-bluer” effect was significant would occupy the upper right corner of Fig. 4, and their slopes would be significantly greater than zero.
One can clearly see that this effect is not generally present in our data. With the exception of two objects (both behind the SMC: S1 and S12 in Eyer 2002), most of our quasars do not show this effect and some even give an indication for opposite relation. This is somewhat curious since the effect is rather well established in the literature and one would expect that our set of objects was large enough to show it.
We note that the behaviour of the colour is quantitatively similar.
One cautionary note here is that sometimes the spectral bands include QSO emission lines in our objects. This can weaken the effect, since the lines may account for a sizeable fraction of the observed flux, while the effect is associated with continuum emission. Possible variability of emission lines – e.g. the Baldwin effect – may affect the result in our case.
We also note that if this effect was indeed seen it could serve as an auxiliary selection criterion since variable stars clearly do not follow this relation.
3.3 Amplitude-timescale relation

Analysis of variability properties of the objects in the sample appears to show an interesting phenomenon. In Figure 5 we plot the residual variability dispersion in OGLE-II data versus the variogram slope (see Eyer 2002) for all objects with known identifications.
There is no correlation between those two quantities for QSO candidates that turned out to be stars. However, a decent correlation () is seen for quasars, indicating that the magnitude of the QSO brightening is correlated with the timescale in which it occurs. In other words, unlike stars, quasars do not show large outbursts or long periods of relative calmness.
We emphasize that the above statements only apply to stars in the QSO candidate sample and not to stars in general. A similar effect would be seen in several types of variable stars, which were removed from the original QSO candidate sample by magnitude and colour cuts.
This effect should be verified on a larger sample. If it is confirmed, it can potentially be used to increase the efficiency of the candidate selection, by filtering out those of the stars that lie above and below the region in Figure 5 in which QSOs are found.
4 Discussion
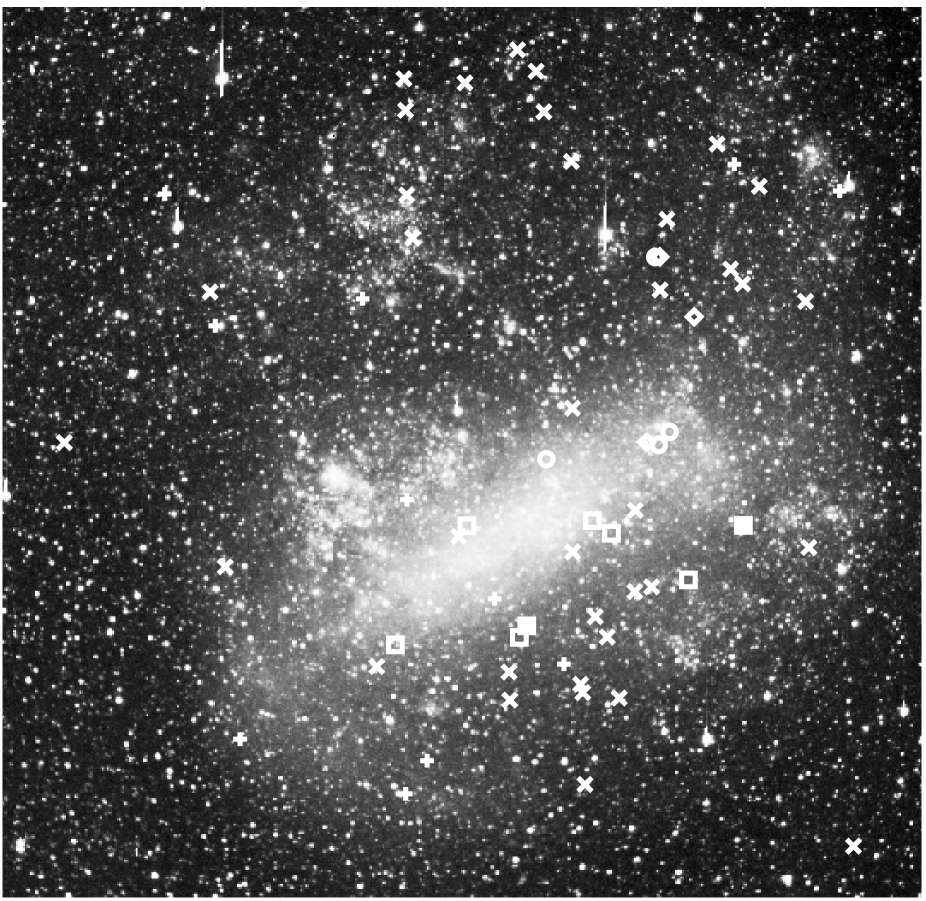
The quasars presented in this paper have increased the number of known QSOs in the direction of LMC by 18%. On Figure 6 we present the locations of the new quasars, together with the locations of previously known QSOs. In total, this picture shows 61 quasars. The image shows a large qualitative jump in the number of known objects since 2002.
However, the area in the direction of the LMC bar appears to be underrepresented. This is somewhat surprising. The QSO candidates were distributed quite uniformly over the bar, while the newly discovered objects are all on its outskirts. It is possible that some effects – for example, increased extinction or source crowding affecting variability analysis – do influence the candidate selection in the densest fields. However, since the number of object is still rather small, we are not in a position to determine whether a true bias is involved.
We confirm the result seen in the SMC data (Dobrzycki et al. 2003a) that the addition of the colour criterion to the variability selection procedure will lead to much higher efficiency in quasar searches, since QSOs are typically redder than other variability-selected objects. As expected, this distinction for the LMC objects was somewhat less strict compared to the SMC, but even here it would lead to very high, approaching 50%, success rates.
In our data we see a marginally significant correlation between the variability magnitude and the variability timescale. This correlation is entirely absent for variable stars from the QSO candidate pool. If this effect is confirmed, it can be used to increase the method efficiency even more.
Quasars from our sample do not generally follow the “brighter-bluer” relation seen in larger samples, such as SDSS. However, this may be affected by variability of the QSO emission lines, which enter observed photometry bands.
We plan to utilise the variability selection method for searching for quasars behind the Galactic Bulge, in low extinction windows monitored by OGLE-II (see Sumi et al. 2005). A successful search would carry great hope for studies of the dynamics of the Bulge, since the expected proper motions are much larger than in the Magellanic Clouds.
Acknowledgements.
We thank B. Czerny, B. Paczyński, S. Paltani, G. Richards and A. Siemiginowska for helpful discussions, and the referee, M. Geha, for thorough and helpful review. We thank I. Saviane and the La Silla personnel for excellent support during our observing run at the La Silla observatory, and P. Challis for observing some candidates for us with the Magellan telescope. This research has made use of the NASA/IPAC Extragalactic Database (NED), operated by the Jet Propulsion Laboratory, California Institute of Technology, under contract with NASA, and of the SIMBAD database, operated at CDS, Strasbourg, France. LMM was supported by the Hubble Fellowship grant HF-01153.01-A from the Space Telescope Science Institute, which is operated by the Association of Universities for Research in Astronomy, Inc., under NASA contract NAS5-26555.References
- Anguita et al. (2000) Anguita, C., Loyola, P., & Pedreros, M. H. 2000, AJ, 120, 845
- Cristiani et al. (1989) Cristiani, S., Barbieri, C., La Franca, F., Iovino, A., & Nota, A. 1989, A&AS, 77, 161
- Dobrzycki et al. (2002) Dobrzycki, A., Groot, P. J., Macri, L. M., & Stanek, K. Z. 2002, ApJ, 569, L15
- Dobrzycki et al. (2003a) Dobrzycki, A., Macri, L. M., Stanek, K. Z., & Groot, P. J. 2003a, AJ, 125, 1330
- Dobrzycki et al. (2003b) Dobrzycki, A., Stanek, K. Z., Macri, L. M., & Groot, P. J. 2003b, AJ, 126, 734
- Draine & Bond (2004) Draine, B. T., & Bond, N. A. 2004, ApJ, 617, 987
- Eyer (2002) Eyer, L. 2002, Acta Astronomica, 52, 241
- Geha et al. (2003) Geha, M., et al. 2003, AJ, 125, 1
- Hamuy et al. (1992) Hamuy, M., Walker, A. R., Suntzeff, N. B., Gigoux, P., Heathcote, S. R., & Phillips, M. M. 1992, PASP, 104, 533
- Helfand et al. (2001) Helfand, D. J., Stone, R. P. S., Willman, B., White, R. L., Becker, R. H., Price, T., Gregg, M. D., & McMahon, R. G. 2001, AJ, 121, 1872
- Newberg et al. (1999) Newberg, H. J., Richards, G. T., Richmond, M., & Fan, X. 1999, ApJS, 123, 377
- Newberg & Yanny (1997) Newberg, H. J., & Yanny, B. 1997, ApJS, 113, 89
- Paltani & Courvoisier (1994) Paltani, S., & Courvoisier, T. J.-L. 1994, A&A, 291, 74
- Prochaska et al. (2002) Prochaska, J. X., Ryan-Weber, E., & Staveley-Smith, L. 2002, PASP, 114, 1197
- Richards et al. (2001) Richards, G. T., et al. 2001, AJ, 121, 2308
- Shtykovskiy & Gilfanov (2005) Shtykovskiy, P., & Gilfanov, M. 2005, A&A, 431, 597
- Sumi et al. (2005) Sumi, T., et al. 2005, MNRAS, 356, 331
- Udalski et al. (2000) Udalski, A., Szymański, M., Kubiak, M., Pietrzyński, G., Soszyński, I., Woźniak, P., & Żebruń, K. 2000, Acta Astronomica, 50, 307
- Vanden Berk et al. (2004) Vanden Berk, D. E., et al. 2004, ApJ, 601, 692
- Żebruń et al. (2001) Żebruń, K., et al. 2001, Acta Astronomica, 51, 317