Intergalactic HeII absorption towards QSO 1157+3143 ††thanks: Based on observations with the NASA/ESO Hubble Space Telescope, obtained at the Space Telescope Science Institute, which is operated by Aura, Inc. under NASA contract NAS 5 - 26555. Based on observations from the German-Spanish Astronomical Center, Calar Alto, and based on observations at the Keck Observatory.
We report the discovery of a further line of sight allowing detection of He ii Ly absorption by the intergalactic medium. A HST/STIS survey of 32 bright quasars selected from the Hamburg Quasar Surveys yielded one detection toward QSO 1157+3143 (). A 10 orbit follow-up spectrum reveals a UV spectrum significantly supressed by two intervening Lyman limit systems at and , but with the continuum flux recovering sufficiently shortward of to allow study of the He ii absorption spectrum in the redshift range . The absorption is characterized by alternating voids and dense filament structures seen in both He ii and H i. Attempts to model the He ii opacity in terms of H i Ly forest absorption are not successful in the voids, suggesting that He ii reionization is not complete between and or that an optically thin Lyman limit system with is responsible for the additional opacity.
Key Words.:
Quasars: individual: QSO 1157+3143 - Quasars: absorption lines - Cosmology: observations1 Introduction
Among the important results in observational cosmology in the past decade is the detection of intergalactic He ii 304 Å absorption in a few lines of sight, e.g. Q 0302-003 (Jakobsen et al. jak (1994)), PKS 1935-6914 (Tytler et al. tyt (1995)), HS 1700+6416 (Davidsen et al. dav (1996)), and HE 2347-4342 (Reimers et al. rei1997 (1997)). In particular, it has been shown that for the He ii absorption is optically thick, i.e. no remnant flux has been observed, while for the He ii opacity becomes patchy (first seen in HE 2347-4342) which provided strong evidence for a delayed cosmic He ii reionisation phase around redshift 3 (Reimers et al. rei1997 (1997)). Tentative independent observational evidence for the reality of the delayed He ii reionisation phase comes from the observation of a sudden increase in the line widths of Ly forest lines in the redshift range between 3.5 and 3.0 interpreted as reheating of the IGM due to He ii reionisation (Ricotti et al. ric (2000), Schaye et al. sch (2000), Theuns et al. the (2002)). Thus observations indicate that He ii reionisation started around redshift 3.5 and was complete around where the last surviving patches of He ii between the He iii Strömgren sphere finally become optically thin. This final “patchy” phase, the transition between continuous, “black” absorption () and the reionized phase, the He ii Ly forest, which has been resolved for the first time by FUSE observations of HE 2347-4342 for (Kriss et al. kri (2001)), is actually not well covered by existing observations. It is seen only in Q 0302-003 () and in HE 2347-4342 (). In this paper we report on He ii observations of a third case in the line of sight of HS~1157+3143 = CSO118 (, , ), hereinafter called QSO 1157+3143, which covers the redshift range to . The clear line of sight to this quasar has been discovered in HST/STIS survey programs on altogether 32 bright QSOs from the Hamburg objetive prism QSO surveys. We will show that the QSO 1157+3143 observations confirm the above outlined picture of He ii reionisation and show in addition for the first time large scale structure in the He ii opacity.
2 Observations
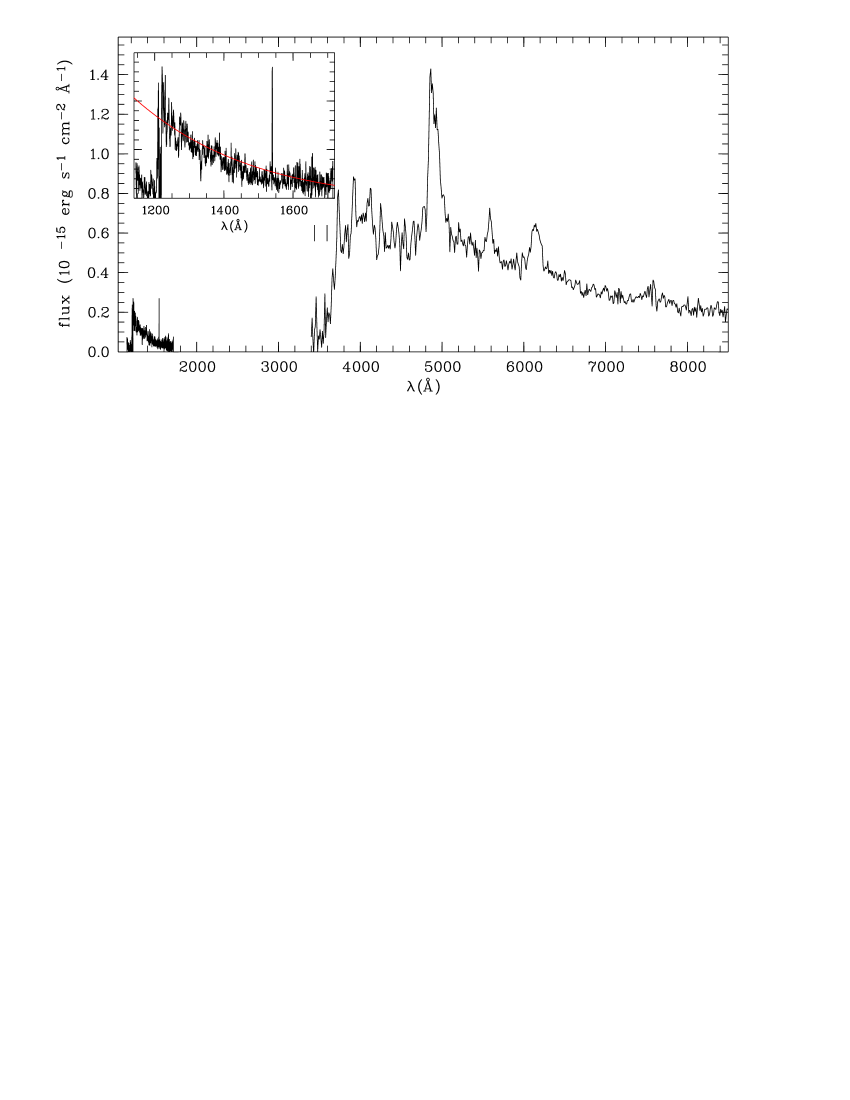
The small number of He ii detections (altogether 6 including the present one) is due to the fact that the He ii 304 Å line is accessible only in high-redshift QSOs ( with HST) and that the chances to find a clear line of sight is only of the order of a few percent at redshift 3. The He ii 304 Å line lies deep in the Lyman continuum where the continuum fluxes of the vast majority of high redshift quasars are severely absorbed by intervening neutral hydrogen contained in the Ly forest and especially the denser Lyman limit systems encountered at all redshifts along the line of sight (Møller & Jakobsen mol (1990)). This opacity – when combined with typical brightnesses of quasars at redshifts of the order of 3 needed to reach the He ii 304 Å transition – effectively confines He ii absorption measurements to continuum sources having fluxes of order (Picard & Jakobsen pic (1993)). We have therefore in the late 1980s embarqued on a basically all – extragalactic – sky survey for bright quasars based on objective prism Schmidt plates taken with the Calar Alto and ESO Schmidt-telescopes (Hagen et al. hag (1995), Wisotzki et al. wis (1996)). UV follow-up spectroscopy on the brightest targets () which appeared to be free from Lyman limit and strong metal line absorption has been conducted subsequently with IUE, HST and FUSE in several survey programs (for a more detailed description cf. Reimers & Köhler rei1997 (1997)). The two brightest objects in which the He ii Ly forest has been resolved with FUSE, HE 2347-4342 (Kriss et al. kri (2001)) and HS 1700+6416 (Reimers et al. rei2004 (2004)) have been discovered already with IUE to have ’clear’ lines of sight (Reimers et al. rei (1989),rei1997 (1997)). QSO 1157+3143 was discovered to have a transparent line of sight in the course of 2 HST survey programs (GO 7471 and GO 8287) on altogether 32 bright targets from the Hamburg surveys. Only one successful detection, namely QSO 1157+3143, resulted from this survey. A success rate of 3 % is roughly consistent with the prediction of Picard & Jakobsen (pic (1993)) and with the result of a similar program on fainter QSOs from the SDSS (Zheng et al. 2004a ). QSO 1157+3143 was first detected in the course of the CASE Survey as CSO118 (Everett & Wagner eve (1995)). With it is only a factor of 2 fainter than HE 2347-4342 (Fig. 1). However, its UV flux is largely absorbed by two intervening Lyman limit systems at and (Kirkman & Tytler kir (1999)). The rest frame redshift of the QSO is difficult to measure. Everett & Wagner (eve (1995)) give from a low resolution spectrum using C iv and Ly. The Ly forest in QSO 1157+3143 begins at which is probably closer to the truth. QSO 1157+3143 has been detected to have a non zero flux redward of the expected position of the onset of He ii absorption at in a 1 orbit exposure. Spectral data of this quasar in the UV range were obtained with the HST/STIS. The log of observations is given in Table 1. Since the flux level in the wavelength region with He ii absorption is extremely low (), special care has been taken to determine the background. The main difference to the pipeline reduction was that we determined the background on the co-added 2D frame. The resulting spectrum is shown in Fig. 4a. In Fig. 1 we display the HST/STIS spectrum in combination with a flux calibrated low resolution spectrum taken with CAFOS at the Calar Alto 2.2m telescope. Fig. 2 shows an enlarged section of the STIS spectrum. In addition, QSO 1157+3143 has been observed for a total of 7 hrs in 1996 March and 1997 January with the HIRES spectrograph on the W. M. Keck telescope. The resulting spectrum has a resolution of and a per pixel (cf. Kirkman & Tytler kir (1999)).

| Telescope | Spectrograph | Resolution | Exp time | Date | |
|---|---|---|---|---|---|
| Calar Alto 2.2m | CAFOS | 2.0 Å | 600 s | March 4 1997 | |
| HST | STIS G140L | 2365 s | Oct 30, 2001 | ||
| STIS G140L | 26820 s | July 2003 | |||
| Keck | HIRES | 38000 | 7 hrs | Dec 96/Jan 97 |
3 Observational results
In this section we analyse the He ii absorption seen shortward of in terms of Ly forest absorption. The He ii 304 Å forest has been resolved by FUSE in HE 2347-4342 and HS 1700+6416. In particular we wish to find out whether all He ii absorption seen is due to the normal Ly forest or whether additional “continuous” He ii absorption due to patches of not yet reionized matter are present in the redshift range 2.75 to 2.97.
3.1 The continuum redward of 1220 Å
For an analysis of the He ii opacity, good knowledge of the QSO continuum is necessary. Due to the high He ii opacity for , the continuum is nowhere detectable directly and has to be determined by an extrapolation from the continuum redward of 1220 Å. As can be seen from Fig. 4, the UV continuum of the QSO is dominated by strong Lyman limit absorption around 3600 Å from which the continuum recovers thanks to the dependence of the Lyman continuum opacity on frequency . We model the QSO continuum in two steps. First we determine the optical depth of the Lyman continuum absorption by a comparison with the extrapolated QSO continuum (Fig. 1). As discussed by Kirkman & Tytler (kir (1999)), there are probably two LLS, one at and one at . From the available data it is impossible to decide unambiguously which one is dominant for the optically thick Lyman continuum absorption in the UV, since the LLS blots out the spectrum below 3600 Å, and the Lyman lines Ly to Ly are all saturated. Our guess is that the system responsible for most of the Lyman continuum absorption is the system at . It is a complex, multiphase absorption system with at least 5 components which contains sharp lines from ions like Si ii, C ii, or Si iii, broad lines of C iv, and even broader lines of O vi (Kirkman & Tytler kir (1999)). However, for the total optical depth of the combined system, which we determine from the height of the continuum for , the exact position of the effective Lyman limit ( versus ) is less important than the assumed run of the QSO continuum shortward of 4000 Å (cf. Fig. 1). With an assumed power law QSO continuum between 4000 Å and 8000 Å, a good fit to the UV continuum between and yields at or which corresponds to .
3.2 The continuum in the He ii forest
Having modelled the observed continuum between 1220 Å and 1700 Å we assume that this continuum can be extrapolated to . We neglect galactic extinction which is low given to the galactic latitude () of the quasar. According to Stark et al. (sta (1992)), . With a galactic extinction curve this corresponds to an increase in galactic extinction between and by 4 %, negligible compared to the other uncertainties in determining the continuum. The final adopted continuum is shown in Fig. 1. The mean optical depth is at . This is comparable to for in Q 0302-003 (Heap et al. hea (2000)). In the voids (I-V) the typical optical depth is . Notice, however, the discussion on the possible contribution by an optical thin Lyman limit system (next section).
3.3 Analysis of the H i and He ii Ly forest
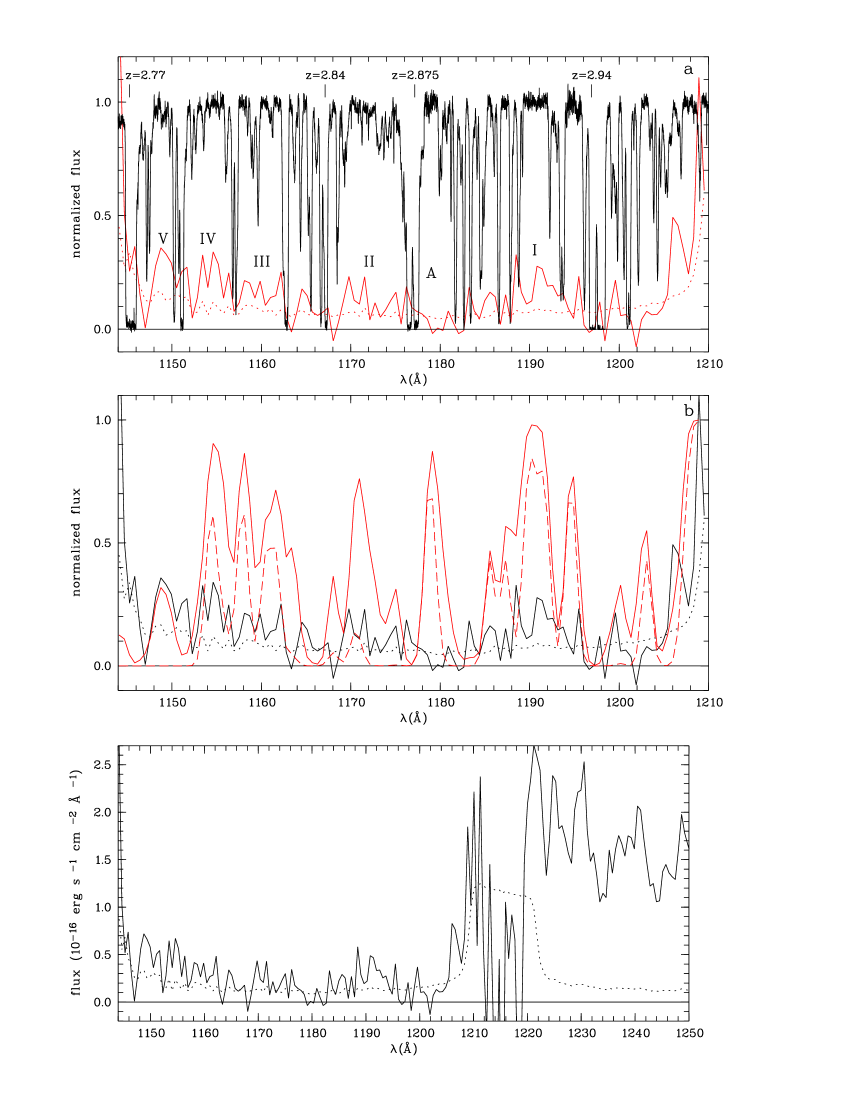
An overlay of the STIS (He ii) data with the Keck/HIRES data is presented in Fig. 4a. The H i wavelength scale has been divided by a factor of 4.00178 in order to align the H i with the He ii absorption. Although the signal to noise of the STIS He ii spectrum is very low (), it can easily be seen that the opacity gaps in He ii (numbered I to V) correspond to gaps in the H i Ly forest, so that modelling of the He ii absorption seems worthwhile. As known from high-resolution FUSE spectra of the He ii 304 Å forest in HE 2347-4342 (Kriss et al. kri (2001), Shull et al. shu (2004), Zheng et al. 2004b ), and in HS 1700+6416 (Reimers et al. rei2004 (2004)), the He ii forest can be reproduced roughly by scaling a model of the H i Ly forest using Doppler profiles with a constant column density ratio . The Ly forest model is represented by a list of wavelengths, broadening parameters and column densities for all relevant Ly lines. Metal lines have been identified and removed from the H i Ly forest spectrum first. In a first approximation, we assume which is close to the mean value found, e.g., for HE 2347-4342 (Kriss et al. kri (2001)) and HS 1700+6416 (Reimers et al. rei2004 (2004)), and adopt pure turbulent broadening. Fig. 4b shows this synthesized spectrum in comparison with the observed spectrum. However, in the voids I to V the model He ii spectrum predicts much less He ii opacity than observed even for . Computing a , we find the probability that the models are correct to be for and for , respectively. The reason for the discrepancy might be that with the of of the Keck/HIRES spectrum, the low cutoff of the Ly forest is at , while higher spectra allow a better placement of the continuum and show that the Ly forest extends to (e.g. Kirkman & Tytler kir1997 (1997)). Assuming a power law according to Kirkman & Tytler (kir1997 (1997)), we can predict the number of Ly lines below our cutoff. We have performed a number of numerical experiments distributing the weak Ly lines () in different ways and assuming to . It turns out, that the He ii opacity in the gaps I and III-V cannot be explained in this manner, even with extreme assumptions (). One possible conclusion is that the intergalactic medium in the range in this particular line of sight is not yet fully reionized in He ii. The reason might be that we are in a strongly overdense region where He ii reionisation is further delayed. This is consistent with the observation, that Q 1157+3143 has a particularly rich metal absorption spectrum. Ganguly et al. (gan (2001)) found on low resolution spectra 7 C iv doublets between and , compared to two expected and suggested superclustering at as a possible reason. We confirm this finding. In the redshift range shown in Fig. 4a, there are four strong metal absorption systems associated with high column density Ly and He ii absorption: and . The 2.94 and 2.77 systems are Lyman limit systems with complex metal line absorption typically spread over a large velocity range of () and (). The system has at least 3 C iv components (also Si iv, Si iii). The 2.84 system consists of 2 close C iv pairs separated by . The sequence of Ly + He ii “voids” alternating with strong H i + He ii + metal line absorption indeed reminds us of the filament - void structure of the IGM. The “void” sizes are typically several Mpc, e.g. void II between ’filaments’ and has a size of (comoving).
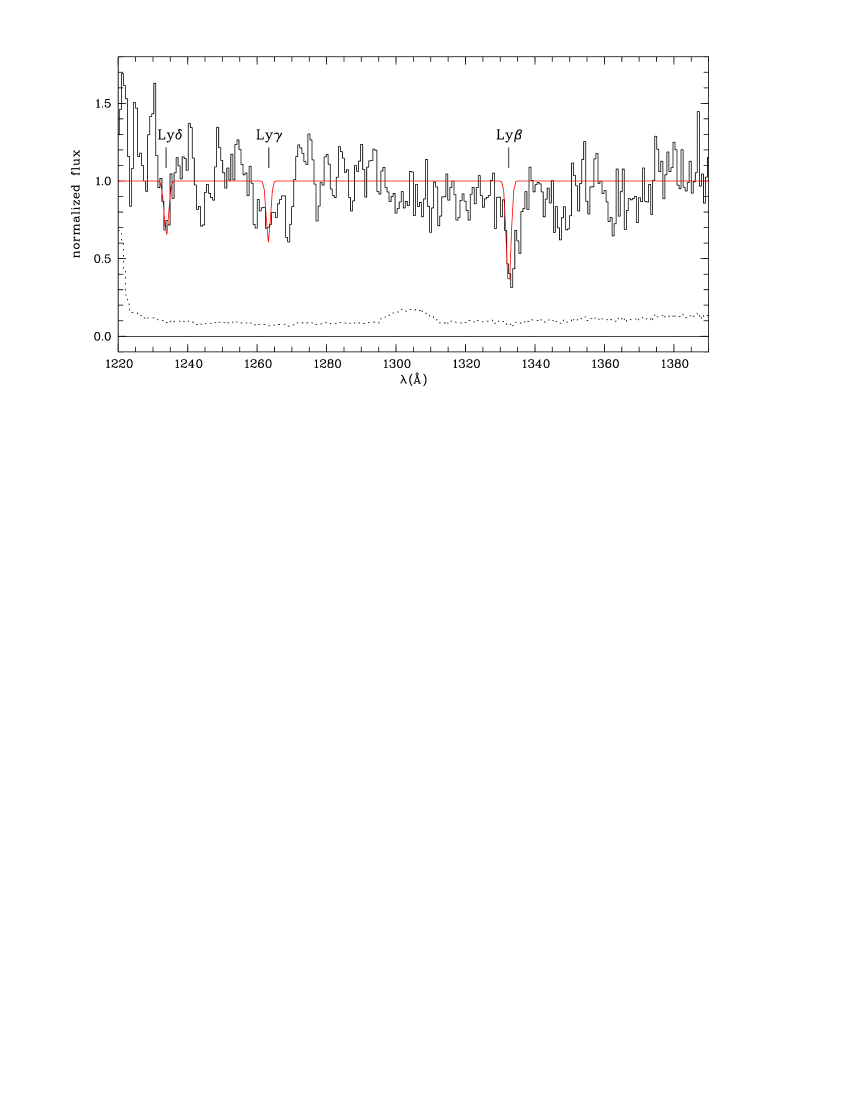
We briefly discuss an alternative explanation for the observed high opacity in the He ii forest which avoids the need for very high -values and/or a contribution due to incomplete reionization as late as . Assuming that a low redshift Lyman limit system is responsible for the reduction of the flux in the opacity gaps I – V, its optical depth must be of the order of unity at 1160 Å, and its redshift according to its nonvisibility above 1220 Å. As shown in Fig. 3, there is some observational evidence for a Lyman series at visible in Ly (blended with IS C ii 1335 Å), Ly and Ly. The strong line at 1270 Å could be C iii 977 Å at . Ly is also visible but at such low that modelling is meaningless. The calculated Lyman limit system model shown in Fig. 3 assumes and , where the latter is the best fit for the given column density. We conclude that this model is consistent with the observations. This model shows that the and Lyman lines would cause a depression of roughly 50 % at 1190 Å which explains most of the ”missing opacity” in the opacity gap I (Fig. 4a). Some additional absorption must be due to IS Si ii 1190/1193, since QSO 1157+3143 does show weak IS Ca ii lines in our Keck spectrum. The model predicts that for the discrepancy between the predicted and the observed He ii spectrum can be explained by the postulated LLS. We have also studied a possible contribution by other metal line systems and found no significant contribution among the known 21 metal line systems. Even in case of HS 1700+6416 with its extremely rich metal line spectrum (at least 7 Lyman limit systems, Reimers et al. rei1992 (1992)) only 13 % of the He ii forest features are affected (Reimers et al. rei2004 (2004)).
We also notice that around (region A in Fig. 4b) there is strong He ii absorption without corresponding H i absorption, similar to the not yet reionized patches seen in HE 2347-4342 (Reimers et al. 1997). Compared to other lines of sight. in particular that of HE 2347-4342, the He ii reionization is less complete in the voids (I-V). Numerical simulations (e.g. Fardal et al. far (1998)) show that indeed the intensity fluctuations in the He ii continuum are much larger than in the H i continuum. The reason is that the He ii attenuation sphere is smaller and the QSOs with hard (flat) spectra are rarer than the steep-spectrum QSOs (cf. Shull et al. shu (2004)). QSO 1157+3143 itself is probably the nearest quasar with a steep (), soft spectrum which may explain the nonvisibility of a proximity effect.
4 Discussion
In this paper we have analysed STIS (He ii) and Keck/HIRES data in the redshift range to toward QSO 1157+3143. From previous He ii observations, in particular of HE 2347-4342 (Reimers et al. rei1997 (1997), Smette et al. sme (2002), Kriss et al. kri (2001)) and Q 0302-003 (Heap et al. hea (2000)), we know that in this redshift range we observe the transition from ’black’ absorption troughs () through patchy He ii absorption (alternating black troughs and optically thin He ii absorption, ) to a more homogeneously ionized He ii Ly forest which is formed in the reionized phase. This has been interpreted as the final breakthrough and rapid completion of He ii reionisation, where the deep absorption troughs seen in HE 2347-4342 between and are not yet reionized patches. The He ii data of QSO 1157+3143 confirm this picture in that such troughs (remnant He ii regions between He iii regions) are also seen at and . In addition, attempts to model the He ii absorption in the “voids” I to V by means of the Ly forest with column densities as low as , have been largely unsuccessful. We suspect, that He ii reionisation is not complete even in “voids” due to large overdensities of the IGM just in front of QSO 1157+3143. The three QSOs with He ii spectra covering the redshift range to map the phase where the remaining He ii blobs between the expanding He iii regions finally become optically thin. In Table 2 we compare the three lines of sight.
| Lowest with | Highest with | |
|---|---|---|
| with | remnant | |
| no corresponding H i | QSO flux | |
| HE 2347-4342 | 2.83 | 2.87 |
| Q 0302-003 | 2.88 | 2.90 a |
| QSO 1157+3143 | 2.88 | 2.92 |
-
a
Except the low opacity feature which is due to the transverse proximity effect by a QSO close to the line of sight (Jakobsen et al. jak2003 (2003)).
The results shown in Table 2 indeed give a consistent picture of the final phase of He ii reionisation. The transition from optically thick He ii absorption remaining from the not yet reionized phase () to the phase where reionisation is complete occurs between and . The relatively precise measurement of the completion of an important cosmic epoch has to be reproduced by future theoretical models of He ii reionisation. However, we also note that cosmic variance cannot be neglected.
A further new result seen so far only in QSO 1157+3143 is the clear indication of a filament/void structure in the intergalactic He ii 304 Å opacity. That this can be seen in spite of the poor quality of the He ii data is due to the fact that the line of sight of QSO 1157+3143 is particularly rich in strong metal line systems in the redshift range . Between these high density structures also seen in the Ly forest, there are a number of clear voids (structures I - V in Fig. 4a) in the Ly forest, i.e. the “density contrast” in the large scale structure is particulary strong just in front of this QSO. Without the LLS absorption, the filament/void structure would have been more pronounced in the He ii forest.
5 Summary
This paper contributes with QSO 1157+3143 a new line of sight for studying intergalactic He ii absorption. We have obtained low resolution HST/STIS spectra of the He ii 304 Å forest and high-resolution Keck/HIRES spectra of the corresponding H i Ly forest. Both in He ii, H i and in strong metal line systems the line of sight towards QSO 1157+3143 shows for an alternating sequence of voids (He ii and H i absorption weak) and filaments (He ii, H i strong, complex C iv etc. lines). Due to the rich, high-contrast large scale structure in front of QSO 1157+3143, this phenomenon has been seen for the first time in He ii in this line of sight. We also observe the patchiness of the He ii opacity seen first in HE 2347-4342 (Reimers et al. rei1997 (1997)), i.e. remnant strong He ii opacity spots without H i counterparts like region A (Fig. 4a) at , further evidence for not yet completed He ii reionisation. Even in the “voids” (regions I-V in Fig. 4a), reionisation of He ii is probably not complete, since the He ii opacity cannot be modelled by means of the Ly forest alone. Together with HE 2347-4342 and Q 0302-003, the line of sight towards QSO 1157+3143 provides further evidence that the transition between optically thick He ii absorption left over from the not reionized phase to reionisation being completed occurs between and .
Acknowledgements.
We thank the referee for valuable comments which helped to improve the paper. This work has been supported by the Verbundforschung of the BMBF/DLR under Grant No. 50 OR 9911 1. DT and DK were supported by STScI grant GO-9350, and in part by NSF grant AST-0098731 and NASA grant NAG5-13113.References
- (1) Davidsen, A. F., Kriss, G. A., Zheng, W. 1996, Nature 380, 47
- (2) Everett, M. E. & Wagner, R. M. 1995, PASP 107, 1059
- (3) Fardal, M. A., Giroux, M. L.. & Shull, J. M. 1998, AJ 115, 2206
- (4) Ganguly, R., Charlton, J. C. & Bond, N. A. 2001, ApJ 553, L 101
- (5) Hagen, H.-J., Groote, D., Engels, D. & Reimers, D. 1995, A&AS 111,1
- (6) Heap, S., Williger, G. M., Smette, A. et al. 2000, ApJ 534, 69
- (7) Jakobsen, P., Boksenberg, A., Deharveng, J. M. et al. 1994, Nature 370, 35
- (8) Jakobsen, P., Jansen, R. A., Wagner, S. & Reimers, D. 2003, A&A 397,891
- (9) Kirkman, D. & Tytler, D., 1997, ApJ 484, 672
- (10) Kirkman, D. & Tytler, D., 1999, ApJ 512, L5
- (11) Kriss, G. A., Shull, J. M., Oegerle, W. et al. 2001, Science 293, 1112
- (12) Møller, P. & Jakobsen, P. 1990, A&A 228, 299
- (13) Picard, A. & Jakobsen, P. 1993, A&A 276, 331
- (14) Reimers, D., Clavel, J., Groote, D. et al. 1989, A&A 218,71
- (15) Reimers, D., Vogel, S., Hagen, H.-J. 1992, Nature 360, 561
- (16) Reimers, D., Köhler, S., Wisotzki et al. 1997, A&A 327, 890
- (17) Reimers, D., Köhler, S., Hagen, H.-J. & Wisotzki, L. 1998, in Ultraviolet Astrophysics beyond the IUE Final Archive, ESA-SP 413 (ed. R.A. Harris) p. 579
- (18) Reimers, D., Fechner, C., Kriss, G. A. et al. 2004 in Astrophysics in the Far Ultraviolet, ASP Conf. Series, astro-ph/0410588
- (19) Ricotti, M., Gnedin, N. V. & Shull, J. M. 2000, ApJ 534, 41
- (20) Schaye, J., Theuns, T., Rauch, M. et al. 2000, MNRAS 318, 817
- (21) Shull, J. M., Tumlinson, J., Giroux, M. L., Kriss, G. A. & Reimers, D. 2004, ApJ 600, 570
- (22) Smette, A., Heap, S., Williger, G. M. et al. 2002, ApJ 564, 542
- (23) Stark, A. A., Gammie, C. F., Wilson, R. W., Bally, J. & Linke, R. A. 1992, ApJ 579, 77
- (24) Theuns, T., Schaye, J., Zaroubi, S. et al. 2002a, ApJ 567, L103
- (25) Tytler, D. & Davis, C. 1995, ApJ 438, 420
- (26) Wisotzki, L., Köhler, T., Groote,D., & Reimers,D. 1996, A&A 115, 227
- (27) Zheng, W., Chin, K., Anderson, S. F. et al. 2004, AJ 127, 656
- (28) Zheng, W., Kriss, G. A., Deharveng, J.-M. et al. 2004, AJ 605, 605