Molecular Hydrogen Excitation around Active Galactic Nuclei111Based on observations at the European Southern Observatory VLT (69.B-0075).
Abstract
We report Very Large Telescope ISAAC K-band spectroscopy of the nuclei (i.e. central 100–300 pc) of nine galaxies hosting an active galactic nucleus. For five of these we also present spectra of the circumnuclear region out to 1 kpc. We have measured a number of molecular hydrogen lines in the , , and vibrational transitions, as well as the Br and He i recombination lines, and the Na i stellar absorption feature. Although only three of the galaxies are classified as type 1 Seyferts in the literature, broad Br (FWHM 1000 km s-1) is seen in seven of the objects. The emission appears thermalised at temperatures K. However, the and emission show evidence of being radiatively excited by far-ultraviolet photons. The photo-dissociation region models that fit the data best are, as for the ultraluminous infrared galaxies in Davies et al. (2003), those for which the H2 emission arises in dense clouds illuminated by intense FUV radiation. The Na i stellar absorption line is clearly seen in six of the nuclear spectra of these AGN, indicating the presence of a significant population of late type stars. It is possible that these stars are a result of the same episode of star formation that gave rise to the stars heating the PDRs. It seems unlikely that the AGN is the dominant source of excitation for the near infrared H2 emission: in two of the nuclear spectra H2 was not detected at all, and in general we find no evidence of suppression of the 2-1 S(3) line, which may occur in X-ray irradiated gas. Our data do not reveal any significant difference between the nuclear and circumnuclear line ratios, suggesting that the physical conditions of the dominant excitation mechanism are similar both near the AGN and in the larger scale environment around it, and that star formation is an important process even in the central 100 pc acround AGN.
1 Introduction
Molecular hydrogen (H2) emission lines include some of the brightest lines in the near infrared K-band and are therefore commonly targeted as diagnostic lines. Comparing the ratios in several or more rotational and vibrational transitions allows one to probe the physical conditions of molecular clouds which are illuminated by incident far ultraviolet (FUV) radiation or heated by shocks. A number of authors have also suggested that X-ray irradiation from active galactic nuclei (AGN) may excite bright H2 line emission, a conclusion based primarily on the ratio of the H2 1-0 S(1) line to other emission lines or quantities (Kawara et al., 1987, 1990; Mouri et al., 1989, 1990). Veilleux et al. (1997) thought that this could be important, but that shocks excited by nuclear outflows is a likely mechanism for heating H2 in many Seyfert 2 galaxies. Quillen et al. (1999) rule out X-ray heating as the dominant source of H2 emission due to the lack of correlation between 1-0 S(1) and hard X-ray flux. Instead, because they spatially resolve the H2 in a number of Seyfert 2 galaxies and one Seyfert 1, they suggest that a variety of different processes are probably involved depending on the object. The extended nature of the H2 emission in this Seyfert 1 was confirmed by Davies et al. (2005), who also found extended H2 emission in other type 1 AGN (Davies et al., 2004a, b).
In this paper, we address the issue of H2 excitation in and around AGN from a different perspective: using the ratios of the H2 lines themselves across several vibrational levels to constrain the dominant excitation mechanism. This can be a very powerful tool as shown, for example, by our application of H2 excitation models to ultraluminous infrared galaxies (ULIRGs) (Davies et al., 2003). The evidence above that H2 can be extended in both type 1 and type 2 AGN suggests that active star formation, which typically occurs over large (0.1-1 kpc) scales, could be a good candidate for its origin. This premise is strengthened by the increasing evidence for active star formation in the tens to hundreds of parsecs around both Seyfert 2s (Cid Fernandes et al., 2004; Storchi-Bergmann et al., 2001; González Delgado et al., 2001) and Seyfert 1s (Davies et al., 2004a, b, 2005). We therefore address whether: (1) the dominant H2 excitation mechanism either close around an AGN or in its wider environment is consistent with excitation in photo-dissocation regions, as one might expect if it originates from star formation; and (2) whether suppression of the 2-1 S(3) can be taken as an indicator of X-ray irradiated gas in AGN, as has been proposed theoretically and observationally (Black & van Dishoeck, 1987; Draine & Woods, 1990; Krabbe et al., 2000). To do so, we have undertaken longslit observations of the 9 Seyfert galaxies listed in Table 1, including both type 1 and type 2 Seyferts, although the classification is often an indistinct issue. In order to analyse these, we have divided them into two groups: five which are near enough ( Mpc) to study both the nuclear and circumnuclear H2 line ratios separately; four which are further away ( Mpc), and for which only a nuclear spectrum was extracted.
After describing the observations and data reduction in Section 2, we discuss how the stellar continuum was removed and the line fluxes measured in Section 3. Notes on the individual objects in our sample are given in Section 4 before addressing the issues of star formation around the AGN and H2 excitation in Sections 5 and 6 respectively. Finally, our conclusions are presented in Section 7.
2 Observations and Data Reduction
Our data were obtained as part of the service observing programme at the Very Large Telescope between May and August 2002 in seeing of typically 0.8″ in the K-band.
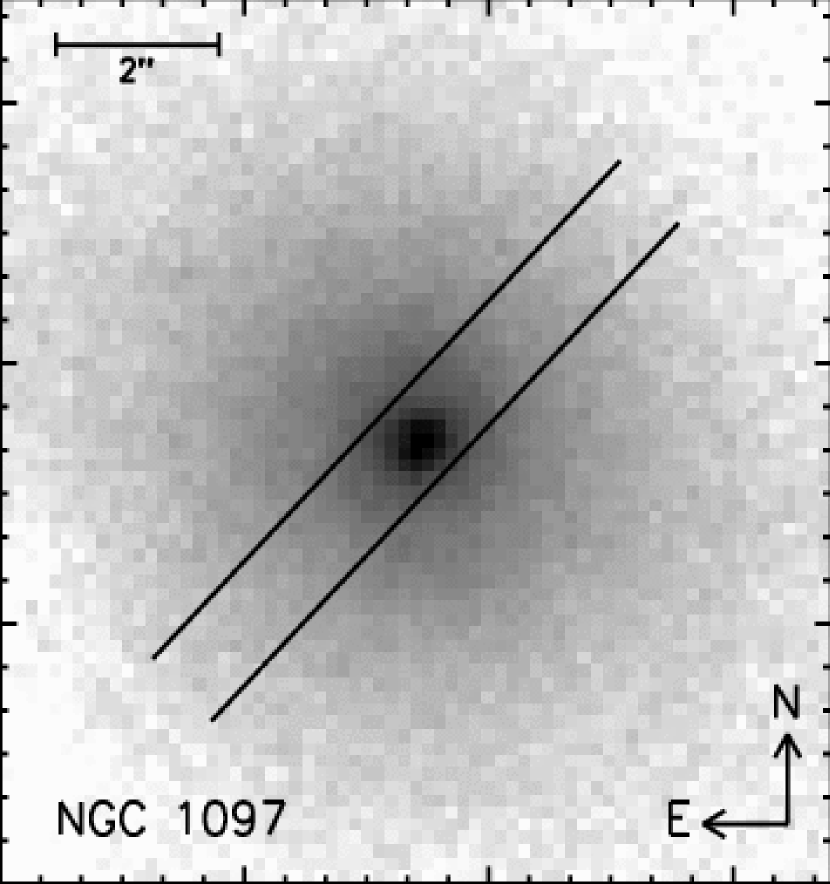
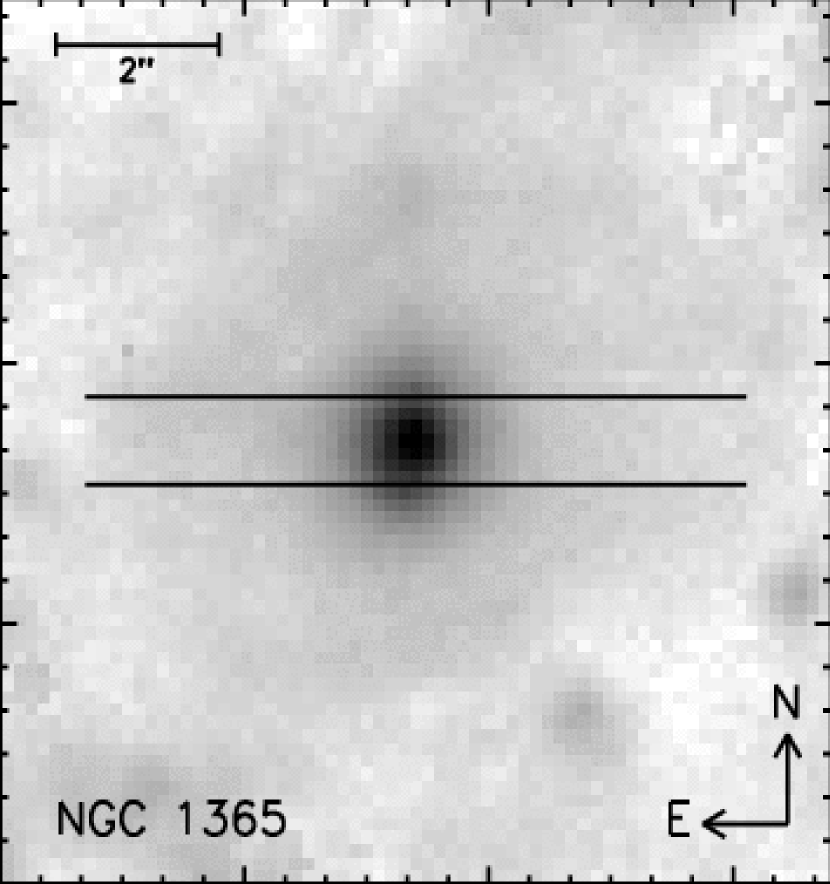
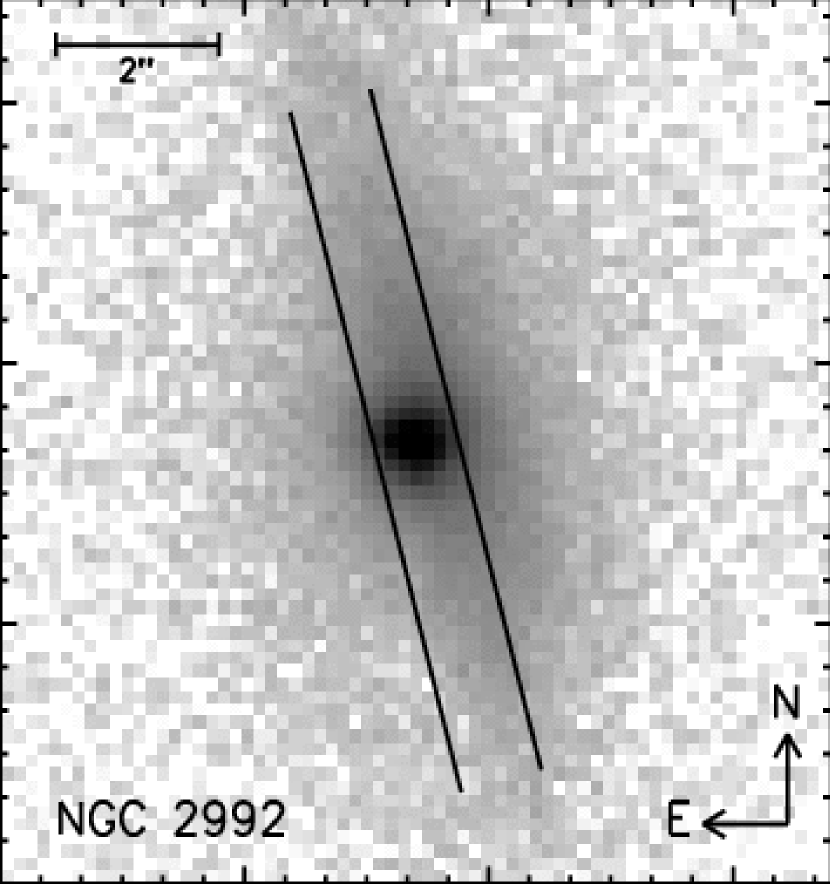
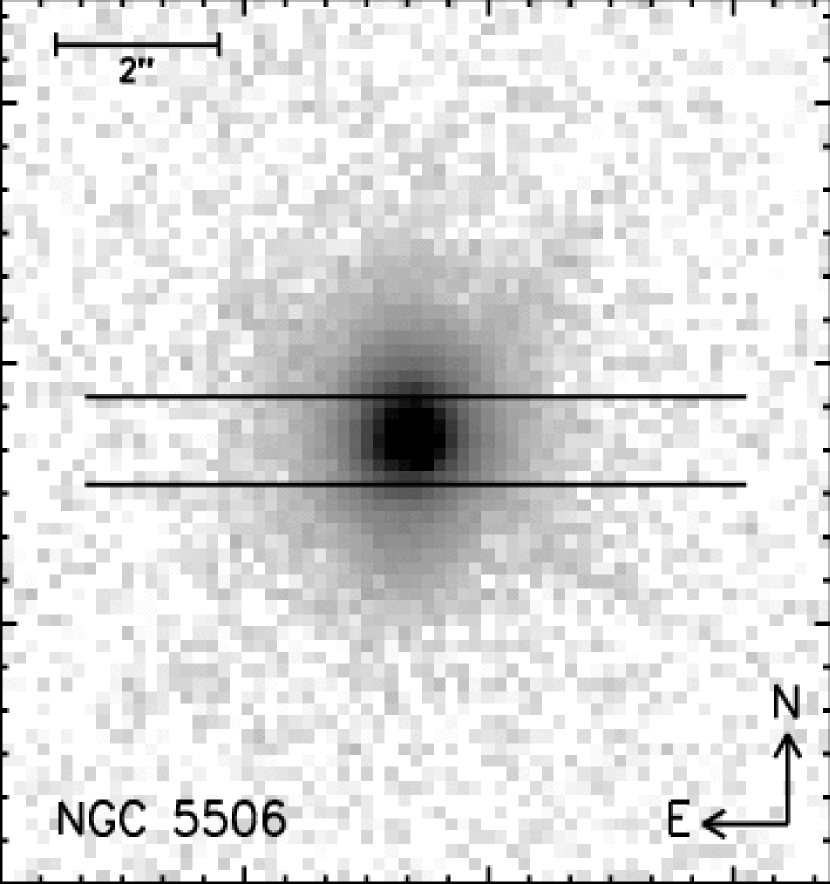
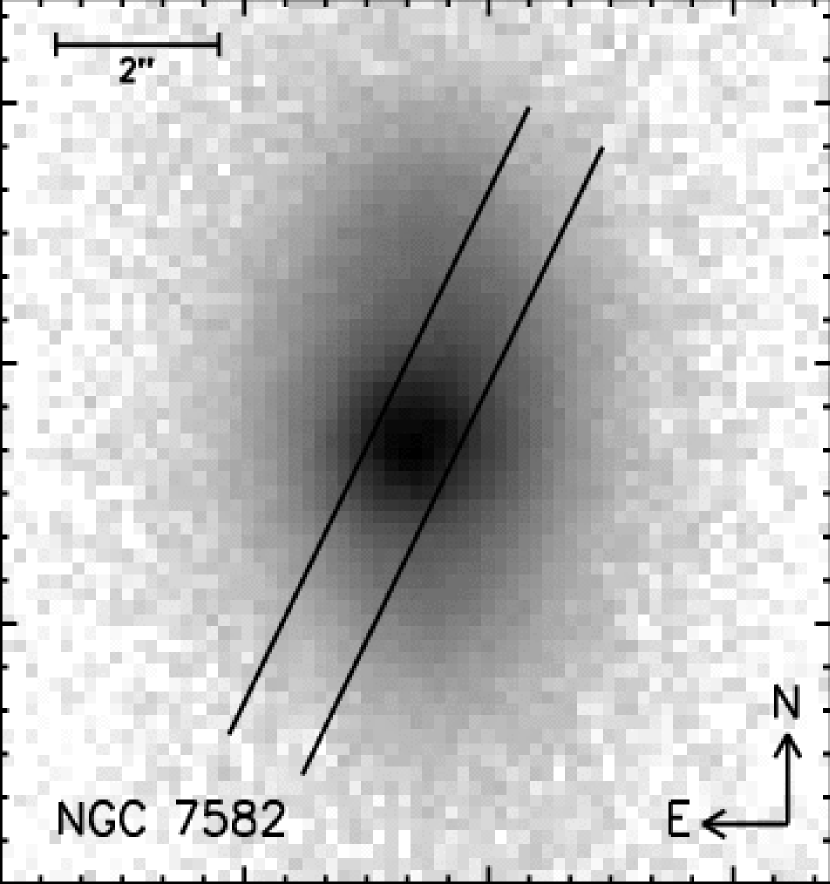
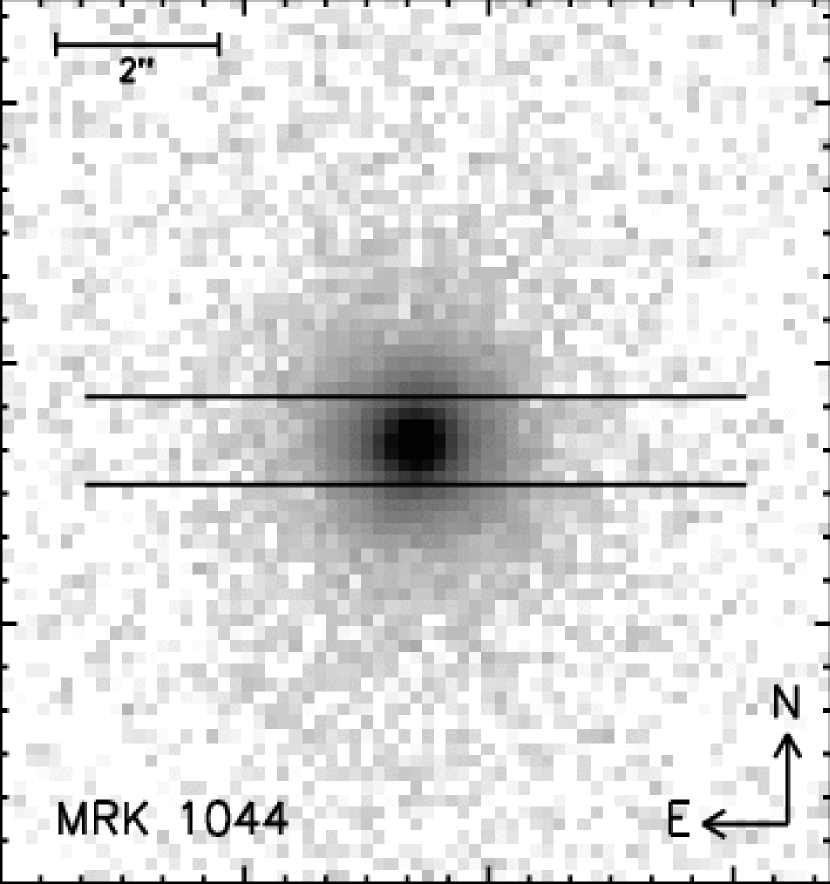
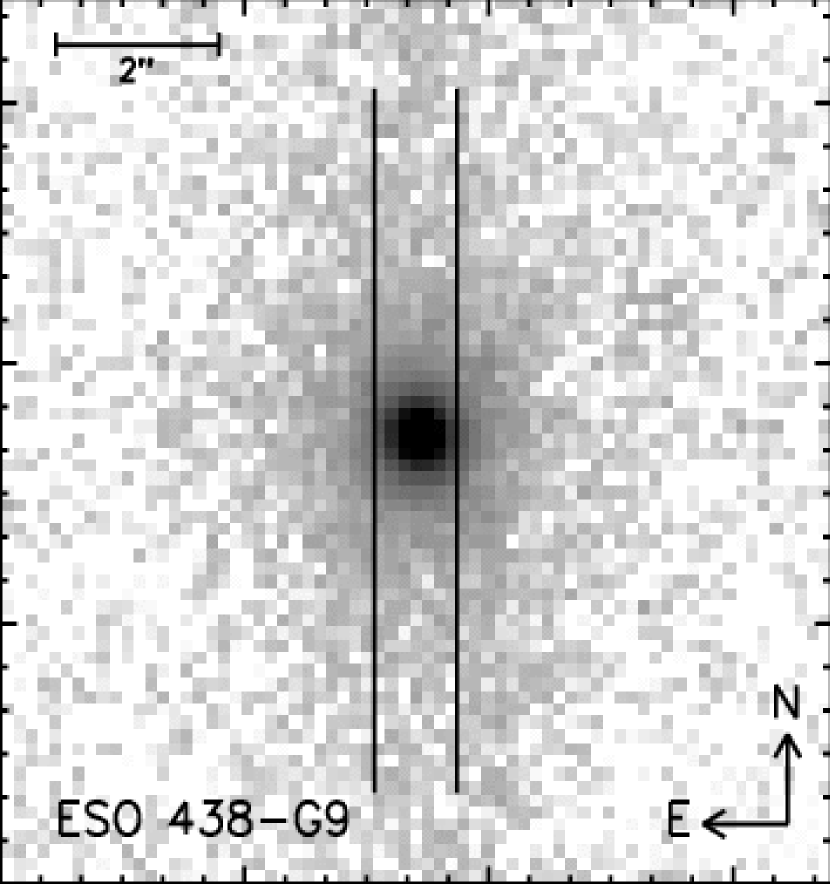
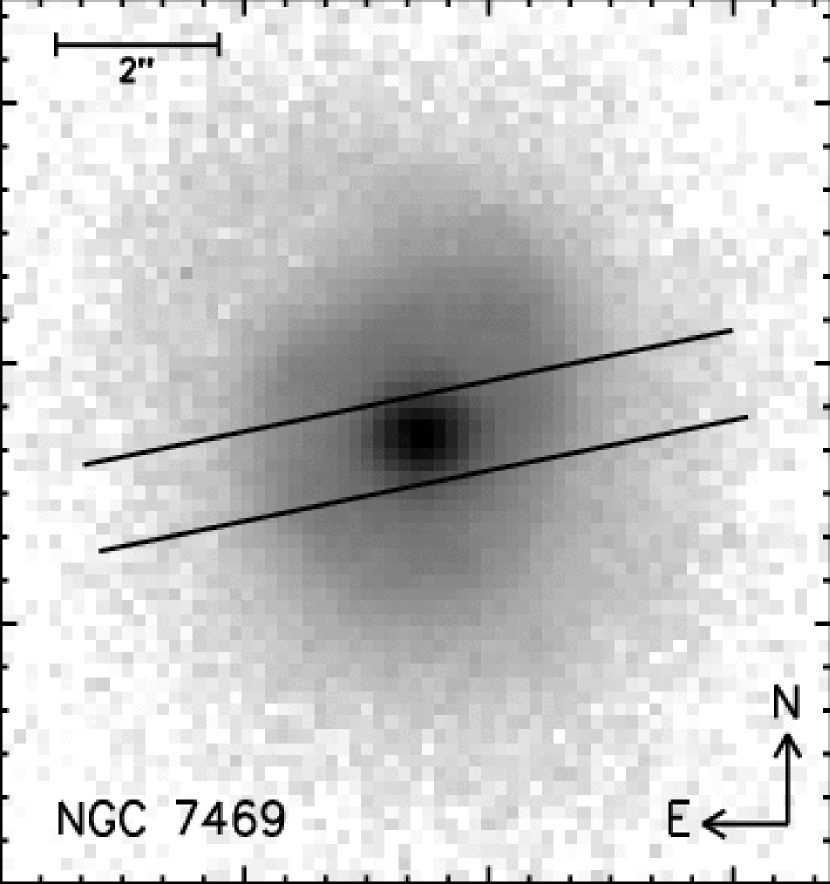
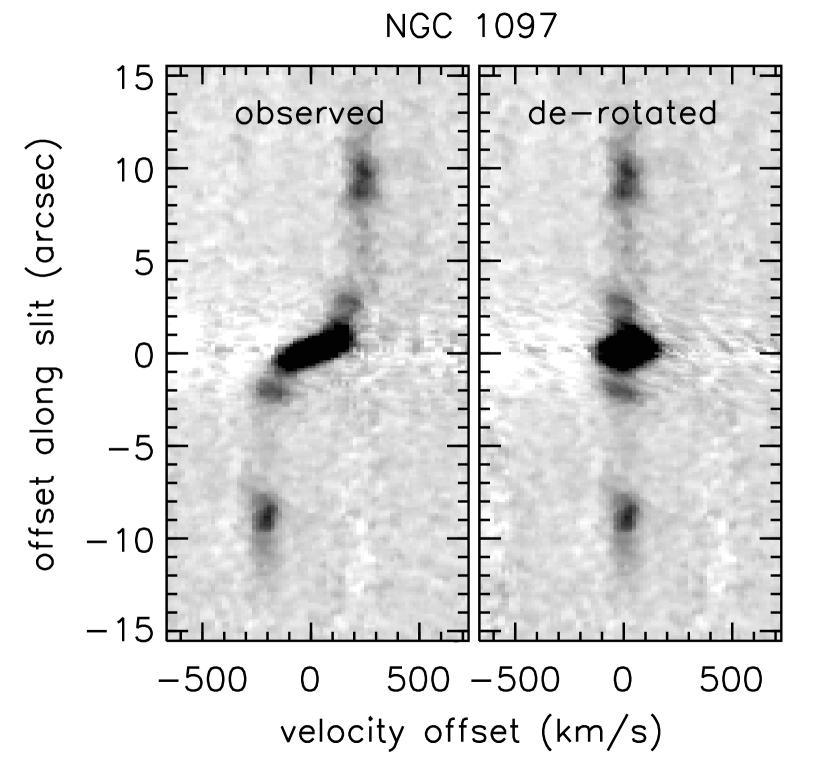
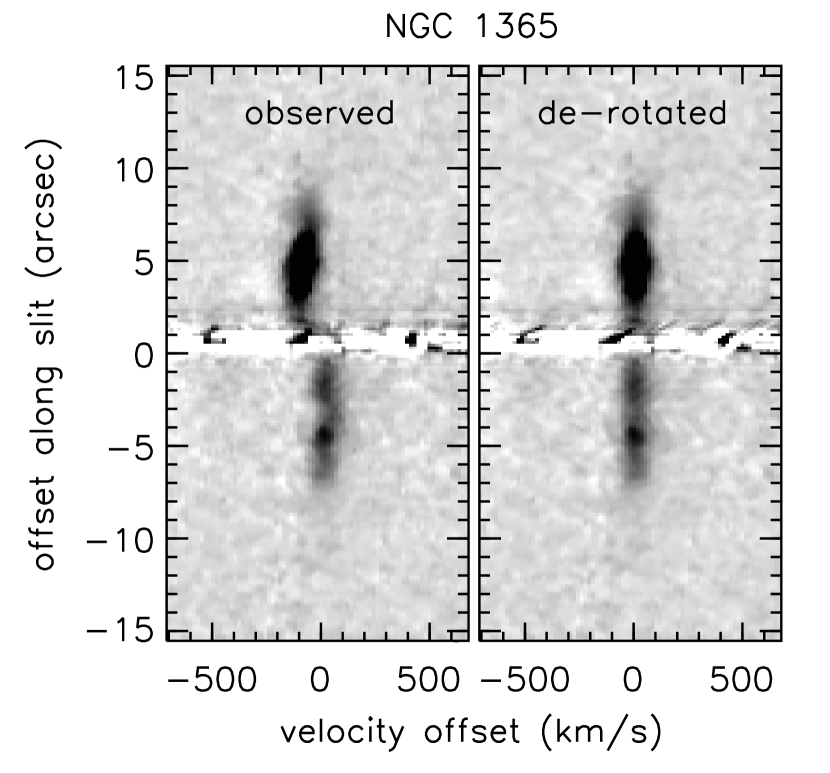
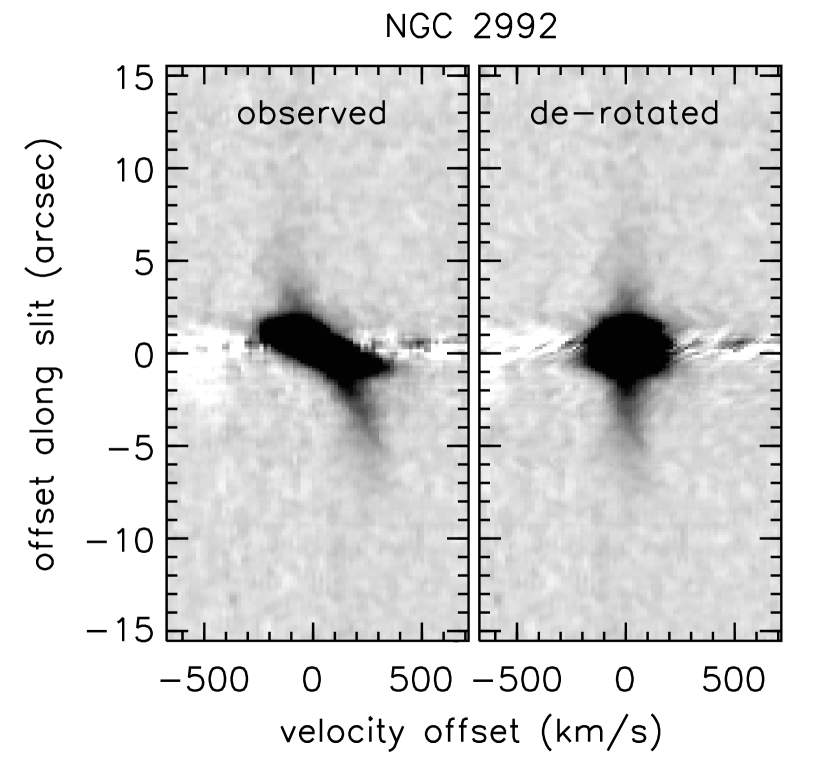
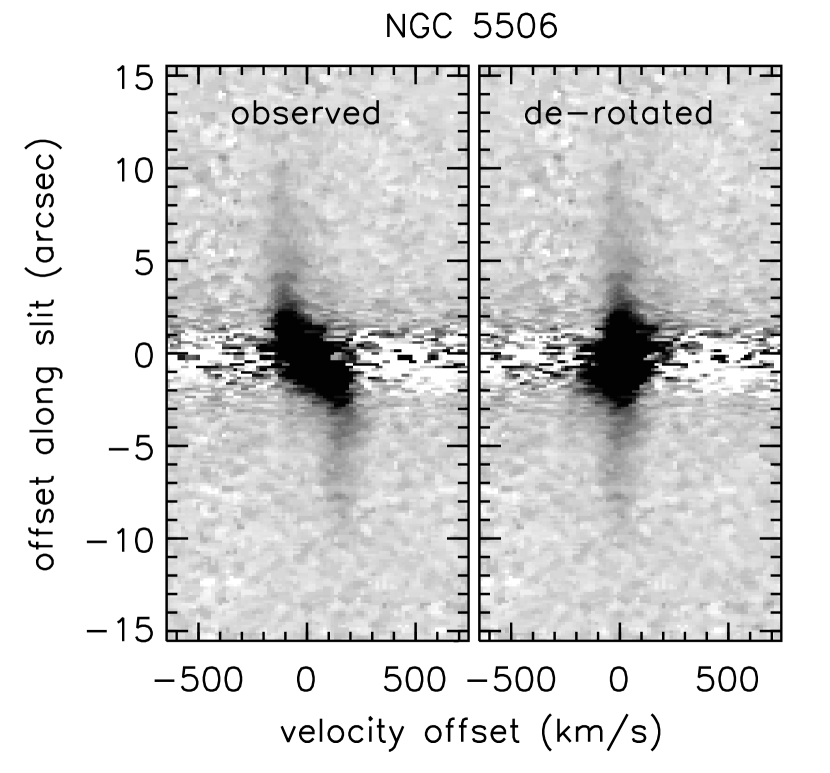
Acquisition images with integration times of a few seconds were taken before each spectrum through a narrow band filter near to 2.1 µm. These are shown in Fig. 1 together with the orientation of the slit across the nucleus of each object. The position angle of the slit was set to lie along the major axis of the object as determined from 2MASS K-band or red Digitised Sky Survey images. Where there was no clear axis, the slit was set east-west.
ISAAC was used in Medium Resolution mode in the K-band, providing a nominal resolution of with a 1″ slit. Since the wavelength coverage in this mode is only 0.122 µm, two settings were used with an overlap of 5–10%. The total integration time was 2000 seconds per setting. Standard calibrations were performed, including atmospheric standard stars (type B or G2V), arcs, flatfields, and dark frames. The data were reduced using PC-IRAF 2.11.3 using standard techniques. Wavelength calibration was achieved by tracing the sky lines to create a transformation which removed curvature, at the same time as applying the final wavelength scale. It was found that the spectral slope in each row of the object spectra had a small residual curvature which depended on the position of the row. This curvature was removed without affecting the overall slope of each spectrum, allowing a much better merging of the two wavelength segments. However, this does mean there could be some uncertainty in the slope of the resulting spectra. The merging was performed on the 2-dimensional spectra, convolving the observation which had better seeing with a Moffat function to match the one which had poorer seeing. At the same time the fluxes of the two spectra were scaled according to their overlapping regions.
The flux calibration was derived from the standard stars, the K-band magnitudes of which were extracted from the 2MASS Point Source Catalogue. There was a very good correspondance between these magnitudes and those estimated from the colour of the spectral type and V-band magnitude, the difference being on average 0.15 mag. Slit losses are compensated to zero order by the standard star for each observation. No further correction was applied since the main theme of the analysis involves line ratios rather than absolute fluxes. Since also the change in atmospheric dispersion in the K-band is small, the data are unaffected by differential slit losses.
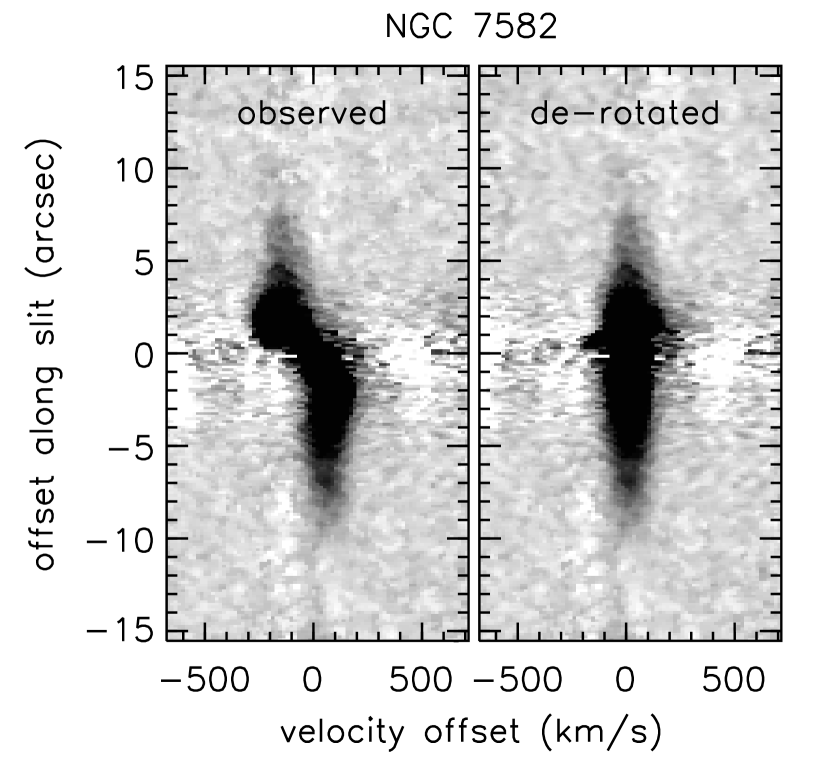
The final step in the data reduction was to de-rotate the spectra, as shown in Fig. 2, to straighten the rotation curves. The advantage this brings is twofold. It restricts the spectral width of all the lines (emission and absorption) in a spectrum extracted over a long aperture; and it decorrelates the noise introduced by systematic residuals from imperfect telluric correction, since these features are no longer aligned with the spatial axis. Thus the signal to noise in the spectral features that we wish to measure is significantly increased. The procedure was performed on the 5 nearby objects, since their rotation curves could be traced out beyond the nucleus. For each of these, the velocity shift of the 1-0 S(1) line was measured in each spatial row where the line was sufficiently well detected. These rows were shifted to a zero offset position. All other spatial rows were shifted according to a function (the error function, since it provides a simple smooth approximation to a typical rotation curve) which was fit to the rows where the line offset could be measured.
3 Spectral Decomposition: Continuum Fitting and Line Fluxes
For all the galaxies listed in Table 1, we have extracted spectra from the nuclear region, which we define as the central 1″ (to match the typical seeing). This includes everything within 60 pc (for the nearby galaxies) or 190 pc (for the more distant galaxies) of the AGN. Additionally, for the nearby galaxies we have extracted a circumnuclear spectrum, which we define as everything outside the central 2″ (to reject any nuclear emission) and up to 1 kpc from the AGN. Estimations of the contamination of the circumnuclear flux by the nuclear flux in each case and for the ambient seeing indicate that this is less than 10% in the worst case and typically 1% or less.
As for our previous work on ultraluminous galaxies (Davies et al., 2003), we have fit stellar templates (F–M type supergiants from the library of Wallace & Hinkle 1997) to the continuum in order to be able to measure the line emission accurately. However, because of the broad Br in most of the nuclear spectra, it was not practical to mask out regions with line emission. Instead, spectra were fit simultaneously with stellar templates and both broad and narrow emission lines. The wavelengths of the lines were fixed, and they were assumed to have the same redshift as the stellar continuum. However, the minimisation was allowed to adjust the velocity width of the lines (one width for all the narrow lines, and one for all the broad lines). While this procedure can match the continuum well, it provides poor estimates of (particularly the weak) line fluxes – since these are affected by local over-/underestimates in the relative level of the continuum. The line fluxes were therefore remeasured by fitting Gaussian functions of fixed width to the spectrum after the fitted continuum had been subtracted. The uncertainties were estimated from the standard deviation of the local residual (covering a spectral range 10 times the FWHM of the line) and the line widths using Monte Carlo techniques. Specifically, a spectral segment was constructed to have the same statistical noise properties as the actual residual spectrum, to which a Gaussian profile of the measured flux and FWHM was added. A new Gaussian profile was then fitted to the segment, producing slightly different parameters. This was repeated 10000 times, yielding the uncertainties. Limits were derived in a similar way. We caution that while this treatment accurately estimates uncertainty from random noise, it cannot account for systematic error such as
The absolute flux scaling is given in Table 2, and the line ratios and uncertainties are tabulated in Table 3.
The circumnuclear spectra of all the targets except NGC 5506 had deep absorption features. For these we assumed there was no contribution from hot dust, but allowed the extinction to vary in order to match the spectral slope. For NGC 5506, the very weak Na i absorption at 2.206 µm suggests that the near infrared is not dominated by late-type stars, perhaps because there is a significant hot dust component – even away from the nucleus. The residual broad Br also suggests that there may be some contamination from the nucleus. For this spectrum we not only allowed the extinction to vary, but added a thermal component at K representing hot dust. Although there is some degeneracy between these two effects since they both change the spectral slope, the primary aim is to remove the effect of the absorption features rather than uniquely identify the components comprising the continuum; and in this respect the process is successful. The results of this continuum fitting procedure for the circumnuclear regions are shown in Fig. 3.
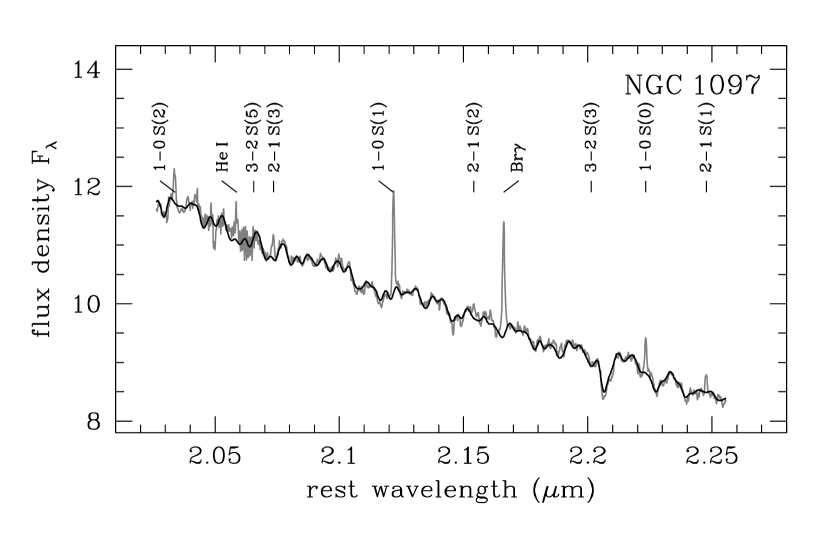
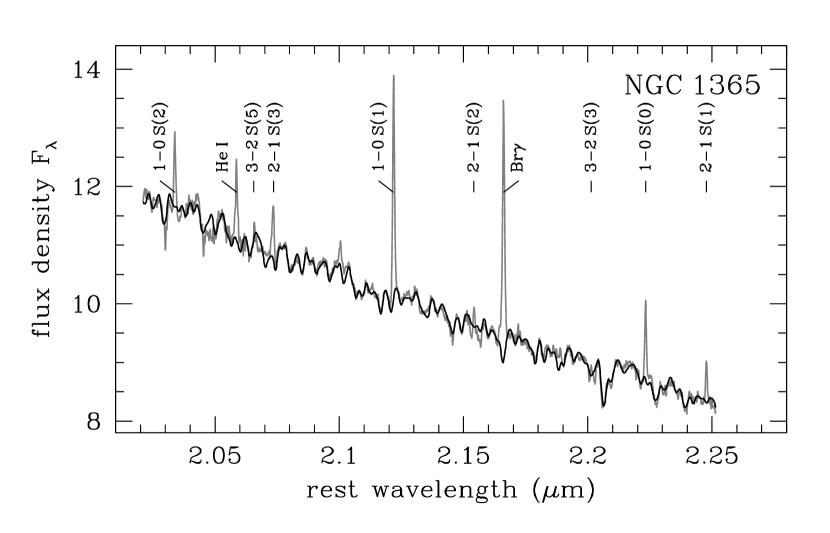
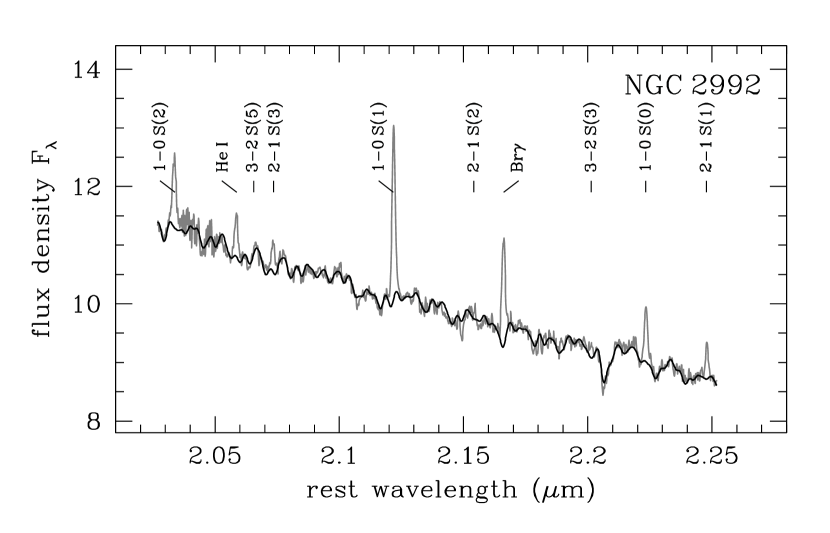
In all cases except NGC 1097, the stellar features in the nuclear spectra are much less clearly defined. There are two important reasons for this: 1) the redder spectral slope indicates that there is a significant contribution from hot dust, which dilutes the stellar continuum and adds to the noise; 2) one would expect a higher velocity dispersion in the nucleus (particularly if the stellar population is dynamically hot) which, combined with the steep rotation curve (albeit corrected) and seeing lead to a large broadening of the features. In fitting the continuum we have, in each case except NGC 1097, left both the K hot dust contribution and the extinction as free parameters. The results of the continuum fitting procedure for the nuclear regions are shown in Fig. 4 for the nearby objects and Fig. 5 for the more distant objects.
4 Object Notes
In this section we summarise some notes about the objects in our sample, in order to put into context our data and the results we discuss later.
NGC 1097
The classification of NGC 1097 as a Seyfert 1 is based on its broad H line (Storchi-Bergmann et al., 1993) and hard X-ray excess (Iyomoto et al., 1996), although the AGN is low luminosity. The black hole mass is nevertheless expected to be – M⊙, based on the stellar velocity dispersion and M relation (Storchi-Bergmann et al., 1993) – an order of magnitude more massive than that in the very active NGC 7469 (Collier et al., 1998). Monitoring the broad H over a timespan of 11 yrs, Storchi-Bergmann et al. (2003) indicated that the luminosity decreased to 1/3 of its initial value over this period. During our observations there was no evidence of broad Br and, assuming a velocity width of 7500 km s-1 FWHM (similar to that for the total broad H line), we can impose a 3 limit of W m-2 (1″ aperture) just consistent with the broad H flux measured towards the end of 2001 if extinction is negligible. However, it is plausible and more likely that the broad component continued dimming towards the middle of 2002 when our data were taken. The narrow Br is also weak in the nucleus, with a flux of W m-2 in a 1″ aperture, indicating that there is little current star formation. The last episode may have ceased relatively recently, as suggested by the very deep absorption features which even with the use of supergiant templates we have difficulty matching. NGC 1097 therefore offers an excellent opportunity to study the distribution and dynamics of the stars in the region close around a (quiescent) AGN. Our detection of strong H2 1-0 S(1) in the nuclear region is in stark contrast to the lack of such emission in the spectrum of Sosa-Brito et al. (2001), and we can offer no explanation for this difference.
NGC 1365
NGC 1365, a strongly barred galaxy in the Fornax cluster, has been reviewed extensively by Lindblad (1999). Its AGN exhibits both broad and narrow components to the H line, the FWHM of the former being 1800 km s-1 (Alloin et al., 1981), somewhat wider than the km s-1 we find for the Br line. Assigning 1800 km s-1 to the broad component in our data would only be possible if the narrow component had FWHM 500 km s-1, in conflict with Alloin et al. (1981) reporting it as unresolved. The soft X-ray (0.1–2.5 keV) luminosity, which can in principle be explained entirely in terms of star formation, suggests the AGN is of rather low luminosity (Stevens et al., 1999). On the other hand, the presence of a relatively unabsorbed power law component at higher (up to 10 keV) energies and a 6.6 keV Fe K emission line indicate that there must be an AGN (Iyomoto et al., 1997). The ionisation cone, seen in [O iii] and with kinematics indicative of outflowing gas, was modelled by Hjelm & Lindblad (1996), who found that the cone axis lay close to the galaxy’s rotation axis and the opening angle was sufficient to include the line of sight to the partially obscured Seyfert nucleus. The galaxy has a prominent circumnuclear ring at a distance of 5–10″ from the nucleus, which is actively forming stars. It has been observed in both recombination line and optical/infrared/radio continuum emission and is also clearly seen in our data.
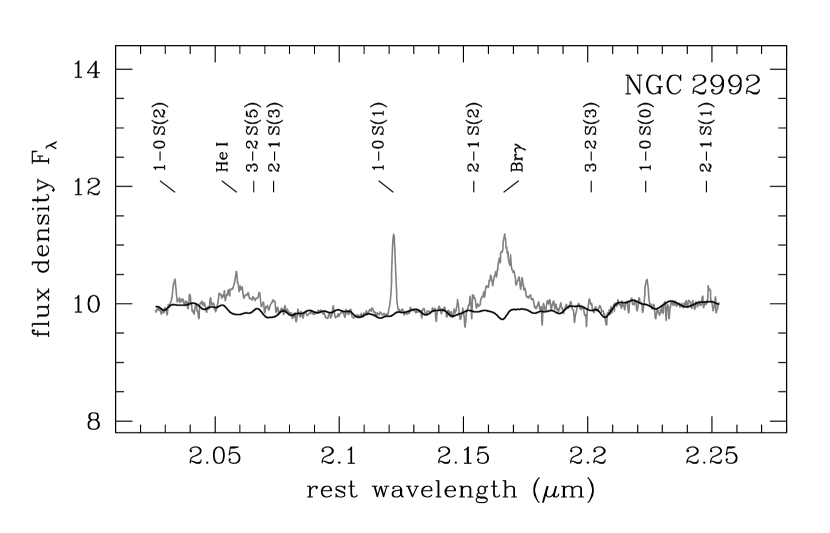
NGC 2992
NGC 2992 exhibits an extended biconical narrow line region on kpc scales (Allen et al., 1999), which traces outflowing gas. Veilleux et al. (2001) were able to model the kinematics in terms of gas rotating in the disk plane and a biconical outflow, and argue that the latter is a thermal wind driven by the AGN rather than vigorous star formation. On smaller scales, there is a figure-8 loop of radio continuum and H emission, centered on the nucleus and extending to about 500 pc (Wehrel & Morris, 1988). Using adaptive optics to reach a resolution ″, Chapman et al. (2000) proposed that the loop structure is in fact a superposition of emission from star formation along a spiral arm in the disk and outflow bubbles coincident with the larger scale structures. In contrast to Chapman et al. (2000), our data show a very significant reduction in the equivalent width of the stellar absorption features (whether 2.293 µm CO 2-0 or 2.206 µm Na i) at the nucleus, which is most easily explained in terms of dilution due to hot dust. The generally accepted classification of NGC 2992 as a Seyfert 2 (or 1.9) is perhaps surprising given that it exhibits broad emission lines in the optical and near infrared. However, given that in the model of Veilleux et al. (2001) the line of sight is very close to the edge of (but not within) the opening angle of the outflow from the AGN, a classification close to type 2 makes sense with respect to the standard orientation dependent model.
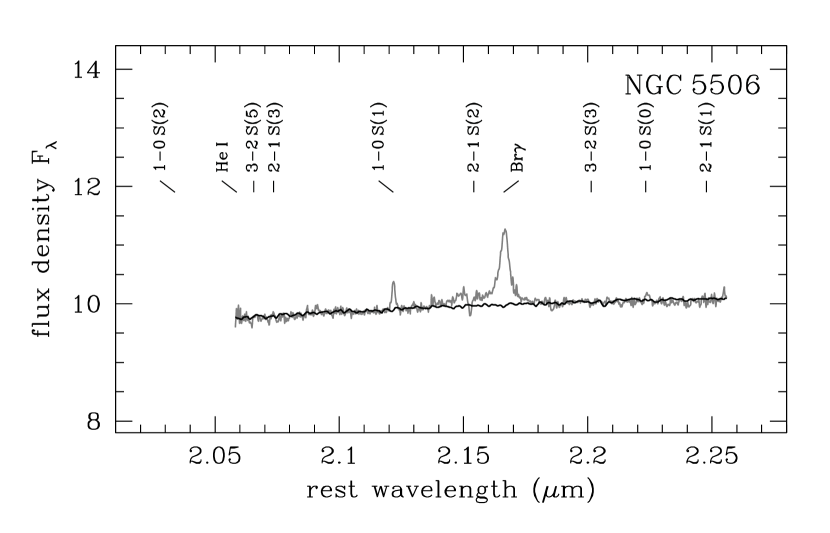
NGC 5506
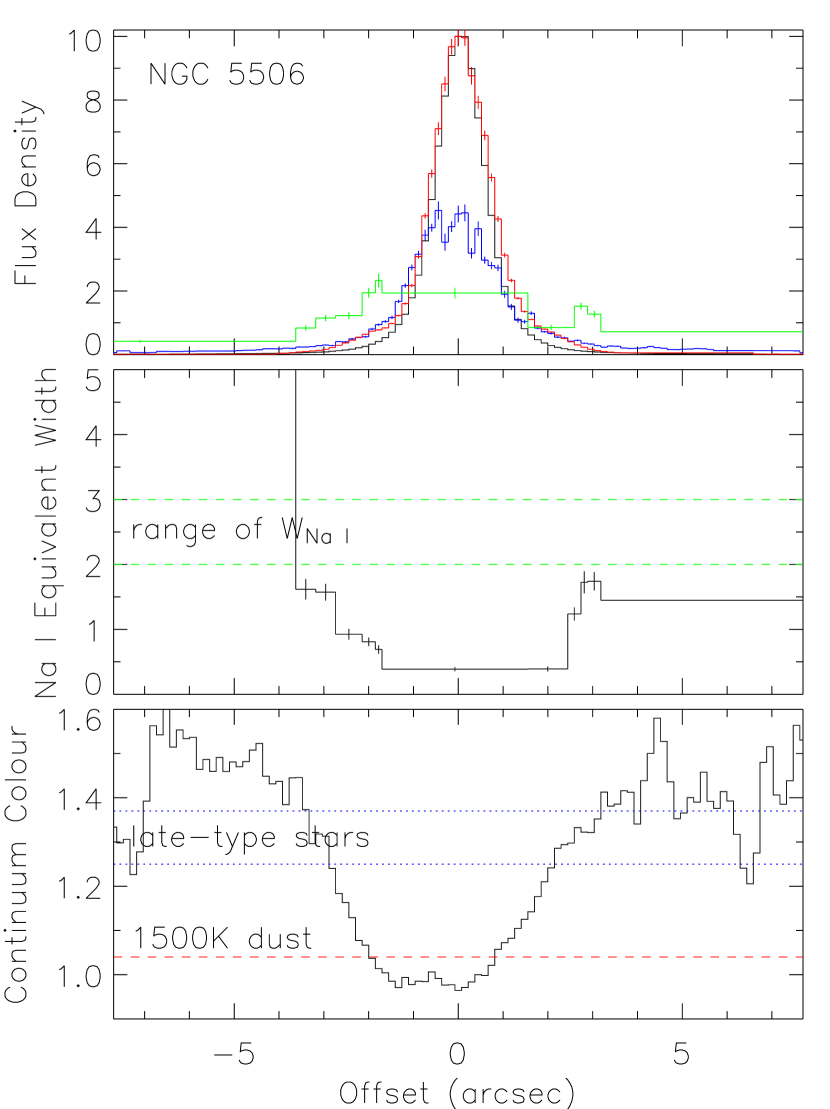
In hard X-rays (2–10 keV), NGC 5506 is one of the most luminous local Seyferts (Matt et al., 2001), making it rather unusual amongst type 2s. However, its X-ray properties are more consistent with those of narrow line Seyfert 1s which, based on its J-band spectrum, NGC 5506 appears to be (Nagar et al., 2002). Our data tend to support this classification. A detailed study of the kinematics of the double peaked lines by Maiolino et al. (1994) suggested that the object is a nearly edge-on Seyfert. Their model, a refined version of that proposed by Wilson et al. (1985), has the disk plane inclined by 75∘, above and below which ionised gas is outflowing in cones extend with opening angle . A highly inclined geometry is consistent with the hard X-ray spectrum, for which the lack of evidence for an accretion disk from the ionised component of the 6.4 keV iron line suggests that it must be nearly edge-on (Matt et al., 2001). Maiolino et al. (1994) also argue that, based on the observed trends in emission line ratios, there is significant star formation occuring at distances of 300–400 pc from the nucleus that can account for about half of the H emission. Our data confirm the evidence for active star formation close to the AGN, showing symmetrical dips in the 1-0 S(1)/Br ratio at offsets of 2–2.5″ (250–300 pc) from the nucleus.
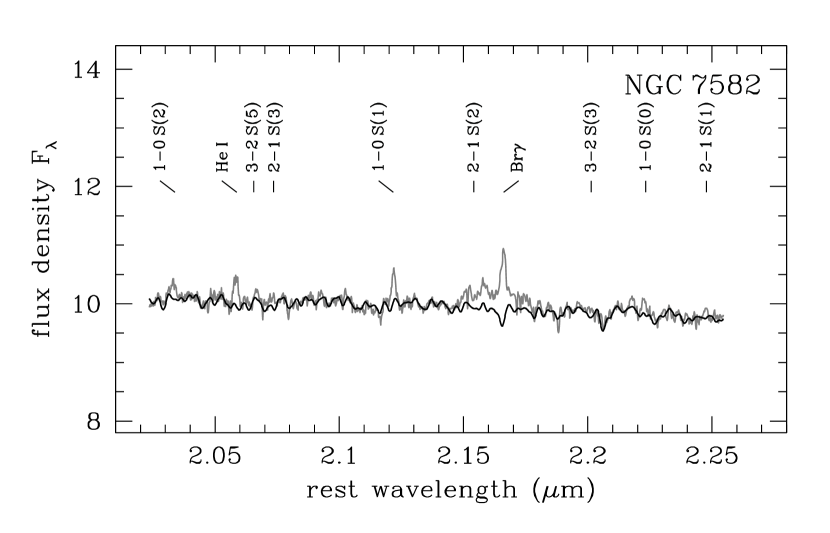
NGC 7582
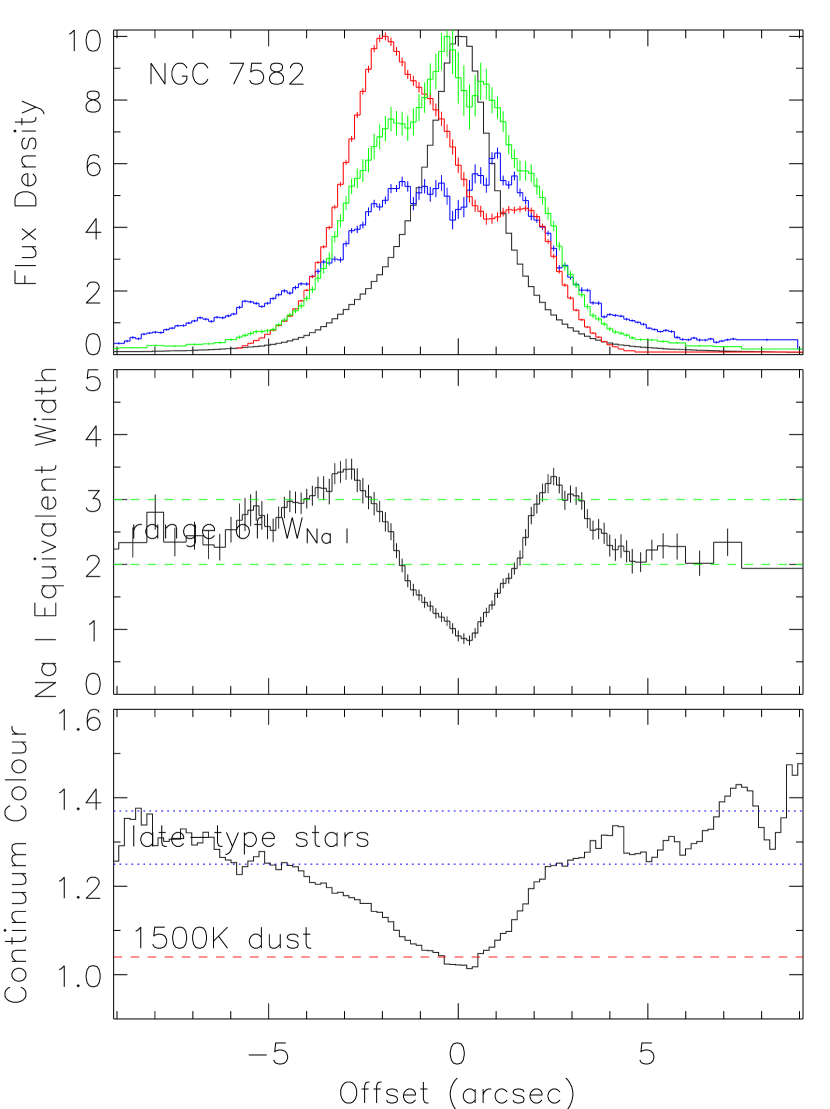
NGC 7582 is the brightest narrow line X-ray galaxy, and perhaps prototypical of this class (Schachter et al., 1998). That it has an AGN cannot be doubted, due to the rapid and large variations in hard (2–10 keV) X-ray flux occuring while the soft (0.5–2 keV) X-ray flux remianed constant (Schachter et al., 1998; Xue et al., 1998), and the presence of an [O iii] ionisation cone (Storchi-Bergmann & Bonatto, 1991). Aretxaga et al. (1999) noted the appearance and subsequent variations in a broad component to several optical emission lines. We also have detected a broad bump in the K-band spectrum, which most likely corresponds to broad ( km s-1) Br. This is also apparent in the nuclear spectrum of Sosa-Brito et al. (2001), who noted the complex morphologies of the emission lines. Aretxaga et al. (1999) reached no consensus on whether this type 2 to type 1 transition was due to the appearance of type IIn supernovae or to patchy obscuration in the torus aorund the AGN. By examining the FUV flux, Storchi-Bergmann et al. (2000) found evidence for young stars in the nucleus (central 2″) of NGC 7582, superimposed on the older bulge population. We also see relatively strong Na i absorption in the spectrum of the central 100 pc. On the other hand, the equivalent width of this absorption feature decreases steadily from a radius of 3″ (300 pc) to a minimum at the nucleus of Å. This feature could imply a transition to a rather young stellar population, or more likely the presence of hot dust grains – although whether the heating on such extended scales can be attributed to the AGN is unclear.
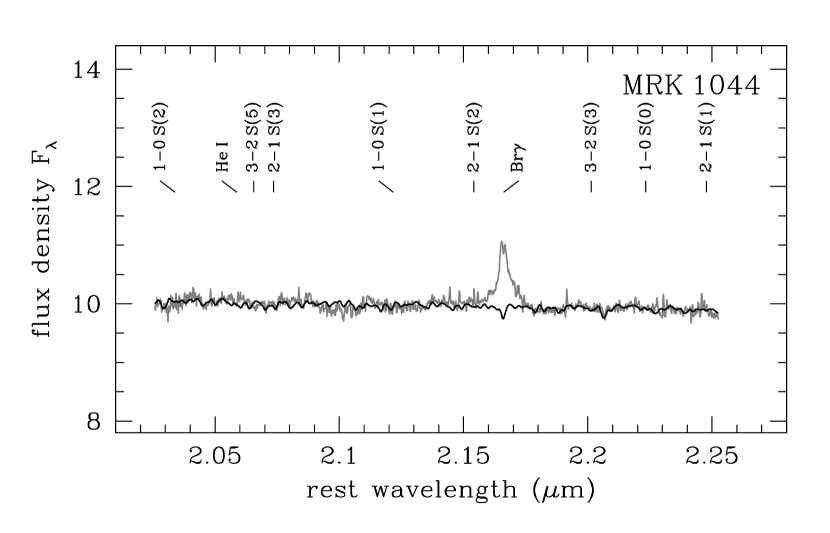
MRK 1044
An HST image of Mrk 1044 shows it to be a spiral galaxy inclined by about from face-on (Crenshaw et al., 2003), and it is included in the list of 59 narrow line Seyfert 1 galaxies complied by Véron-Cetty et al. (2001). As is typical of such objects, it has a steep soft X-ray photon index and shows some variability (Boller et al., 1996). A spectrum covering 0.8–2.4 micron presented by Rodríguez-Ardila et al. (2002) shows no emission lines in the H-band and, as also found by Sosa-Brito et al. (2001) and ourselves, only Br in the K-band. Although their spectrum becomes somewhat less sparsely populated shortward of the H-band, presumably because the dilution of features by hot dust continuum is much less, they still do not detect any coronal lines. In this galaxy we detect neither stellar absorption features, nor H2 line emission (compact or extended). This paucity of emission or absorption features makes it extremely difficult to draw any conclusions about excitation mechanisms or dynamics.
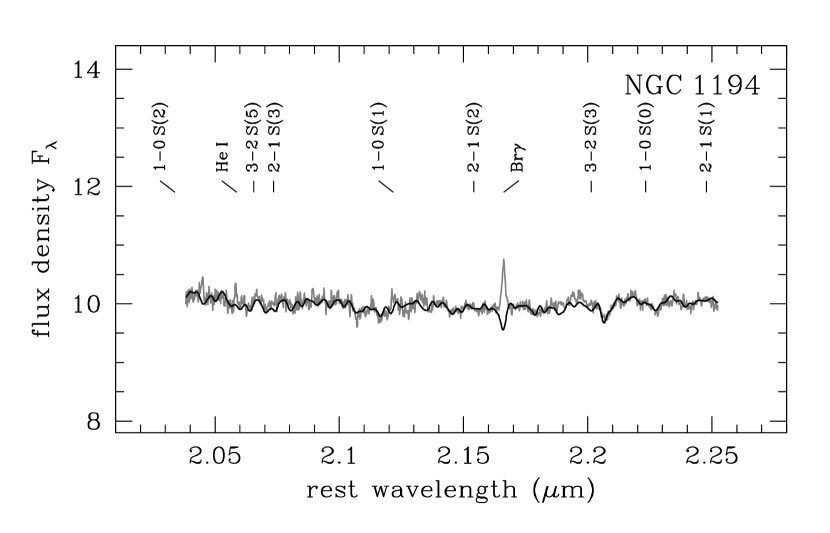
NGC 1194
NGC 1194 is a highly inclined spiral galaxy. It was classified as a Seyfert 1 by de Grijp et al. (1992), who were surveying warm IRAS sources, based on optical line widths and ratios. In a survey of 12 µm galaxies, Imanishi (2003) (who classed it as a type 2, as given in the original sample definition) obtained a 2.8–4.1 µm spectrum of this object, finding no 3.3 µm PAH emission, but evidence for coronal [Si ix] at 3.9 µm. Our detection of only narrow Br would tend to support the Seyfert 2 classification. Sosa-Brito et al. (2001) observed strong CO bandhead absorption longward of 2.3 µm and we too, as for more than half of the nuclear spectra in our sample, find relatively strong stellar absorption features present in the nuclear spectrum suggesting that recent or currently active star formation is an important component of its nuclear energy budget.
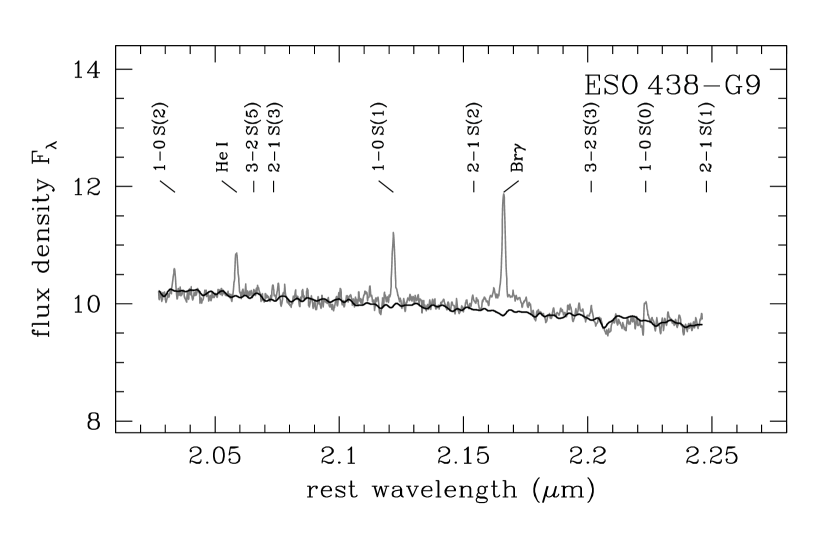
ESO 438-G9
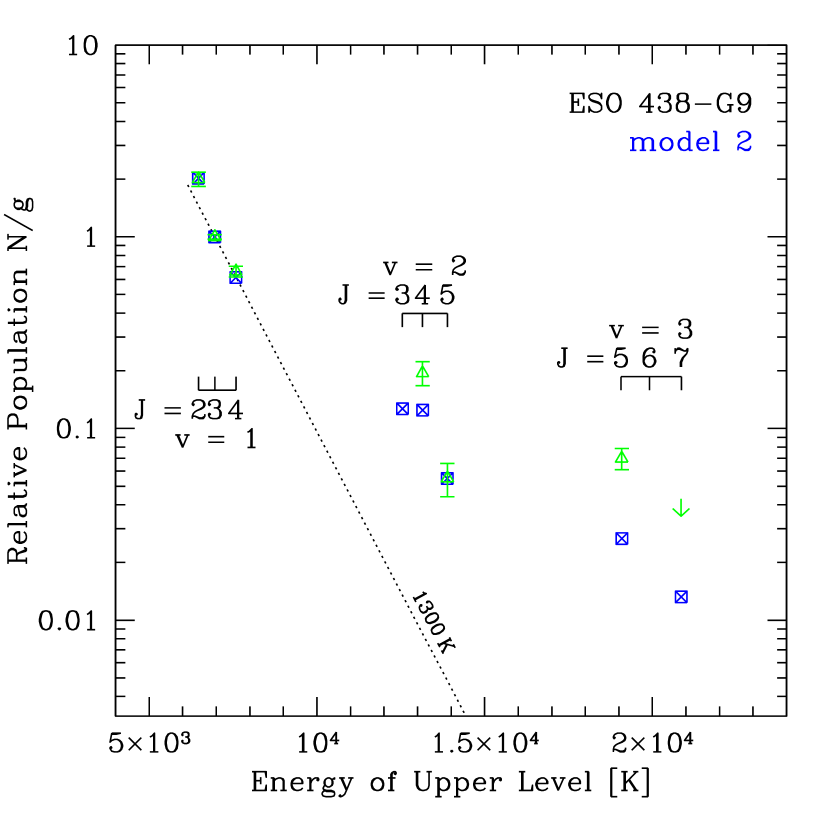
ESO 438-G9 was discovered to be a Seyfert galaxy by Kollatschny & Fricke (1983), who also noted that it has strong optical Fe ii lines, weak or absent higher ionisation lines (probably due to the steep FUV spectrum), and double absorption features blueward of H and H. In their survey of warm infrared galaxies, Kewley et al. (2001) noted that this object had strong broad Balmer lines, and that particularly the [O iii] line had broad wings. The R-band image of Malkan et al. (1998) shows it to be a spiral galaxy with a very bright unresolved nucleus. We observe a broad pedestal to the Br line with a FWHM of 2000 km s-1. There are also clear stellar absorption features in the nuclear spectrum, indicating a significant contribution to the K-band continuum from late type stars within a few hundred parsecs of the AGN.
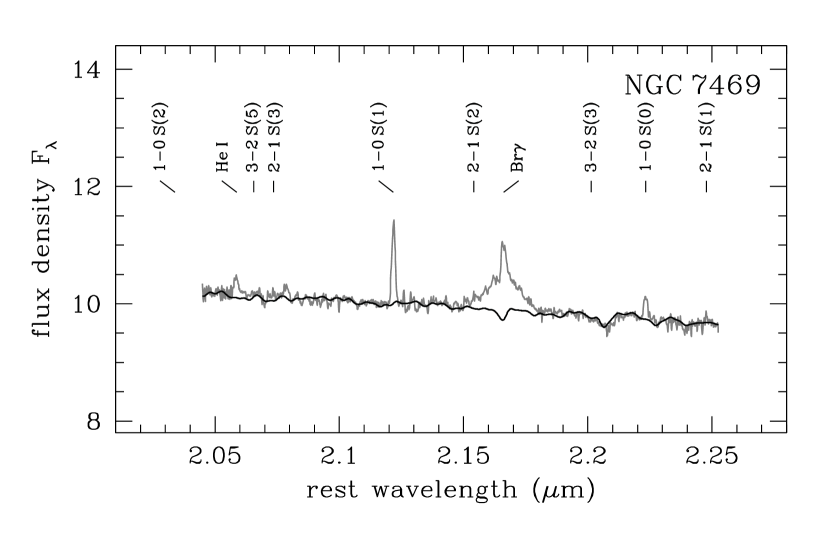
NGC 7469
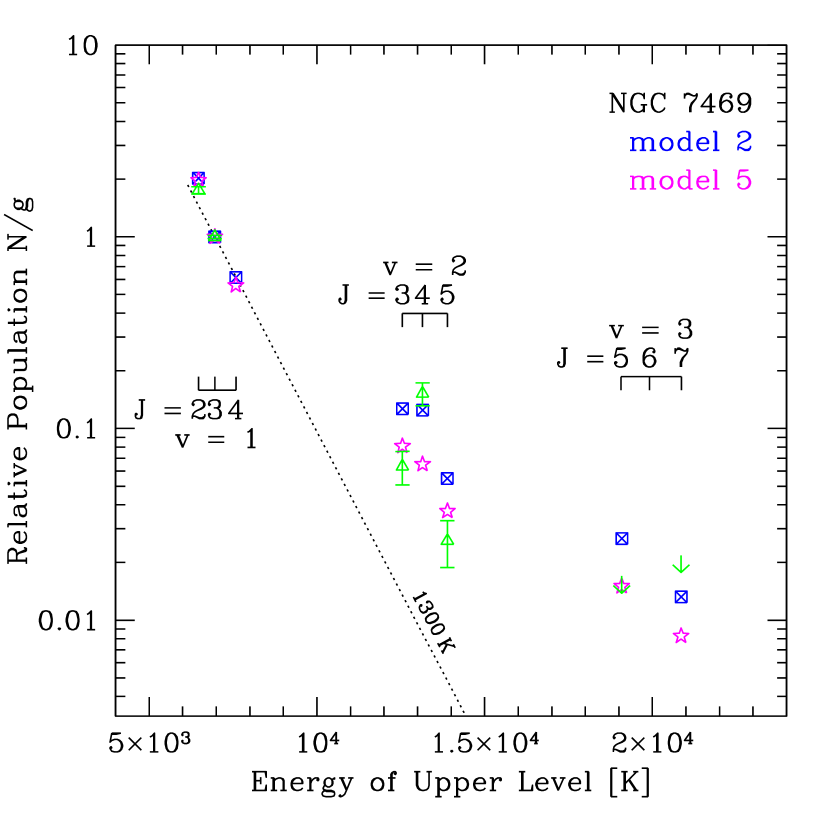
Our spectrum of NGC 7469 is similar to that of Sosa-Brito et al. (2001), showing fairly deep absorption features as well as both narrow and broad Br emission. Although this galaxy is considered to be a proto-typical Seyfert 1, much of the attention it has received is focussed on the circumnuclear ring on scales of –2.5″ which is responsible for about half of the galaxy’s bolometric luminosity. Additionally, about one third of the K-band continuum in the nucleus itself originates in star formation (Mazzarella et al., 1994; Genzel et al., 1995; Davies et al., 2004a). Comparing the luminosity profile of the 1-0 S(1) line with its dynamics at a resolution of 0.1″ (and also the dynamics of the cold molecular gas at 0.7″ resolution), Davies et al. (2004a) concluded that the very central peak in the 1-0 S(1) emission was not associated with the gas or star forming distributions, and was most likely to originate in gas irradiated by X-rays from the AGN. Unfortunately, in a 1″ aperture, the 1-0 S(1) flux from this component is expected to contribute only about 20–25% of the total 1-0 S(1) flux. It may not be possible – on seeing limited scales – to resolve the more extended dominant component, that is presumably excited by star formation, from the nuclear point source.
5 Star Formation around the AGN
In the previous section we have noted several times that deep stellar absorption features are often present even in the central 100 pc around the AGN. In this section we assess the evidence for active star formation in these regions, particularly since this will enable us to place the following discussion of the H2 excitation mechanisms in context. High spatial resolution spectroscopy has already provided direct evidence for intense star formation on scales as small as a few tens of parsecs, and even a few parsecs, around several type 1 AGN, namely NGC 7469 (Davies et al., 2004a), Mkn 231 (Davies et al., 2004b), NGC 3227 (Davies et al., 2005). Other authors (e.g. Cid Fernandes et al., 2004; Storchi-Bergmann et al., 2001; González Delgado et al., 2001) have demonstrated through empirical population synthesis that in about 40% of type 2 Seyferts there is recent (i.e. 1 Gyr) star formation within a few hundred parsecs of the nucleus. It is therefore expedient that we consider whether there could be active and intense star formation in the central apertures of the AGN presented here.
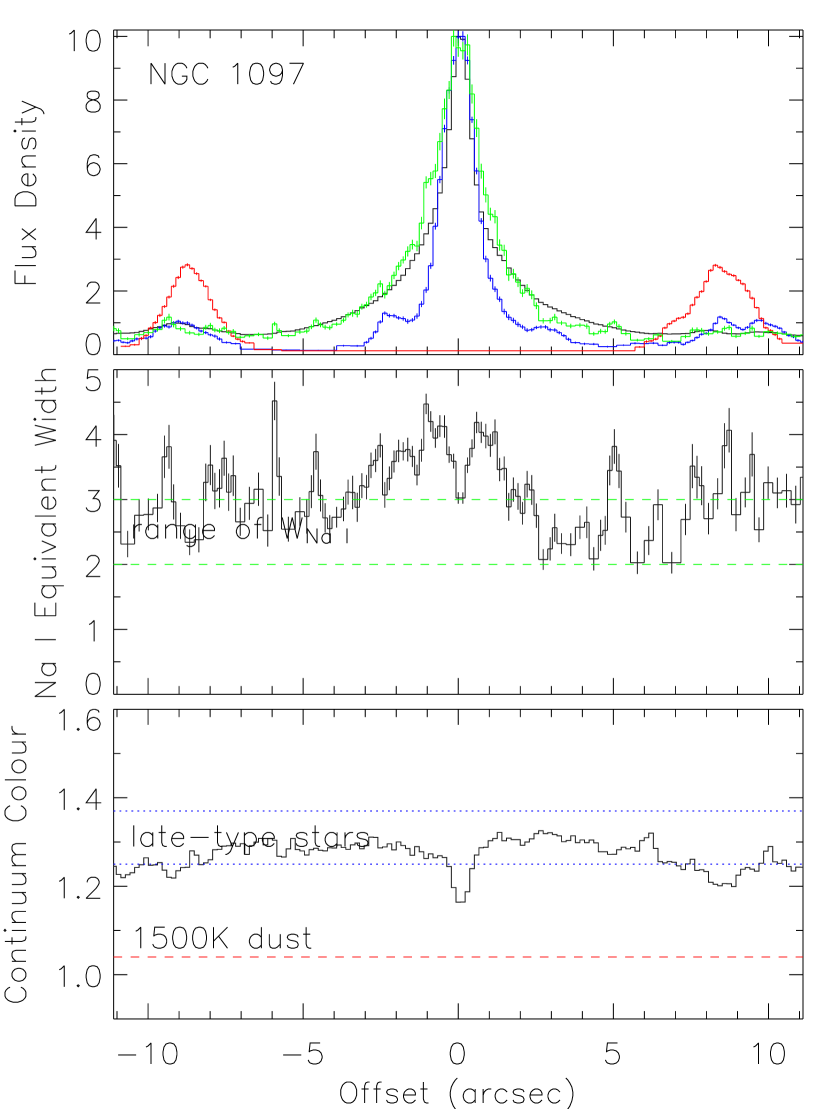
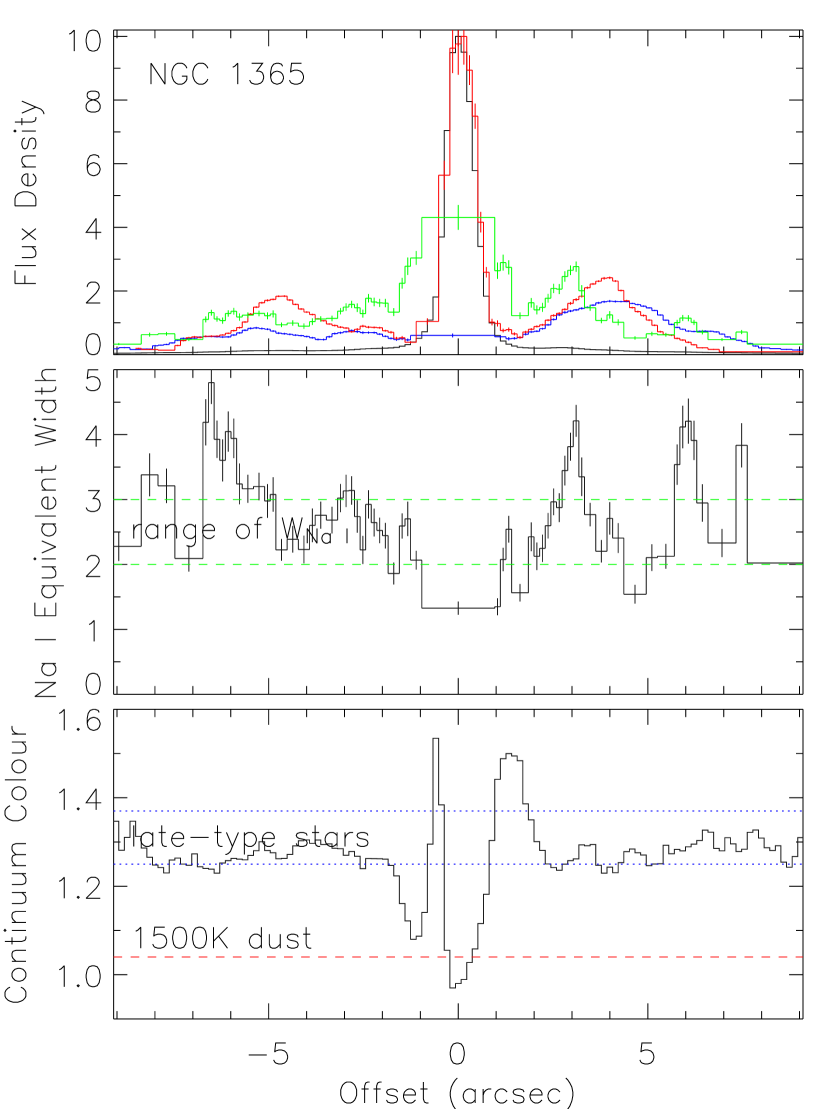
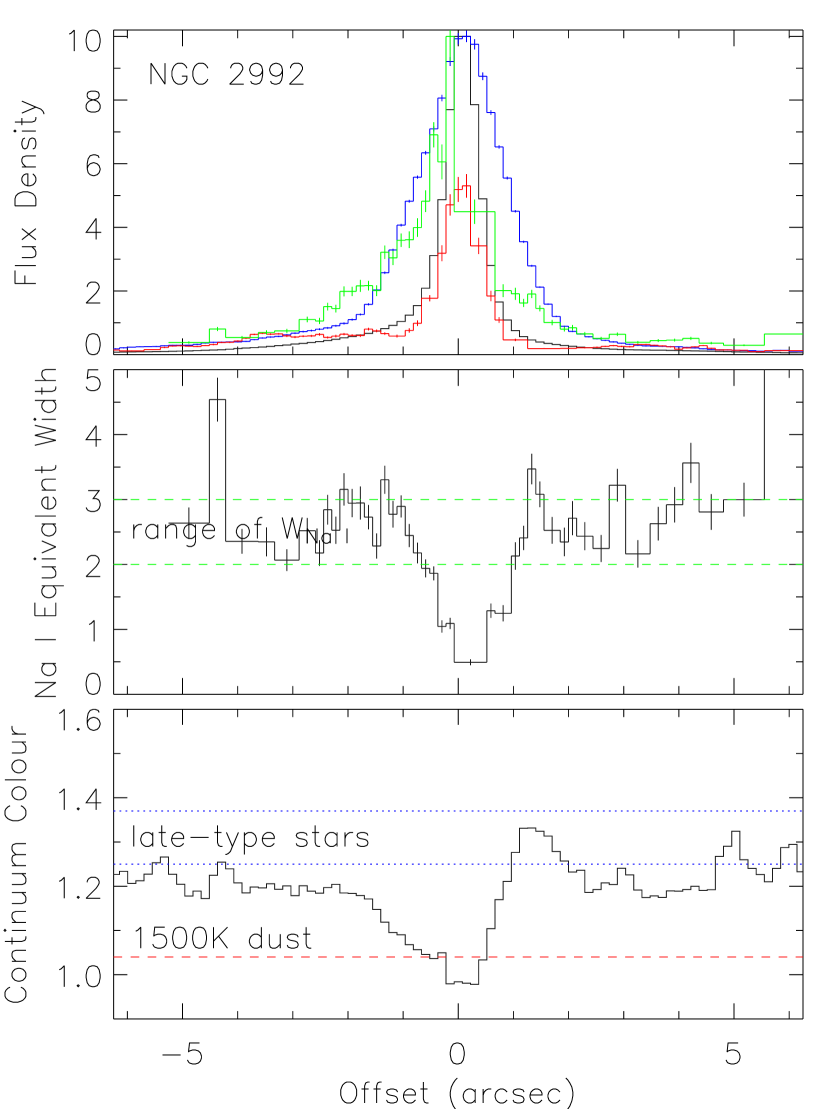
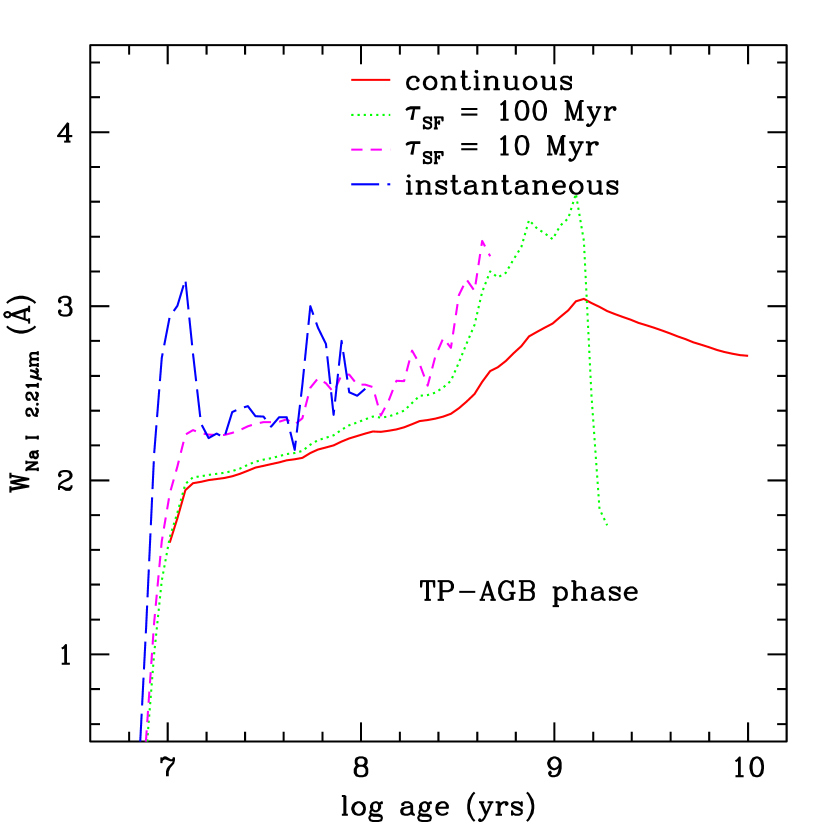
Fig. 6 shows, for each of the five nearer galaxies, the spatial distributions of various quantities along the slit to a projected distance of 1 kpc from the centre. The top panels trace the relative surface brightnesses of the total K-band continuum together with the stellar continuum, 1-0 S(1) and Br line emission, the latter two with the same normalisation. We have attempted to measure only the narrow Br. However, in several cases this is difficult to separate from the broad emission (see Fig. 4) and hence over the central arcsec should be taken as a guide only. The centre panels show the equivalent width of the 2.206 µm Na i stellar absorption line, . To assist in interpreting this, we show also the typical range of values (2–3 Å) that one would expect it to take. This is based on results of the STARS star formation models (Sternberg, 1998; Thornley et al., 2000; Davies et al., 2003) shown in Fig. 7. This code calculates the distribution of stars in the Hertzsprung-Russell diagram as a function of age for an exponentially decaying star formation rate. Using empirically determined from library spectra (Förster Schreiber, 2000), the code then computes the time-dependent for the entire cluster of stars. The code includes the thermally pulsing asymptotic giant branch (TP-AGB) stars which have a very significant impact on the depth of the absorption features at ages of 0.4-2 Gyr (Förster Schreiber et al., 2003; Maraston, 2004). The stellar continuum in the top panel is derived assuming it exhibits a constant equivalent width, which this figure shows to be a reasonable zero-order approximation. Finally, the bottom panels in Fig. 6 show how the colour of the continuum, defined here as the ratio of the flux densities at 2.19 µm and 2.25 µm, varies along the slit. Again, several reference values are superimposed: the range of colours typical of late type stars, and the colour of a blackbody continuum at 1500 K representative of hot dust associated with an AGN. Extinction is unlikely to change these colours significantly since the relevant quantity is the differential extinction between 2.19 and 2.25 µm. This only starts to become important for screen extinction models with .
In general, away from the nucleus itself, is consistent with what one expects from the star formation models, indicating that there is little or no dilution. The nuclear Br emission at these radii (e.g. NGC 1097, NGC 1365) is indicative of young stars, and the spatial coincidence of 1-0 S(1) emission would suggest that it is a related phenomenon: either from photo-dissociation regions or associated with supernovae. In this sense, the occasional peaks with Å could be due to the stars in individual clusters passing through the late-type supergiant phase at 10 Myr.
However, the regions close around the nucleus tell a rather different story. The stellar continuum appears to increase steeply; but in every case exhibits a dramatic decrease, which is also associated with a reddening of the continuum colour. The simplest explanation is that the stellar continuum is strongly diluted by continuum emission from hot dust. If these features were unresolved, as in NGC 1097, one would immediately assign them to dust heated to 500–1500 K by the AGN. But more typically, they occur over an extent of 200 pc or more and are therefore unlikely to be directly associated with an AGN which is expected to heat grains to such high temperatures over rather limited distances – for example the inner edge of a canonical torus on parsec scales or very small grains transiently heated by a jet, as may be occuring in the central few tens of parsecs in NGC 1068 (Rouan et al., 2004). AGN often exhibit ionisation cones which can extend over distances of hundreds of parsecs, and both NGC 1365 and NGC 7582 possess one (Storchi-Bergmann & Bonatto, 1991). Our slits for these two objects are oriented through the ionisation cones. But over the 5″ regions corresponding to the extent of the cones, the respective data sets show totally different properties from each other – suggesting that the observations are not tracing processes associated with the ionisation cones themselves. In addition, the ionisation cone in NGC 4945 (Moorwood et al., 1996), shows that one would not expect them to produce significant K-band continuum: these authors only see the cone in continuum (J-band rather than K-band) because it reduces the extinction to the starlight behind. Based on this, one would expect the cone neither to dilute the stellar features nor to redden the continuum. We conclude that the AGN and its associated phenomena such as ionisation cones are unlikely to produce the combination of properties we observe here.
On the other hand, the reduction in and reddening of the continuum colour are spatially coincident with the brighter stellar continuum, and so – as for the circumnuclear regions further out – could be associated with active star formation. The approximate coincidence of Br emission provides additional circumstantial evidence for a population of very young stars, or at least on-going star formation. The dilution of the stellar features and reddening of the continuum colour are still most likely attributable to hot dust, although at present one can only make conjectures about the heating source. It has been suggested that a population of very small grains could be heated to temperatures of 500–1000 K by young stars (e.g. Sellgren, 1984; Davies et al., 2002). However, there is little evidence for such a process seen in galactic Hii regions. On the other hand, the environment of the region around the AGN – in terms of density, pressure, turbulence, energetics, etc. – may be sufficiently different from that of galactic Hii regions that it is able to produce a population of sufficiently small grains, as well as drive them near enough to the young stellar clusters so that they can be heated. One could also envisage other processes which may be at work, such as Compton heating by energetic photons from the AGN. However, addressing the issue of the dust heating mechanism is beyond both the data presented here and the scope of this work.
The pertinent issue is that for these extended (200 pc) nuclear regions, one must consider all the observed characteristics together: the line emission, reduction in , reddening of the continuum, and also the brightness of the stellar continuum. A natural, and arguably the simplest, explanation to account for all these simultaneously is the presence of active star formation, from which the combination of direct emission (e.g. bright stellar continuum) and indirect emission (e.g. recombination lines and plausibly hot dust re-radiation) can account for what has been observed.
6 H2 Excitation Diagrams and PDR Models
For the H2 line fluxes listed in Table 2 and 3, we have calculated the implied molecular column densities, , in the upper rotational-vibrational () levels of the observed transitions, where is the observed flux, is the radiative rate, and is our aperture size. We assume that the quadrupole transitions are optically thin and we use the radiative values as given by Wolniewicz et al. (1998). After normalising the population distributions to the level (i.e. the 1-0 S(1) line), we have plotted them as (where is the statistical weight) against energy (in K) of each observed level. In such excitation diagrams, the log points for isothermal populations should lie on a straight line.
In order to interpret these diagrams, we consider purely thermal emission as well as a representative set of 5 PDR models which are described by Davies et al. (2003). These models consist of static, plane-parallel, semi-infinite clouds that are exposed to isotropic FUV radiation fields (Sternberg & Dalgarno, 1989; Sternberg & Neufeld, 1999). At each cloud depth we compute the equilibrium atomic to molecular hydrogen density ratio, , and we solve for the steady-state population densities in the rotational and vibrational H2 levels in the ground electronic state. In solving for the populations we include the effects of FUV-pumping via the Lyman and Werner bands, collisional processes with H+, H, and H2, and quadrupole radiative decays.
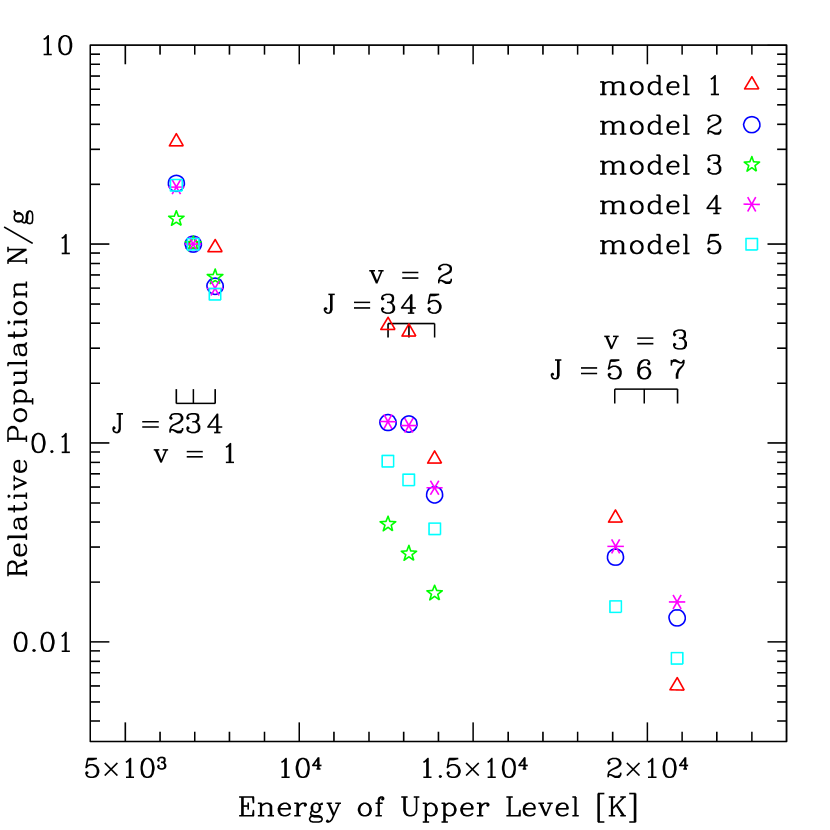
The 5 models cover a range of illuminating FUV field intensities , relative to the FUV field in the local interstellar medium ( photons s-1 m-2 over 912–1130 Å, Draine, 1978), and total hydrogen particle densities in the clouds. In all of the models except model 1 (for which we keep the temperature constant at K), we assume that the gas temperature varies with cloud depth and set the temperature at the cloud edge. The gas temperature is a maximum in the outer atomic zone and declines significantly to K as the gas becomes molecular, a behaviour that is consistent with both theoretical expectations for, and empirical measurements of, dense PDRs. The details of the models and a description of their salient features is given by Davies et al. (2003) and are not repeated here. Instead, we summarise the parameters (, , ) in Table 4. The excitation diagrams for the models are plotted in Fig. 8, which shows the extent of their coverage of the relative population parameter space.
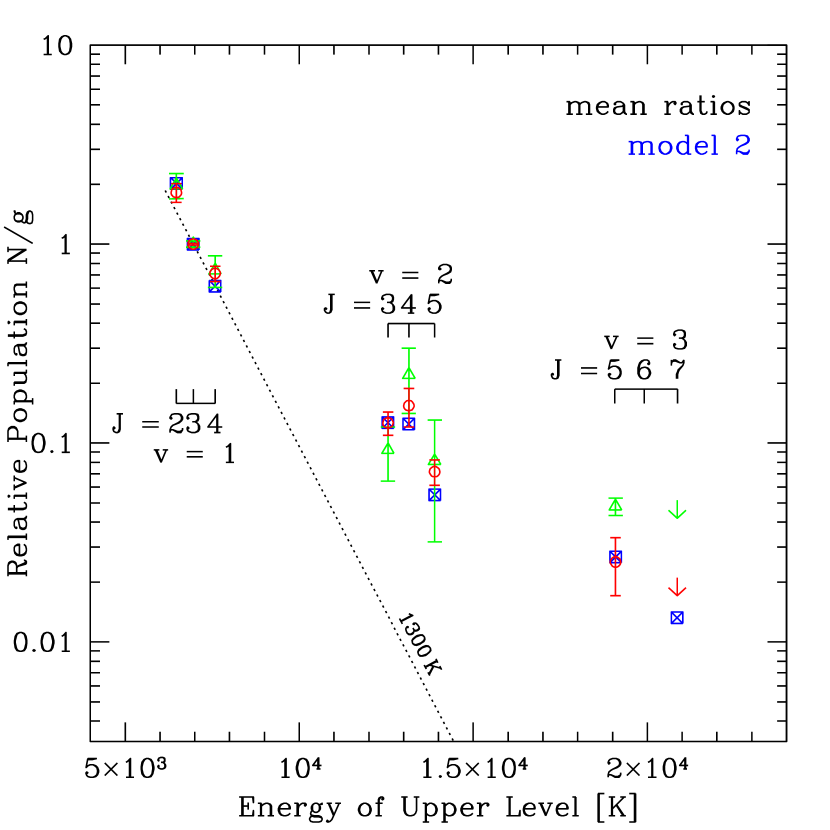
What is immediately clear from the mean values for the nuclear and circumnuclear spectra, shown in Fig. 9 (where the error bars denote the standard devation of the values among the objects), as well as from the individual values is that the levels are well thermalised. In every case these levels can be reproduced by an isothermal cloud at 1300 K. However it is not possible to say from just the levels whether the H2 molecules have been excited by a thermal process such as a shock front, or whether it is due to high gas density regardless of the mechanism which provides the energy. The higher levels suggest the latter since in every case they lie above the prediction for 1300 K. To compensate for this, one would need either multiple thermal components, or a fluorescent component. The former is not a satisfactory solution because the temperature needed – about 3000 K between the and levels, and of order 5000 K between the and levels – would mean that the molecules are rapidly dissociated.
The possibility that instead a fluorescent excitation mechanism is responsible for the and populations is given by the blue symbols in the figures, which represent our PDR model 2. In this model, the levels are collisionally thermalised as a result of the high cm-3 gas density. In addition, the model exhibits a shift in the ortho-para ratio for the levels: the para level is above the adjacent and ortho levels. Suppression of the ortho-para ratio below the value of 3 obtained in local thermal equilibrium in warm gas is a typical signature of excitation by FUV pumping. It occurs because the ortho UV absorption lines have a higher optical depth, and hence the vibrationally pumped ortho-H2 is suppressed with respect to para-H2 (Sternberg & Neufeld, 1999). It is exactly this effect that can be seen in the H2 population diagrams of the AGN for which all 3 relevant lines have been detected, both in the nuclear and circumnuclear regions.
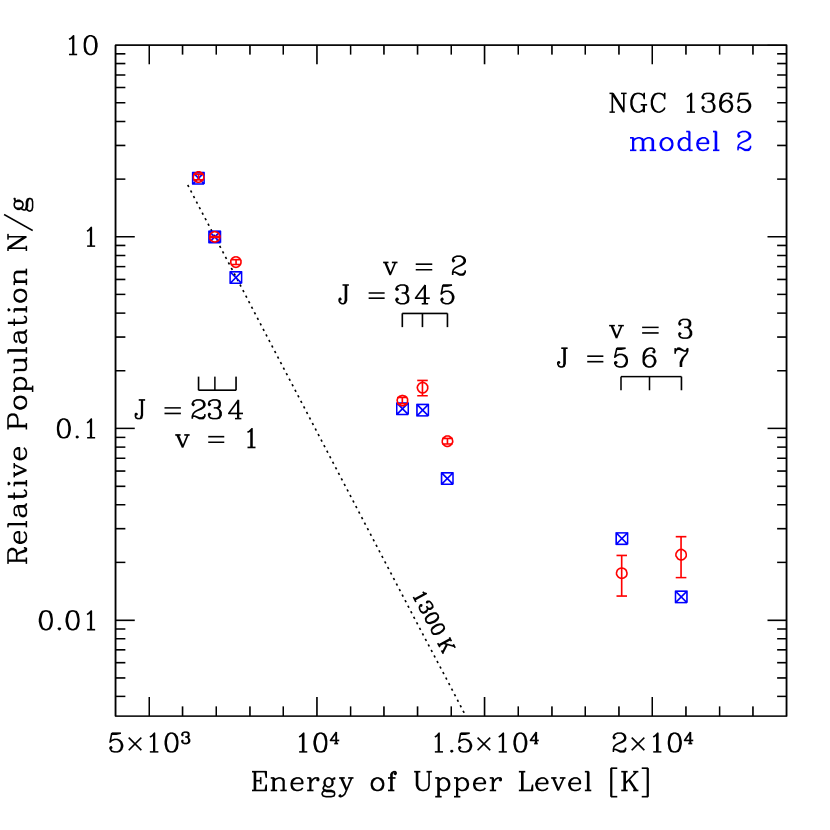
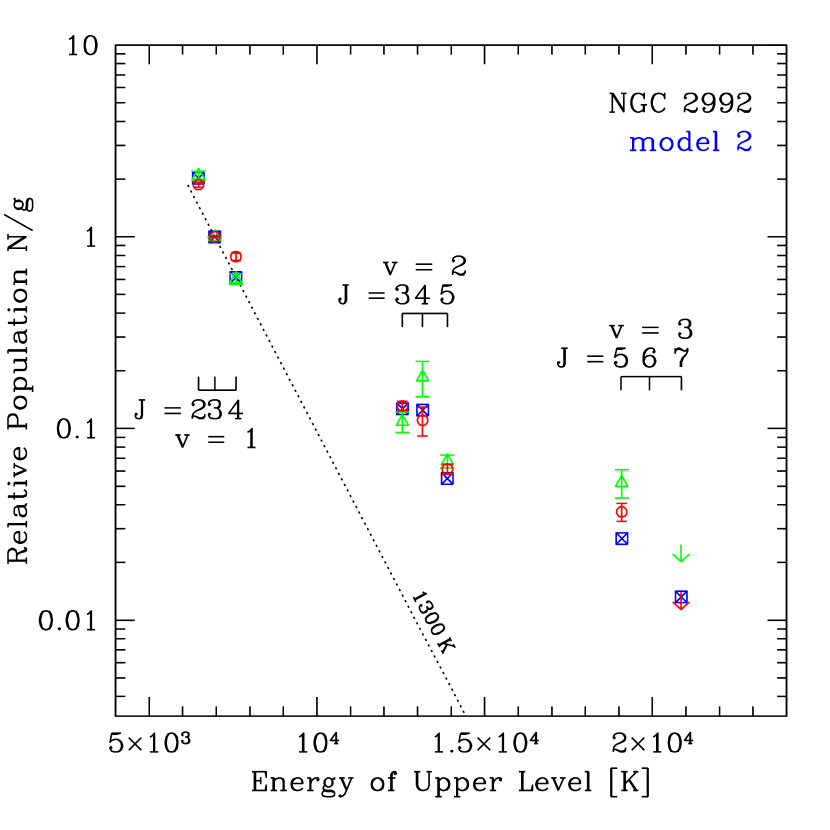
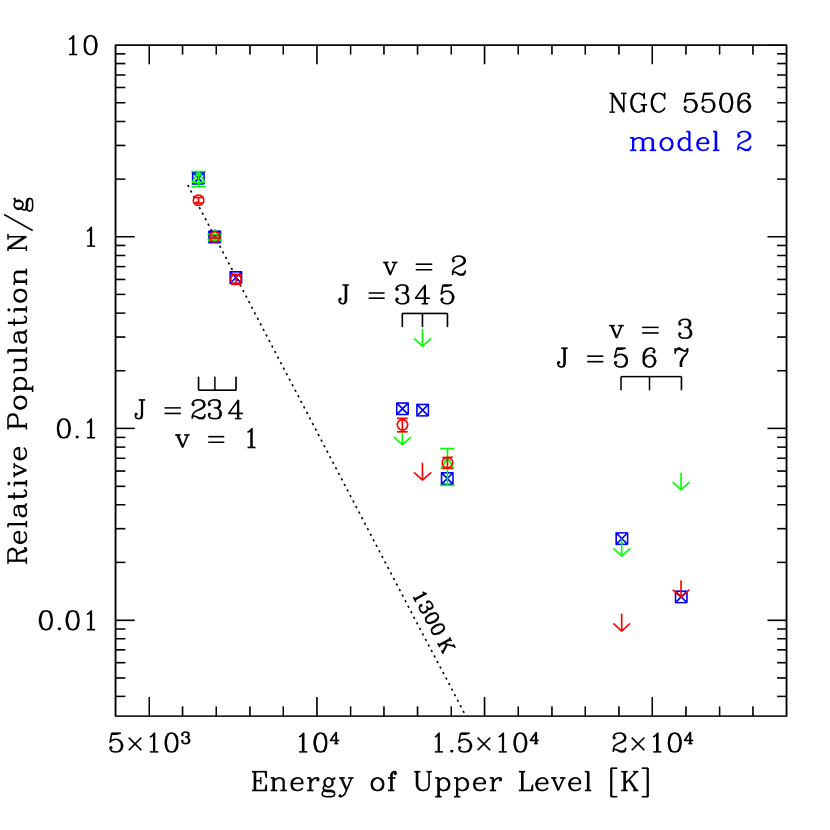
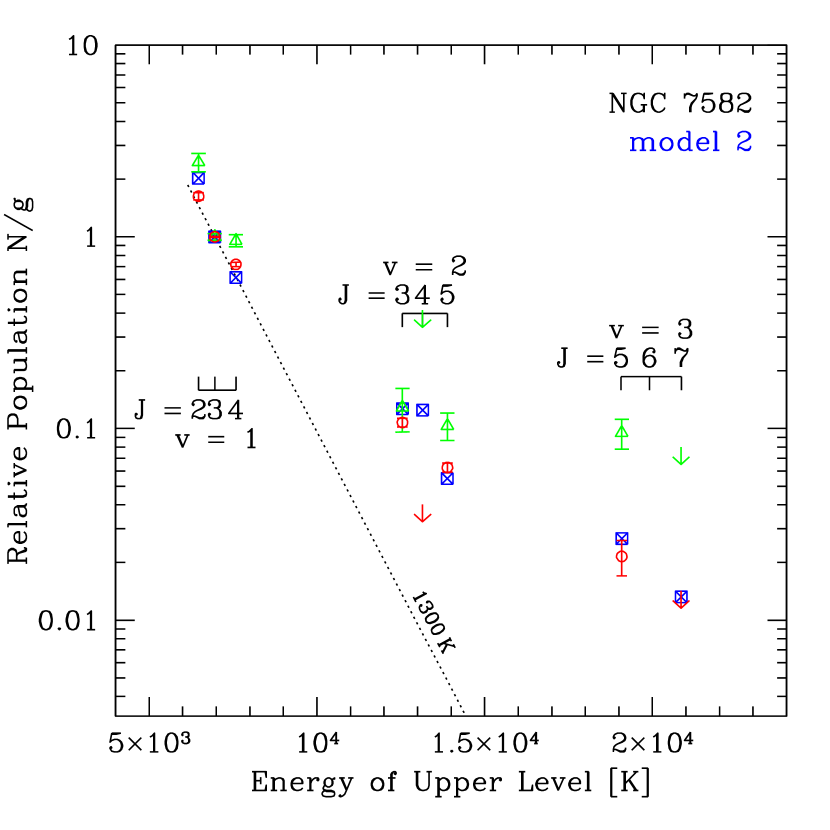
Of the 5 PDR models we consider – covering the parameter space FUV intensity - times that in the local interstellar medium, gas density - cm-3, and temperature - K – it is model 2 and 4 (differing only in FUV intensity, and indistinguishable in terms of their resulting line ratios) which best match the data. This indicates that the maximum temperature is K (as one would expect from the levels discussed above), the gas density is of order cm-3, and the incident FUV intensity is at least times the local ambient value. Model 2 provides a reasonable match to all the data in the mean diagram (Fig. 9), and is the model we use as a reference when considering the individual objects, the excitation diagrams for which are shown in Figs. 10 and 11.
6.1 Circumnuclear line ratios
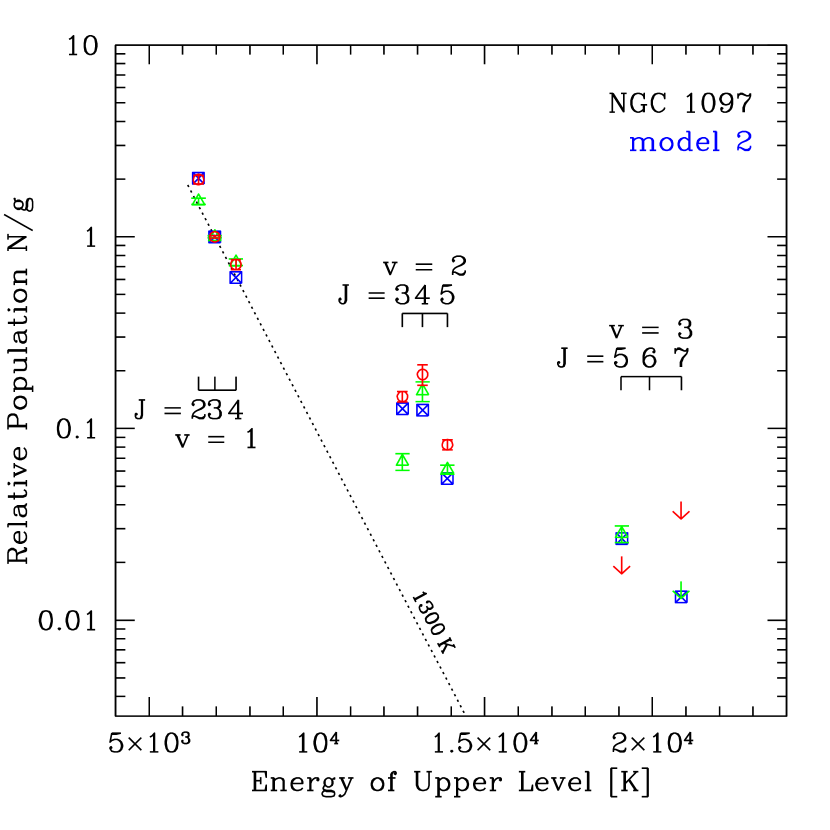
In all of the five galaxies belonging to the nearby sample, the circumnuclear line ratios can be reproduced by model 2 – and in the case of NGC 2992 the match is remarkably good. There are a few isolated cases where line limits appear to be inconsistent with the model, but in at least some cases these limits appear to be unphysical: for example, in none of our models is the less than the and levels. In this case the 2-1 (2) line is significantly weaker than 2-1 S(1) and 2-1 S(3) due to its smaller statistical weight and occurs in the overlap region of the two spectral segments where small uncertainties in scaling the two segments can have a disproportionate effect that is not reflected in the estimation of the line flux uncertainty. Similarly, the level is derived from the 3-2 S(3) line which sits close to the edge of the 2.206 µm Na absorption which can often be quite deep. A description of how the uncertainties were estimated is given in Section 3, but any such estimate cannot take into account systematic errors such as incorrect removal of the continuum features due to mismatch of the stellar templates. Bearing this in mind, one should be cautious of the uncertainties when a weak line or non-detection occurs close to a region of strong stellar absorption, and not over-interpret them when assessing the correspondance between model and data.
The conclusion that in all five cases the H2 lines appear to be excited in dense PDRs exposed to high FUV fields is consistent with what one might expect of regions efficiently forming massive young stars at a high rate.
6.2 Nuclear line ratios
The data for the nuclear line fluxes is much less complete, primarily due to the greatly increased noise in the spectrum from the bright hot dust continuum associated with the AGN. Nevertheless, in three of the four nearby galaxies where H2 lines are detected – namely NGC 1097, NGC 2992, and NGC 5506 – their ratios show a strong similarity to those of the circumnuclear regions, with the single exception of the level in NGC 1097 which is a factor of 2 less than one would expect. The fourth galaxy, NGC 7582, is similar for all the levels up to and including , but the level is significantly higher than one would expect: none of our PDR models can reproduce this. Examination of the region around the 3-2 S(3) line at 2.2 µm in Fig. 5 suggests that in NGC 7582 it also seems likely that template mismatch and hence incomplete correction of the absorption features in the stellar continuum has led to poor estimation of the weak line flux.
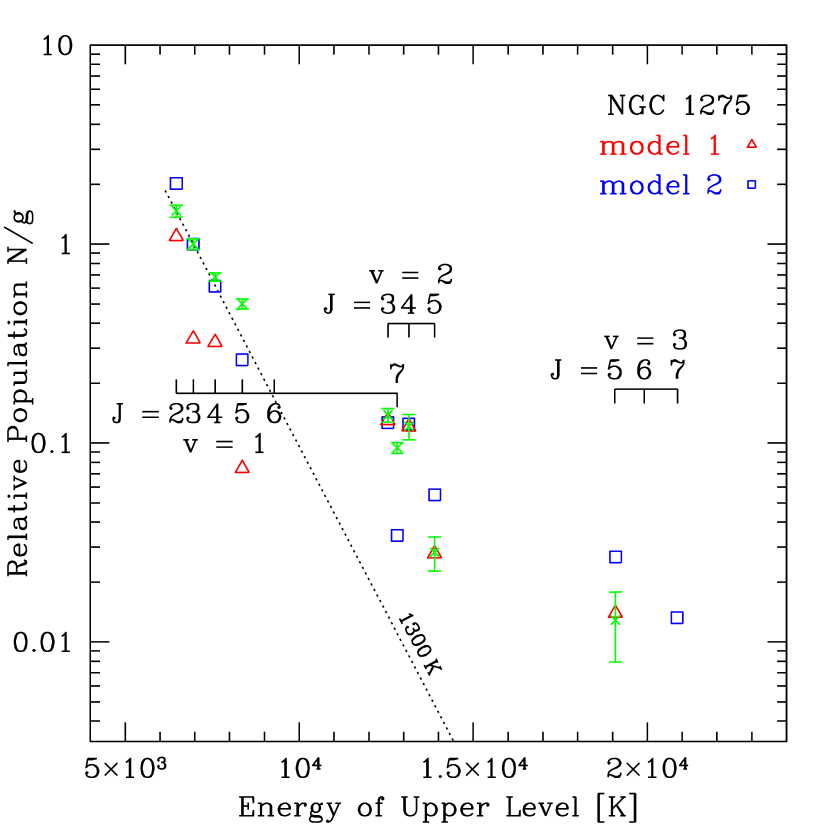
In none of these galaxies do we find evidence for suppression of the 2-1 S(3) line, which might be expected for AGN if the gas irradiated by X-rays. This is a theoretical possibility if there is an excess of Ly photons, due to an accidental resonance between the 1-2 P(5) and 1-2 R(6) transitions and the Ly line (Black & van Dishoeck, 1987). An excess of Ly photons will depopulate the lower (i.e. and ) levels, resulting in a reduction in the two 2-1 S(3) and 2-1 S(4) line strengths. Such a situation could arise in X-ray irradiated gas, in which the primary photoelectrons have high enough energies to generate many more secondary ionisations ( per keV of primary photoelectron energy; Maloney et al. 1996) through collisional excitation. It has been proposed by Draine & Woods (1990) as the explanation for a previously reported weakness of that line in NGC 6240. However, using higher resolution and signal-to-noise spectra, Sugai et al. (1997) showed that this line is in fact not suppressed, and that the –0 and 2–1 transitions can be well matched by models of isothermal emission. A second case is NGC 1275, which has very luminous H2 emission () mostly concentrated in a compact (0.5″) nuclear source (Krabbe et al., 2000; Wilman et al., 2005). Interpreting the line ratios in terms of thermal excitation with two or more excitation temperatures, Krabbe et al. (2000) argued that the flux of the 2-1 S(3) line was a factor of at least 2.5 less than expected and attributed this to the fact that the excitation of the gas is dominated by X-ray heating from the AGN. We plot the data for the central 3″ of NGC 1275 (from their Table 2) in Fig. 12. It is clear that these data tend towards the same trend we have seen in our Seyfert nuclei: the transitions appear thermalised while the higher vibrational transitions indicate an additional higher temperature thermal or fluorescent (PDR) component. The levels from our PDR model 2 (overplotted as squares) go some way to explaining the observed ratios and the apparent weakness of the (2,5) level. A PDR model with low density fluorescence (our model 1; overplotted as triangles), matches the and levels extremely well if it is scaled to produce 1/3 of the total 1-0 S(1) flux. It does not reproduce the levels at all; but it is not unreasonable to suppose that in such a large aperture (3″ is equivalent to 1 kpc) there may be multiple excitation processes at work and that the levels could arise from a region where thermal processes dominate and the higher levels from a region where non-thermal processes dominate.
In the nuclear specta of our AGN, the line ratios are, as for the circumnuclear regions, consistent with excitation by intense star formation in relatively dense PDRs. This appears to be the case even for NGC 5506 which has a very luminous Seyfert nucleus. On the other hand, determining whether the data are consistent with X-ray excitation is not straightforward. From their models of X-ray irradiated gas, both Maloney et al. (1996) and Tiné et al. (1997) conclude that the 2-1 S(1) to 1-0 S(1) ratio should nearly always be ; most of the diagnostic power of these models appear to lie in transitions from or far infrared lines from other species. Instead we consider the 2–10 keV hard X-ray fluxes, which are listed in Table 2. These indicate that, as also found by Quillen et al. (1999), there is absolutely no correlation between X-ray and H2 emission. This could be either because the two are not causally related, implying a different excitation mechanism for the H2; or due to the different timescales for variability. The hard X-ray luminosities are known to vary on fast timescales – e.g. by a factor of 2 over a period of a few hours for NGC 1365 (Risaliti et al., 2000) and NGC 7469 (Barr, 1986) – while the H2 emission would only vary on the far longer timescales associated with its physical extent ( pc implies 300 yrs).
For NGC 1097 nuclear H2 excitation by star formation rather than an AGN can be understood because the AGN is in general rather low luminosity (see Section 4). And in NGC 1097, NGC 2992, and NGC 7582 Fig. 5 indicates that the Na I stellar absorption is clearly visible despite (in the latter 2 cases) strong dilution by the AGN. As discussed in Section 5, this suggests that in these cases there may be significant active star formation in the nucleus and as a result any H2 emission from X-ray excited gas could be hidden by emission from PDRs excited by the young stars.
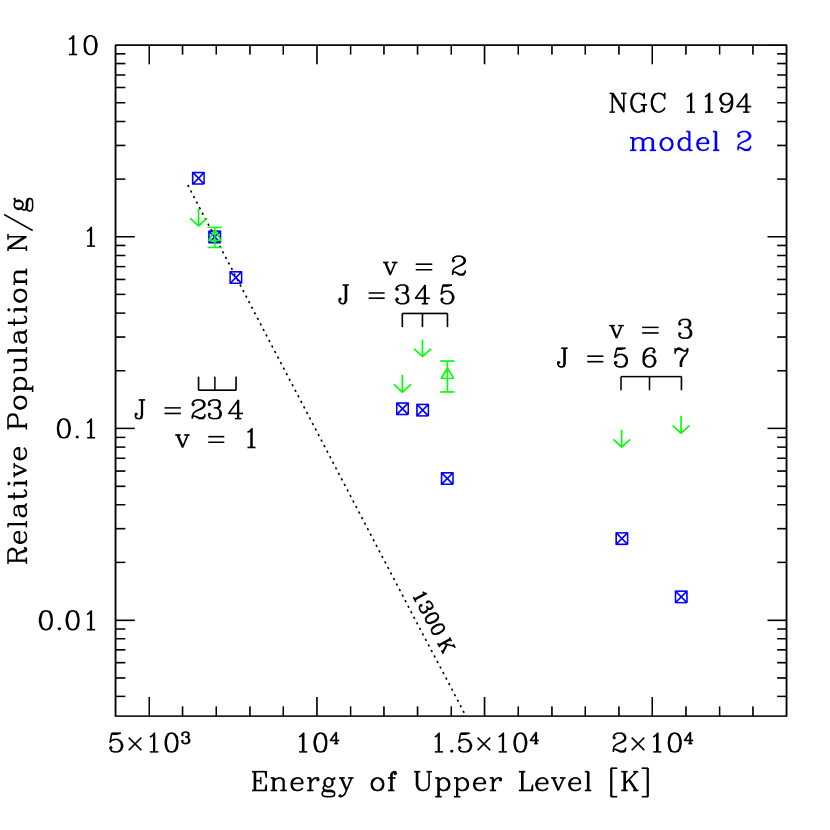
Of the four more distant galaxies, H2 emission was detected in three – namely NGC 1194, NGC 7469, and ESO 438-G9 – but the data is sparser still than the nearby ones. Beyond the statement that the levels are thermalised but the higher levels indicate fluorescent excitation, there is little that we can conclude. This in itself suggests that the levels are thermalised due to high gas density rather than purely thermal excitation in shocks, consistent with the results for the nearby galaxies. That the excitation could be due to active star formation is evidenced by the Na I absorption which can be seen in these three nuclei despite the AGN dilution. However, we can make no statement on whether the gas is also (or instead) being irradiated by X-rays from the AGN. In NGC 7469 the low populations in the and levels hint that perhaps even the levels are partially thermalised – i.e. that the gas density may be as high as cm-3 as in model 5, which better reproduces these lower populations. Given the extremely large cold molecular gas mass in the nuclear region of this galaxy, inferred from CO 2-1 observations (Davies et al., 2004a), very high gas densities in the clouds themselves are to be expected.
7 Conclusions
We have presented K-band spectra of the central regions of nine AGN, for five of which we also present circumnuclear spectra. In these spectra, we have measured H2 emission line fluxes from the , 2, and 3 levels. We performed two critical steps which enabled us to significantly increase our sensitivity to the weak lines: the first is to fit the continuum with stellar templates, allowing us to remove the absorption features; the second is to de-rotate the spectra, decorrelating noise from imperfect telluric correction while simultaneously correlating signal from the emission lines. Broad Br (i.e. FWHM km s-1) is observed in seven of the nine nuclear spectra. We conclude the following:
-
1.
Use of the ratios of the -0 transitions, either between themselves or with other lines such as Br, H, or [Oi] Å can be misleading since in starburst and AGN environments, these levels are often (and perhaps almost always) thermalised without necessarily implying shock excitation. Indeed, we have shown strong evidence that fluorescent excitation plays a major role in the H2 excitation.
-
2.
The H2 line ratios in the circumnuclear regions are very similar in all cases. While the levels are thermalised at 1000 K, FUV-pumped gas is needed to account for the higher levels, consistent with emission from high density PDRs. In our PDR models, the typical parameters that best account for the observed line fluxes are gas density cm-3, temperature at the outer edge of the clouds K, and illuminating FUV fields times more intense than the local interstellar field. These parameters are similar to those found for the nuclei of ULIRGs by Davies et al. (2003).
-
3.
The H2 line ratios in the nuclear regions are also similar in that the levels are thermalised at 1000 K but the higher levels require FUV pumping. The observed line ratios can be accounted for by H2 excitation occupying a similar parameter space to that found for the PDRs in the circumnuclear regions, suggesting that the mechanism dominating the nuclear H2 emission could be illumination of PDRs by intense young star formation.
-
4.
We find no evidence for suppression of the 2-1 S(3) line, which may occur in X-ray irradiated gas. We suggest that even in the case of NGC 1275 (Krabbe et al., 2000), the H2 line ratios can be explained without recourse to such a phenomenon. This does not mean that such suppression does not occur – simply that on scales of pc, X-ray heating is probably not the dominant excitation mechanism.
-
5.
Despite strong dilution by a red continuum, probably associated with hot dust grains, stellar Na I absorption at 2.206 µm is seen in six of the nine nuclear spectra, suggesting that even on scales as small as 100 pc star formation is an important and active process in AGN.
References
- Allen et al. (1999) Allen M., Dopita M., Tsvetanov Z., Sutherland R., 1999, ApJ, 511, 686
- Alloin et al. (1981) Alloin D., Edmunds M., Lindblad P., Pagel B., 1981, A&A, 101, 377
- Aretxaga et al. (1999) Aretxaga I., Joguet B., Kunth D., Melnick J., Terlevich R., 1999, ApJ, 519, L123
- Barr (1986) Barr P., 1986, MNRAS, 223, 29P
- Bassani et al. (1999) Bassani L., Dadina M., Maiolino R., Salvati M., Risaliti G., Della Ceca R., Matt G., Zamorani G., 1999, ApJS, 121, 473
- Black & van Dishoeck (1987) Black J., van Dishoeck E., 1987, ApJ, 322, 412
- Boller et al. (1996) Boller T., Brandt W., Fink H., 1996, A&A, 305, 53
- Chapman et al. (2000) Chapman S., Morris S., Alonso-Herrero A., Falcke H., 2000, MNRAS, 314, 263
- Cid Fernandes et al. (2004) Cid Fernandes R., Gu Q., Melnick J., Terlevich E., Terlevich R., Kunth D., Rodrigues Lacerda R., Joguet B., 2004 MNRAS, 335, 273
- Collier et al. (1998) Collier S., et al., 1998, ApJ, 500, 162
- Crenshaw et al. (2003) Crenshaw D., Kraemer S., Gabel J., 2003, AJ, 126, 1690
- Davies et al. (2002) Davies R., Burston A., Ward M., 2002, MNRAS, 329, 367
- Davies et al. (2003) Davies R., Sternberg A., Lehnert M., Tacconi-Garman L., 2003, ApJ, 597, 907
- Davies et al. (2004a) Davies R., Tacconi L., Genzel R., 2004a, ApJ, 602, 148
- Davies et al. (2004b) Davies R., Tacconi L., Genzel R., 2004b, ApJ, 613, 781
- Davies et al. (2005) Davies R., et al., in prep.
- de Grijp et al. (1992) de Grijp M., Keel W., Miley G., Goudfrooij P., Lub J., 1992, A&AS, 96, 389
- Draine (1978) Draine B., 1978, ApJS, 36, 595
- Draine & Woods (1990) Draine B., Woods D., 1990, ApJ, 363, 464
- Förster Schreiber (2000) Förster Schreiber N., 2000, AJ, 120, 2089
- Förster Schreiber et al. (2003) Förster Schreiber N., Genzel R., Lutz D., Sternberg A., 2003, ApJ, 599, 193
- Genzel et al. (1995) Genzel R., Weitzel L., Tacconi-Garman L., Blietz M., Cameron M., Krabbe A., Lutz D., Sternberg A., 1995, ApJ, 444, 129
- Gerin et al. (1988) Gerin M., Nakai N., Combes F., 1988, A&A, 203, 44
- González Delgado et al. (2001) González Delgado R., Heckman T., Leitherer C., 2001, ApJ, 546, 845
- Hjelm & Lindblad (1996) Hjelm M., Lindblad P., 1996, A&A, 305, 727
- Imanishi (2003) Imanishi M., 2003, ApJ, 599, 918
- Iyomoto et al. (1996) Iyomoto N., Makishima K., Fukazawa Y., Tashiro M., Ishisaki Y., Nakai N., Taniguchi Y., 1996, PASJ, 48, 231
- Iyomoto et al. (1997) Iyomoto N., Makishima K., Fukazawa Y., Tashiro M., Ishisaki Y., 1996, PASJ, 49, 425
- Kawara et al. (1987) Kawara K., Nishida M., Gregory B, 1987, ApJ, 321, L35
- Kawara et al. (1990) Kawara K., Nishida M., Gregory B, 1990, ApJ, 352, 443
- Kewley et al. (2001) Kewley L., Heisler C., Dopita M., Lumsden S., 2001, ApJS, 132, 37
- Kollatschny & Fricke (1983) Kollatschny W., Fricke K., 1983, A&A, 125, 276
- Kotilainen et al. (2000) Kotilainen J., Reunanen J., Laine S., Ryder S., 2000, A&A, 353, 834
- Krabbe et al. (2000) Krabbe A., Sams B., Genzel R., Thatte N., Prada F., 2000, A&A, 354, 439
- Lindblad (1999) Lindblad P., 1999, A&AR, 9, 221
- Maiolino et al. (1994) Maiolino R., Stanga R., Salvati M., Rodríguez Espinosa J., 1994, A&A, 290, 40
- Malkan et al. (1998) Malkan M., Gorjian V., Tam R., 1998, ApJS, 117, 25
- Maloney et al. (1996) Maloney P., Hollenbach D., Tielens A., 1996, ApJ, 466, 561
- Maraston (2004) Maraston C., 2004, MNRAS submitted, astro-ph/0410207
- Matt et al. (2001) Matt G., Guainazzi M., Perola G., Fiore F., Nicastro F., Cappi M., Piro L., 2001, A&A, 377, L31
- Mazzarella et al. (1994) Mazzarella J., Voit G., Soifer B., Matthews K., Graham J., Armus L., Shupe D., 1994, AJ, 107, 1274
- Moorwood et al. (1996) Moorwood A., van der Werf P., Kotilainen J., Marconi A., Oliva E., 1996, A&A, 308, L1
- Moshir et al. (1990) Moshir M., et al., 1990, IRAS Faint Source Catalogue (ver. 2.0; Greenbelt: NASA/GSFC)
- Mouri et al. (1989) Mouri H., Taniguchi Y., Kawara K., Nishida M., 1989, ApJ, 346, L73
- Mouri et al. (1990) Mouri H., Kawara K., Taniguchi Y., Nishida M., 1990, ApJ, 356, L39
- Nagar et al. (2002) Nagar N., Oliva E., Marconi A., Maiolino R., 2002, A&A, 391, L21
- Quillen et al. (1999) Quillen A., Alonso-Herrero A., Rieke M., Rieke G., Ruiz M., Kulkarni V., 1999, ApJ, 527, 696
- Risaliti et al. (2000) Risaliti G., Maiolino R., Bassani L., 2000, A&A, 356, 33
- Rodríguez-Ardila et al. (2002) Rodríguez-Ardila A., Pastoriza M., Prato L., 2002, ApJ, 579, 214
- Rouan et al. (2004) Rouan D., et al., 2004, A&A, 417, L1
- Schachter et al. (1998) Schachter J., Fiore F., Elvis M., Mathur S., Wilson A., Morse J., Awaki H., Iwasawa K., 1998 APJ, 503, L123
- Sellgren (1984) Sellgren K., 1984, ApJ, 277, 623
- Sosa-Brito et al. (2001) Sosa-Brito R., Tacconi-Garman L., Lehnert M., Gallimore J., 2001, ApJS, 136, 61
- Sternberg & Dalgarno (1989) Sternberg A., Dalgarno A., 1999, ApJ, 338, 197
- Sternberg (1998) Sternberg A., 1998, ApJ, 506, 721
- Sternberg & Neufeld (1999) Sternberg A., Neufeld D., 1999, ApJ, 516, 371
- Stevens et al. (1999) Stevens I., Forbes D., Norris R., 1999, MNRAS, 306, 479
- Storchi-Bergmann & Bonatto (1991) Storchi-Bergmann T., Bonatto C., 1991 MNRAS, 250, 138
- Storchi-Bergmann et al. (1993) Storchi-Bergmann T., Baldwin J., Wilson A., 2003, ApJ, 410, L11
- Storchi-Bergmann et al. (1996) Storchi-Bergmann T., Wilson A., Baldwin J., 1996, ApJ, 460, 252
- Storchi-Bergmann et al. (2000) Storchi-Bergmann T., Raimann D., Bica E., Fraquelli H., 2001, ApJ, 544, 747
- Storchi-Bergmann et al. (2001) Storchi-Bergmann T., González Delgado R., Schmitt H., Cid Fernandes R., Heckman T., 2001, ApJ, 559, 147
- Storchi-Bergmann et al. (2003) Storchi-Bergmann T., et al., 2003, ApJ, 598, 956
- Sugai et al. (1997) Sugai H., Malkan M., Ward M., Davies R., McLean I., 1997, ApJ, 481, 186
- Thornley et al. (2000) Thornley M., Förster Schreiber N., Lutz D., Genzel R., Spoon H., Kunze D., Sternberg A., 2000, ApJ, 539, 641
- Tiné et al. (1997) Tiné S., Lepp S., Gredel R., Dalgarno A., 1997, ApJ, 481, 282
- Turner & Pounds (1989) Turner T., Pounds K., 1989, MNRAS, 240, 833
- Veilleux et al. (1997) Veilleux S., Goodrich R., Hill G., 1997, ApJ, 477, 631
- Veilleux et al. (2001) Veilleux S., Shopbell P., Miller S., 2001, ApJ, 121, 198
- Véron-Cetty et al. (2001) Véron-Cetty M.-P., V eron P., Gonçalves A., 2001, A&A, 372, 730
- Wallace & Hinkle (1997) Wallace L., Hinkle, K, 1997, ApJS, 111, 445
- Wehrel & Morris (1988) Wehrle A., Morris M., 1988, AJ, 95, 1689
- Wilman et al. (2005) Wilman R., Edge A., Johnstone R., 2005, MNRAS, 359, 755
- Wilson et al. (1985) Wilson A., Baldwin J., Ulvestad J., 1985, ApJ, 291, 627
- Wolniewicz et al. (1998) Wolniewicz L., Simbotin I., Dalgarno A., 1998, ApJS, 115, 293
- Xue et al. (1998) Xue S.-J., Otani C., Mihara T., Cappi M., Matsuoka M., 1998, PASJ, 50, 519
| object | AGNaa AGN types, coordinates, and redshifts are taken from the NASA/IPAC Extragalactic Database. | RAaa AGN types, coordinates, and redshifts are taken from the NASA/IPAC Extragalactic Database. | decaa AGN types, coordinates, and redshifts are taken from the NASA/IPAC Extragalactic Database. | czaa AGN types, coordinates, and redshifts are taken from the NASA/IPAC Extragalactic Database. | Distancebb Luminosity distance and angular size scale calculated using km s-1 Mpc-1 and . | 1″bb Luminosity distance and angular size scale calculated using km s-1 Mpc-1 and . | seeingcc Seeing is measured from the standard star for each data set, and indicates that for the short and long wavelength segments respectively. See the text for a description of how the segments were matched and combined. |
|---|---|---|---|---|---|---|---|
| type | (J2000) | (J2000) | (km s-1) | (Mpc) | (pc) | (″) | |
| NGC 1097 | Sy1 | 02 46 19.0 | 30 16 30 | 1275 | 18 | 90 | 0.7, 1.0 |
| NGC 1365 | Sy1.8 | 03 33 36.4 | 36 08 25 | 1640 | 23 | 110 | 0.8, 0.8 |
| NGC 2992 | Sy2 | 09 45 42.0 | 14 19 35 | 2310 | 33 | 160 | 0.7, 0.7 |
| NGC 5506 | Sy1.9 | 14 13 14.8 | 03 12 27 | 1850 | 27 | 130 | 1.4, 0.6 |
| NGC 7582 | Sy2 | 23 18 23.5 | 42 22 14 | 1580 | 23 | 110 | 1.2, 0.8 |
| MRK 1044 | Sy1 | 02 30 05.4 | 08 59 53 | 4930 | 71 | 330 | 0.8, 0.7 |
| NGC 1194 | Sy1 | 03 03 49.1 | 01 06 31 | 4060 | 58 | 270 | 1.3, 0.7 |
| ESO 438-G9 | Sy1.5 | 11 10 48.0 | 28 30 04 | 7010 | 101 | 470 | 0.5, 0.8 |
| NGC 7469 | Sy1.2 | 23 03 15.6 | 08 52 26 | 4890 | 70 | 330 | 0.6, 0.5 |
| object | S12aa IRAS data is from the Faint Source Catalogue (Moshir et al., 1990). | S25aa IRAS data is from the Faint Source Catalogue (Moshir et al., 1990). | S60aa IRAS data is from the Faint Source Catalogue (Moshir et al., 1990). | S100aa IRAS data is from the Faint Source Catalogue (Moshir et al., 1990). | Fbb 2–10 keV hard X-ray flux. References: Bassani et al. (1999); Turner & Pounds (1989). | K-magccK-band magnitude extracted in a 1.0″ length of a 1.0″ slit. | dd 1-0 S(1) line flux extracted in a 1.0″ length of a 1.0″ slit; errors are estimated from the RMS of the residual spectrum after subtracing the stellar continuum and emission line fits; they do not include calibration uncertainties. | ||
|---|---|---|---|---|---|---|---|---|---|
| Jy | Jy | Jy | Jy | 10-15 W m-2 | 10-18 W m-2 | ||||
| NGC 1097 | 1.99 | 5.51 | 44.5 | 85.3 | 2 | 11.8 | 3.100.04 | 4.5 | 10.64 |
| NGC 1365 | 3.37 | 10.8 | 76.1 | 142.5 | 5 | 9.8 | 0.78 | 4.1 | 11.09 |
| NGC 2992 | 0.49 | 1.26 | 8.50 | 24.9 | 5 | 10.1 | 8.630.06 | 5.4 | 10.54 |
| NGC 5506 | 1.28 | 3.64 | 8.41 | 8.89 | 90 | 9.3 | 6.080.18 | 5.1 | 10.41 |
| NGC 7582 | 1.62 | 6.44 | 49.1 | 72.9 | 17 | 11.4 | 1.520.06 | 4.4 | 10.85 |
| MRK 1044 | 0.10 | 0.22 | 0.43 | 0.88 | 11.3 | 0.19 | 4.4 | 10.08 | |
| NGC 1194 | 0.27 | 0.51 | 0.77 | 0.93 | 12.5 | 0.240.03 | 4.4 | 10.21 | |
| ESO 438-G9 | 0.32 | 0.62 | 3.14 | 4.22 | 11.0 | 1.900.05 | 5.8 | 11.03 | |
| NGC 7469 | 1.35 | 5.79 | 25.9 | 34.9 | 30 | 10.4 | 6.470.12 | 6.0 | 11.59 |
| line and wavelength (m) | ||||||||
|---|---|---|---|---|---|---|---|---|
| object/model | 1-0 S(2) | 3-2 S(5) | 2-1 S(3) | 1-0 S(1) | 2-1 S(2) | 3-2 S(3) | 1-0 S(0) | 2-1 S(1) |
| 2.0338 | 2.0656 | 2.0735 | 2.1218 | 2.1542 | 2.2014 | 2.2233 | 2.2477 | |
| circumnuclear (objects with Mpc) | ||||||||
| NGC 1097 | 0.3670.022 | 0.119 | 0.2200.013 | 1.0000.014 | 0.1300.016 | 0.053 | 0.3300.018 | 0.1990.013 |
| NGC 1365 | 0.3790.011 | 0.0630.015 | 0.2300.008 | 1.0000.007 | 0.1110.010 | 0.0430.010 | 0.3400.011 | 0.1890.007 |
| NGC 2992 | 0.4040.017 | 0.040 | 0.1640.010 | 1.0000.009 | 0.0750.013 | 0.0900.010 | 0.3100.009 | 0.1780.010 |
| NGC 5506 | 0.3080.018 | 0.046 | 0.1780.012 | 1.0000.013 | 0.045 | 0.027 | 0.2570.008 | 0.1420.011 |
| NGC 7582 | 0.3680.010 | 0.041 | 0.1680.009 | 1.0000.006 | 0.027 | 0.0530.011 | 0.2700.012 | 0.1460.008 |
| mean | 0.3650.032 | 0.061 | 0.1920.028 | 1.0000.010 | 0.1050.023 | 0.0620.020 | 0.3010.033 | 0.1710.023 |
| nuclear (objects with Mpc) | ||||||||
| NGC 1097 | 0.3780.015 | 0.046 | 0.1630.009 | 1.0000.012 | 0.1070.013 | 0.0690.007 | 0.2540.009 | 0.0910.009 |
| NGC 1365 | no H2 lines detected | |||||||
| NGC 2992 | 0.3100.019 | 0.071 | 0.1800.014 | 1.0000.007 | 0.1260.026 | 0.1280.022 | 0.3460.019 | 0.1470.018 |
| NGC 5506 | — | 0.168 | 0.1730.039 | 1.0000.030 | 0.225 | 0.065 | 0.3330.030 | 0.138 |
| NGC 7582 | 0.4900.036 | 0.228 | 0.2770.045 | 1.0000.039 | 0.283 | 0.2330.041 | 0.4060.045 | 0.1750.045 |
| nuclear (objects with Mpc) | ||||||||
| MRK 1044 | no H2 lines detected | |||||||
| NGC 1194 | — | 0.333 | 0.5090.093 | 1.0000.120 | 0.199 | 0.242 | 0.232 | 0.258 |
| ESO 438-G9 | 0.3390.022 | 0.122 | 0.1470.029 | 1.0000.027 | 0.1330.019 | 0.1720.022 | 0.3320.029 | — |
| NGC 7469 | — | 0.062 | 0.0690.019 | 1.0000.019 | 0.1040.014 | 0.042 | 0.2900.013 | 0.0860.017 |
| mean | 0.3790.068 | 0.147 | 0.2170.132 | 1.0000.036 | 0.1180.012 | 0.1500.054 | 0.3270.047 | 0.1250.038 |
| thermal: 1000 K | 0.27 | 0.00 | 0.00 | 1.00 | 0.00 | 0.00 | 0.27 | 0.01 |
| 2000 K | 0.37 | 0.00 | 0.08 | 1.00 | 0.03 | 0.01 | 0.21 | 0.08 |
| PDR: model 1 | 0.49 | 0.02 | 0.22 | 1.00 | 0.25 | 0.10 | 0.54 | 0.53 |
| model 2 | 0.32 | 0.04 | 0.15 | 1.00 | 0.08 | 0.07 | 0.33 | 0.17 |
| model 3 | 0.35 | 0.00 | 0.05 | 1.00 | 0.02 | 0.00 | 0.22 | 0.05 |
| model 4 | 0.31 | 0.05 | 0.16 | 1.00 | 0.08 | 0.07 | 0.32 | 0.17 |
| model 5 | 0.29 | 0.02 | 0.10 | 1.00 | 0.04 | 0.04 | 0.33 | 0.11 |
Note. — The 1 error is measured directly from the local spectrum around each emission lines as the rms of the residual after subtraction of both the stellar continuum and emission lines. Lines with no ratio given were not within the wavelength covered; 3 upper limits are given for lines within this range that were not detected. For details of the PDR models, see Davies et al. (2003).
| model | aaFUV intensity relative to that in the local interstellar medium ( photons s-1 m-2; Draine (1978)) | bbgas density . | ccFor model 1 K at all cloud depths. For the other models, the temperature varies as given in Eq. (1) of Davies et al. (2003). | dd1-0 S(1) intensity predicted by the model. Intensities for other lines can be found by using the model line ratios given in Table 3. | eeTotal intensity summed over all H2 lines predicted by the model. |
|---|---|---|---|---|---|
| (cm-3) | (K) | (W m-2 sr-1) | (W m-2 sr-1) | ||
| 1 | |||||
| 2 | |||||
| 3 | |||||
| 4 | |||||
| 5 |
.