Halo Mass Profiles and Low Surface Brightness galaxies rotation curves
Abstract
A recent study has claimed that the rotation curve shapes and mass densities of Low Surface Brightness (LSB) galaxies are largely consistent with CDM predictions, in contrast to a large body of observational work. I demonstrate that the method used to derive this conclusion is incapable of distinguishing the characteristic steep CDM mass-density distribution from the core-dominated mass-density distributions found observationally: even core-dominated pseudo-isothermal haloes would be inferred to be consistent with CDM. This method can therefore make no definitive statements on the (dis)agreement between the data and CDM simulations. After introducing an additional criterion that does take the slope of the mass-distribution into account I find that only about a quarter of the LSB galaxies investigated are possibly consistent with CDM. However, for most of these the fit parameters are so weakly constrained that this is not a strong conclusion. Only 3 out of 52 galaxies have tightly constrained solutions consistent with CDM. Two of these galaxies are likely dominated by stars, leaving only one possible dark matter dominated, CDM-consistent candidate, forming a mere 2 per cent of the total sample. These conclusions are based on comparison of data and simulations at identical radii and fits to the entire rotation curves. LSB galaxies that are consistent with CDM simulations, if they exist, seem to be rare indeed.
1 Introduction
In recent years the inner structure of dark matter haloes has been the topic of some discussion. Observations suggest that the dark matter distribution in disk galaxies has a roughly constant density core, with a typical size of order a few kpc. A recent analysis suggests a shallow power-law mass density distribution with (de Blok et al., 2003). On the other hand, numerical simulations based on the ()Cold Dark Matter (CDM) paradigm suggest a very steep inner mass density distribution, a so-called “cusp” (Navarro, Frenk & White, 1996, 1997) [NFW]. The most recent simulations suggest slopes with (Fukushige et al., 2004; Klypin et al., 2001; Ghigna et al., 2000; Moore et al., 1998, 1999; Jing et al., 1995). There is strong consensus that this slope cannot be as shallow as the observations suggest.
The rotation curves of Low Surface Brightness (LSB) galaxies are considered particularly clean tests of the CDM paradigm at galaxy scales. LSB galaxies are dominated by dark matter (de Blok & McGaugh, 1997), and their dynamics should thus give a more or less direct map of the dark matter distribution. LSB galaxy rotation curves, together with the missing dwarf or substructure problem (e.g. Moore et al. 1999), currently form the most serious challenges for the CDM model. There has been much debate on this topic in recent years. This is however not the place to review this debate, and the reader is referred to the summaries by e.g. Binney (2004); de Blok et al. (2003); Swaters et al. (2003) and de Blok (2004) and references therein.
On the theoretical side the “universal mass density profile” (with its characteristic cusp) as proposed by Navarro, Frenk & White (1996, 1997), has long been a corner-stone of CDM (but see Moore et al. 1998, 1999). Recent simulations presented in Navarro et al. (2004) and Hayashi et al. (2004) [hereafter H04] show that simulated CDM haloes may actually contain a range of slopes in their inner regions (though the slopes remain steep). The shallowest inner slope measured is , with an average over the simulated haloes of (at the innermost reliably resolved radius for galaxy mass haloes). With this scatter in mind, H04 argue that simple fitting functions (such as “the” NFW halo) do not capture the full variety and diversity in shapes and slopes, and suggest that this may partly explain the discrepancy between observations and simulations. They claim that the inner slope is difficult to constrain, both observationally as well as theoretically and point out that rotation curve constraints are strongest where numerical simulations are least reliable. This, as well as the potential for systematic effects in the observations, has, at least according to H04, led to an “unwarranted emphasis” on the value of the inner slope, at the cost of evaluation of the data and simulations over their full radial extent.
H04 present a novel method to fit rotation curves derived from their simulations as well as LSB galaxy rotation curves from the literature. Their method is able to describe the variety present in data and simulations and from the distributions of respective fitting parameters H04 conclude that the observed curves are consistent with the CDM paradigm; a conclusion that contradicts a large body of observational work.
For their analysis, H04 make use of the rotation curves presented in McGaugh et al. (2001), de Blok & Bosma (2002) and Swaters et al. (2003), and derive circular velocity curves for haloes from their simulations. To quantify both sets of observed and simulated rotation curves they use a three-parameter fitting formula (see e.g. Courteau 1997):
| (1) |
Here is the asymptotic velocity of the flat part of the rotation curve, is a scale radius (the transition radius between the rising and flat part of the rotation curve) and the parameter describes the abruptness of the turn-over between the rising and flat parts of the rotation curve. A higher value of results in an abrupt transition, a low value in a more gradual turn-over. Note that this function was designed to fit observed rotation curves: it specifically assumes a solid-body rise in the inner parts and a flat rotation curve in the outer parts.
H04 fit the two sets of rotation curves with this function, constraining the fit parameters slightly by insisting that
-
1.
,
-
2.
,
-
3.
,
with the maximum observed velocity in the rotation curve. Fits with [rejected by condition (1)] correspond with very abrupt transitions between the rising and flat parts of the curve. Condition (3) prevents some of the solid-body rotation curves where the asymptotic velocity is not well-constrained, from producing fits with extremely large . Conditions (1)–(3) thus help removing unrealistic values for the fit parameters.
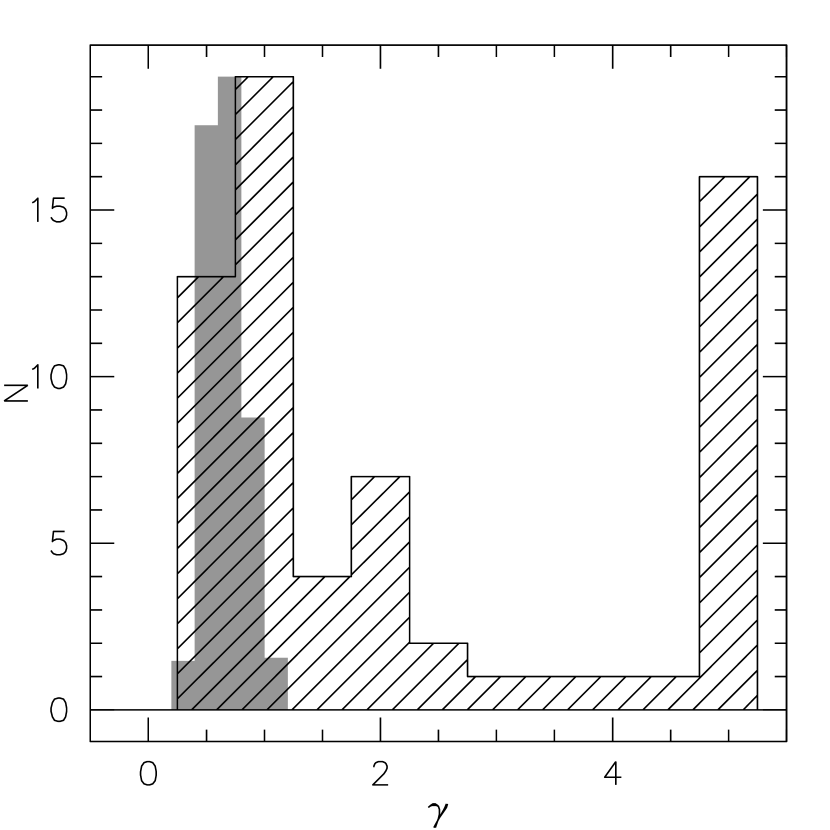
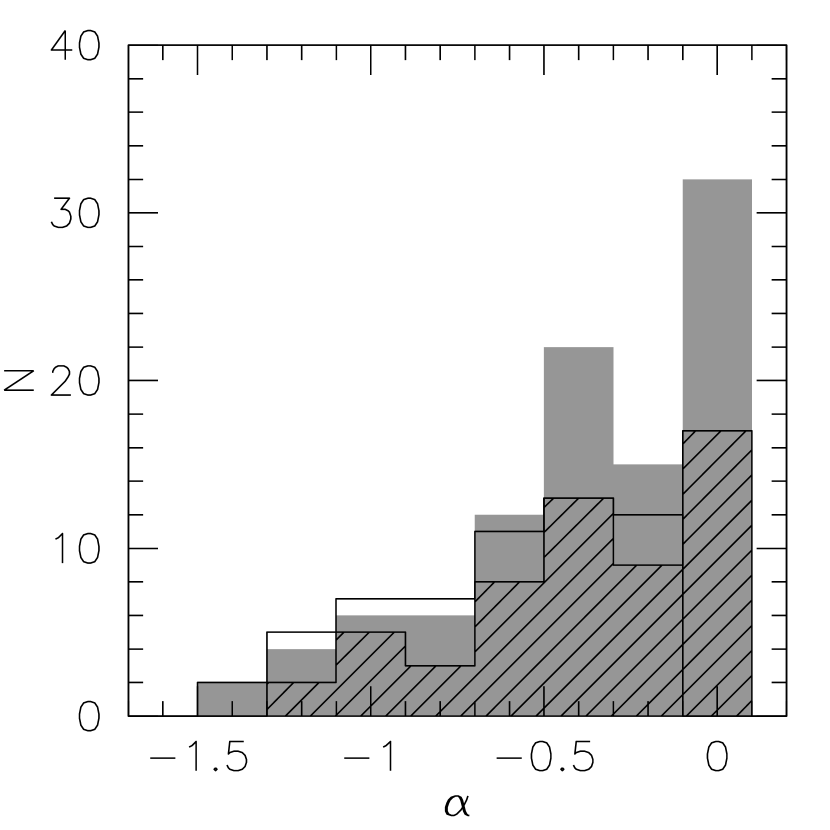
Figure 1 (after H04, their Fig. 9) shows the results presented in H04. The LSB rotation curves show a broad distribution in with two pronounced peaks: one around and a narrower one at . Some 70 per cent of the fits have . The distribution of the simulated CDM haloes is markedly different. It is narrow and centered around with a dispersion of .
At first sight the two distributions seem quite incompatible, and one might conclude that the LSB rotation curves are not consistent with the CDM simulations. H04 argue however that for most of the LSB galaxy rotation curves the reduced distribution is quite broad and shallow, so that by constraining the fit parameters slightly more, a fit can be found that is consistent with the simulations, at the cost of only a small increase in . They define these CDM-compatible constraints as:
-
i.
-
ii.
-
iii.
-
iv.
.
Here is the average density within the radius where the velocity reaches half its maximum value (Alam et al 2002). See H04 for a justification of these additional constraints, here it is sufficient to note that for the LSB galaxies is derived from the fit of Eq. (1) to the rotation curves, whereas is the predicted value for a galaxy with in the CDM model presented in Bullock et al. (2001) and Wechsler et al. (2002) (see also Fig. 2 in Alam et al. 2002 and Fig. 11 in H04). The constraint on ensures that only fits are considered with average densities close to those predicted in a standard CDM universe.
H04 find that for the majority ( 70 per cent) of the galaxies fits can be found for which both the best-fit [using constraints (1)-(3)] and the constrained [using constraints (i)-(iii)]. This group of galaxies (Group A using the terminology in H04) is thus considered to be consistent with CDM. For the remaining galaxies no CDM-compatible fit could be found (Group B in H04), or the curves were too irregular to be well fitted by Eq. (1) (Group C in H04).
The main claim in H04 is thus that most of the LSB galaxies can still be fitted reasonably well with these extra constraints and without a large increase in . They conclude, based on the agreements of the constrained, CDM-compatible and distributions with those of the simulations, that “this sample of LSB rotation curves is not manifestly inconsistent with the predictions of CDM cosmological models.” This conclusion thus contradicts most observational work on LSB rotation curves which argues the opposite.
In this paper I discuss these conclusions and investigate the method with which they are derived. I find that the method presented in H04 cannot distinguish between shallow and steep mass-density slopes, and illustrate this by showing that with this method even core-dominated, pseudo-isothermal halos would be inferred to be consistent with CDM. I introduce an additional criterion that does take the inner mass-density slope into account, and find that only a quarter of the LSB galaxies investigated are possibly consistent with CDM. However, most of these galaxies’ fit parameters are so weakly constrained that this is not a very strong conclusion. Only 3 out of the 51 galaxies investigated have tightly constrained solutions that are not significantly inconsistent with CDM. However, two of them are high surface brightness galaxies that are likely dominated by their stellar population. The net result is that in the total sample there is only one galaxy that is likely to be dark matter dominated and not significantly inconsistent with CDM. LSB galaxies that are consistent with CDM seem to be rare indeed.
In Sect. 2 I derive an analytical expression for the slope of a rotation curve, based on Eq. (1). Sect. 3 compares the slopes in both data and simulations at identical physical radii. In Sect. 4 I show that the constraints imposed by H04 are not sufficient to prove or disprove agreement with CDM. In Sect. 5 a new constraint is introduced that does take the slope into account. The results are summarised in Sect. 6.
2 Slopes
Equation (1) is a flexible, analytical function that can describe a wide range of rotation curves (see Courteau 1997 for more examples). One can, analogous to H04, use the fitting function to investigate the properties of the underlying data. Assuming a spherical halo dominated by dark matter we can use the inversion used in e.g. de Blok et al. (2001b) to derive the corresponding mass-density distribution:
| (2) |
in combination with Eq. (1) yields
| (3) |
The logarithmic slope of the mass density distribution can now be derived from Eq. (3):
| (4) |
The logarithmic, or power-law slope thus depends on both and . Fig. 2 shows for a number of values of and , where the values have been chosen to cover the range shown by the LSB rotation curve fits from H04. Changing has the effect of changing the shape of the slope-radius relations; changing shifts the relations horizontally without affecting the shape for any particular . Most of the plotted slopes are remarkably shallow at small radii. An inner asymptotic value of is predominant. The CDM slope can only be reproduced with Eqs. (1) and (4) for small values of and/or extremely small values of . Similarly, at large radii the slope converges to . These are not naturally occurring values for CDM mass profiles, with asymptotic slopes in the inner parts and in the outer parts. Equation (1) is really built to mimic the same striking features of rotation curves that led to the introduction of the pseudo-isothermal (ISO) halo, namely a solid-body rise in the inner parts, and a constant (“flat”) rotation velocity in the outer parts. One needs to make very specific choices of fitting parameters to make this function resemble an NFW profile.
3 Comparing Observations and Simulations
The H04 simulations predict steep slopes, even at the smallest reliably resolved radii, defined by the so-called convergence radius (Power et al., 2003). For the H04 dwarf galaxy models kpc or kpc for . The slope at in the simulations varies between and .
Equation (4) can be used to derive the slopes implied by the fits to the observed LSB rotation curves. For this one needs to choose a radius at which the slopes will be evaluated. In the rest of this paper two choices will be used. Firstly, the radius of the innermost measured point of the rotation curve as given in de Blok et al. (2001b) and de Blok & Bosma (2002) will be considered111Swaters et al. (2003) do not provide values for . Here a value of is used (converted using the appropriate distance), which is the typical spacing between data points for the curves presented there.. One might argue that at a different radius is probed for each rotation curve, so, secondly, a constant radius kpc kpc for all curves will be used as well. One should not expect dramatically different results from both choices though: the average value of is kpc, very much comparable with . It should be kept in mind that even though we evaluate the slope at these particular choices for the radius, the and parameters (and therefore the slope) are constrained by the entirety of the curve.
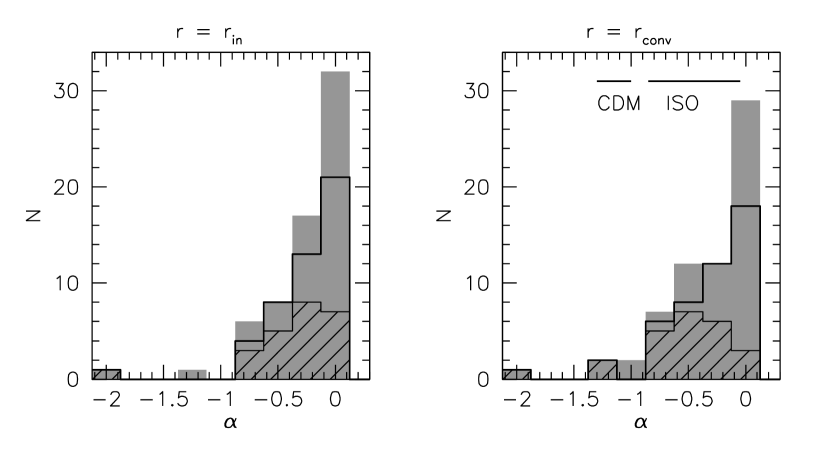
Figure 3 shows the distribution of inferred mass density slopes derived using the LSB rotation curves and the best-fit and parameters listed in Table 2 of H04. The slopes for both and kpc are shown. It is clear that the distributions are heavily biased towards shallow slopes and very different from the values found in the simulations at these radii . The small values of derived in H04 indicate that Eq. (1) fits the data well, and the problem is thus not with the quality of the fits. In Fig. 3 is also indicated the distribution of slopes for the galaxies that H04 claim are consistent with CDM (their Group A with and ). This distribution is not markedly different from that of the entire sample. From Fig. 3 one could thus conclude that the majority of slopes are inconsistent with the CDM prediction. How can this be reconciled with the H04 conclusions?
As discussed above, H04 add an extra constraint to the -parameter, and argue that the resulting agreement with the range of -values shown by the simulations implies consistency with CDM. This point will be explored in more detail below, but one can already see here that this does not solve the problem of the discrepancy between observed and simulated slopes. Consider the distribution of slopes of the subset of Group A for which (and both ), i.e. galaxies for which the best fit is (apparently) already consistent with CDM. The distribution of slopes of this sub-group is also plotted in Fig. 3. The selection criteria for this sub-group favour galaxies with steeper slopes, and it should thus come as no surprise that the dominant peak at has disappeared. Nevertheless it is remarkable that the distributions are still dominated by slopes . The distribution using peaks at . The distribution using kpc peaks at . As we are probing the slope at kpc and not in the centre, we should not expect all ISO haloes to have a flat slope at this radius. The distribution of slopes found is consistent with that expected at kpc for an ensemble of pseudo-isothermal (ISO) halos with core-radii between and kpc222Note that this range is consistent with the one derived from direct ISO rotation curve fits. For example, the 5th and 95th percentile values of the core-radius distribution for the minimum disk ISO models listed in de Blok & Bosma (2002) and McGaugh et al. (2001) are 0.6 and 5.0, respectively.. The decrease in mass-density at this radius is thus much less steep than expected for a CDM halo. The steepest slope expected for a realistic ISO halo (i.e. consistent with the smallest value kpc measured in real LSB galaxies; see results in de Blok & Bosma 2002; McGaugh et al. 2001; Swaters et al. 2003) is , with the large majority of ISO haloes having slopes less steep than that. The slopes measured in the H04 simulations at kpc vary between and , firmly inconsistent with the observed distributions.
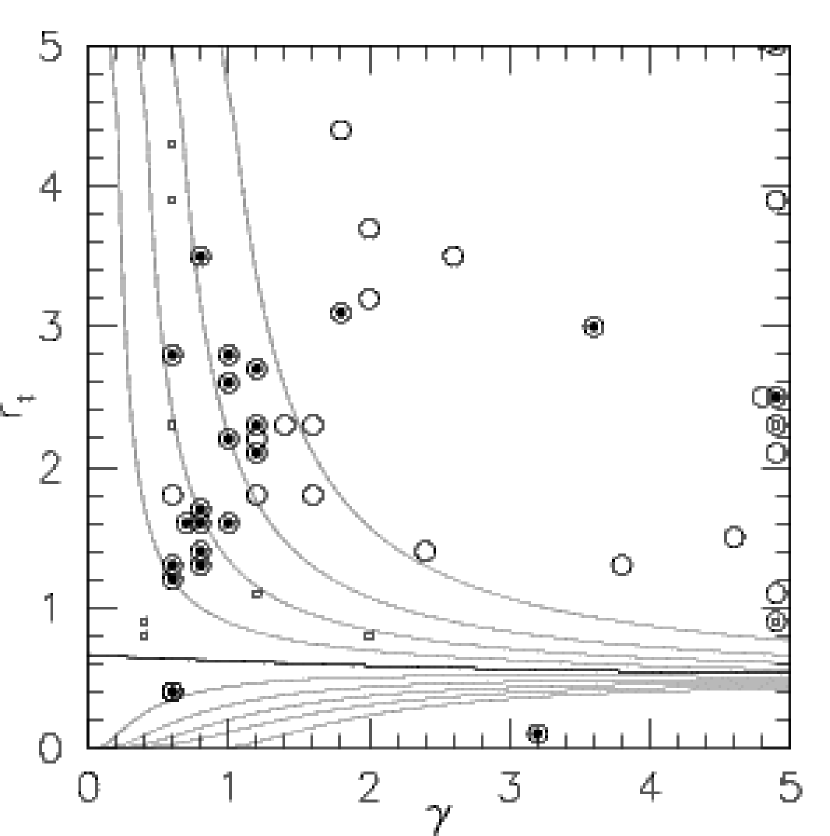
The reason for the discrepancy can best be appreciated by realizing that according to Eq. (4) the slope is a function of both and . This is shown graphically in Fig. 5 which shows iso-slope contours in the plane, as evaluated at kpc. It is immediately obvious that is not a unique function of , but depends equally strongly on . Most combinations of and with and yield slopes shallower than . Only a very small part of parameter space results in steep, CDM-compatible slopes (essentially only the area with and/or ). Constraining does not actually constrain the slope to steep, CDM-like values, but still allows values up to .
Over-plotted in Fig. 5 are the best-fit and values of the LSB rotation curves as determined by H04. A distinction is made between the entire sample (Groups A, B and C), the “CDM-compatible” Group A, and the sub-group discussed above where the best fit is apparently already CDM-compatible. The distribution of the points is not very different from group to group, though the subgroup tends to have slightly steeper slopes, as already shown in Fig. 3. Regardless of how the total sample is divided up, the very large majority of the galaxies have slopes inconsistent with the values derived in the H04 simulations. Note again that the slopes in simulations and observations are compared at identical radii, and that the and values were derived using the entirety of the rotation curves. The extra constraints introduced by H04 are thus insufficient conditions for agreement with CDM, as constraining to does not automatically imply a mass-density slope consistent with CDM. Unless one is prepared to allow for shallow slopes in CDM at these radii (making it inconsistent with its own simulations) an extra constraint on the slope is needed to ensure agreement with CDM.
4 Reductio ad absurdum with ISO haloes
Adding this extra constraint to the four introduced by H04 is only necessary if these prior constraints are insufficient to make a unique distinction between CDM and non-CDM models. If, for example, rotation curves known to be inconsistent with CDM are not rejected as such, the prior constraints are clearly insufficient to address CDM-related questions.
One can test the strength of these constraints by “observing” a sample of simulated ISO haloes. This will show that the H04 constraints are not sufficient as they imply that the majority of these ISO haloes, all with easily detectable shallow slopes, are consistent with CDM. ISO haloes form of course the one model known to be certainly inconsistent with CDM (if they were not, there would be no cusp/core controversy). The modeling procedure as described in de Blok et al. (2003) [hereafter dB03] is used. The reader is referred to that paper for an extensive description of these models. The aim there was to estimate the impact of systematic effects on the observations. For that purpose many different rotation curves were simulated and “observed” after the addition of observational uncertainties due to e.g. resolution effects and random motions. dB03 used the same datasets as the basis of their models as H04 use for their analysis, and the dB03 procedure can be directly applied here to test the fitting method and make comparisons with the H04 results.
The ISO halo parameters are chosen in such a way that the resulting curves resemble minimum disk ISO fits to the observed rotation curves. Fig. 10 from de Blok et al. (2001a) shows that mass models of LSB galaxies have asymptotic velocities (between and km s-1). Central dark matter core densities vary between (between and pc). The core radius follows from these two parameters, and has a range (between and kpc). For the models a random and are chosen from the respective logarithmic intervals. Note that these intervals encompass the entire observed parameter range. No account is taken of any correlations that might exist between these parameters, nor of any other uncertainties that might be present in the determination of halo parameters. This is reflected in the range of core-radii, which is somewhat larger than that found from observations (typically kpc). The choice of parameter ranges is therefore liberal, but sufficient for our purposes: this is not an attempt to model individual galaxies but a reductio ad absurdum proof of principle.
For each model halo an inclination, resolution and sampling interval are chosen randomly from the observed distributions described in dB03. Error-bars are assigned to each sampled point, again modeled on the observed distribution of uncertainties, with a minimum value of 4 km s-1. The curve is then corrected for inclination with a corresponding increase in the size of the error-bars. To each data point a random velocity component between and km s-1 is added. This is slightly simpler than the method used in dB03, but results in similarly sized random motions. Lastly, as real rotation curves do not all extend out to the same radius, for each galaxy a random outer radius between 3 and 20 kpc is defined, out to which the galaxy is “observed”.
Figure 6 shows a small selection of the artificial ISO curves. Over-plotted is the Eq. (1) fit using the best-fit constraints (1)-(3), as given in Sec. 1. The reduced and the fit parameters are also given in the figure. Figure 7 shows the distribution of the best-fit parameters for 100 different realisations of the model. Some per cent of the ISO galaxies have . This number should be compared with H04 where it was found that per cent of the LSB rotation curves had . The -distribution of LSB galaxies is at least in this respect consistent with that of ISO haloes. Fig. 8 shows a histogram of the slopes at kpc, both for the input ISO models and the “observed” output models, the latter derived using the best-fit and parameters. Both the input and output slopes show a clear peak at with a tail towards steeper slopes where the data are probing the edge of the dark matter core333Note again that as we are probing the slope at kpc and not in the center, we do not expect to find flat slopes for all ISO haloes. The steepest ISO slopes expected are nevertheless significantly less steep than the predicted CDM values. Cf. the remarks in Sect. 3.. The output distribution has a less pronounced peak at , and a longer tail towards steeper slopes, but as the discussion in de Blok et al. 2001b shows, this is fully consistent with the effects of the limited resolution used to “observe” the input distribution. The range in slopes found is slightly larger than that exhibited by real LSB galaxies shown in Fig. 3. This is entirely due to the larger range in core-radii used. Fits of Eq. (1) to a set of model ISO rotation curves “observed” under the same conditions as the samples of LSB galaxies under investigation here are thus able to retain and retrieve the presence of shallow inner slopes.
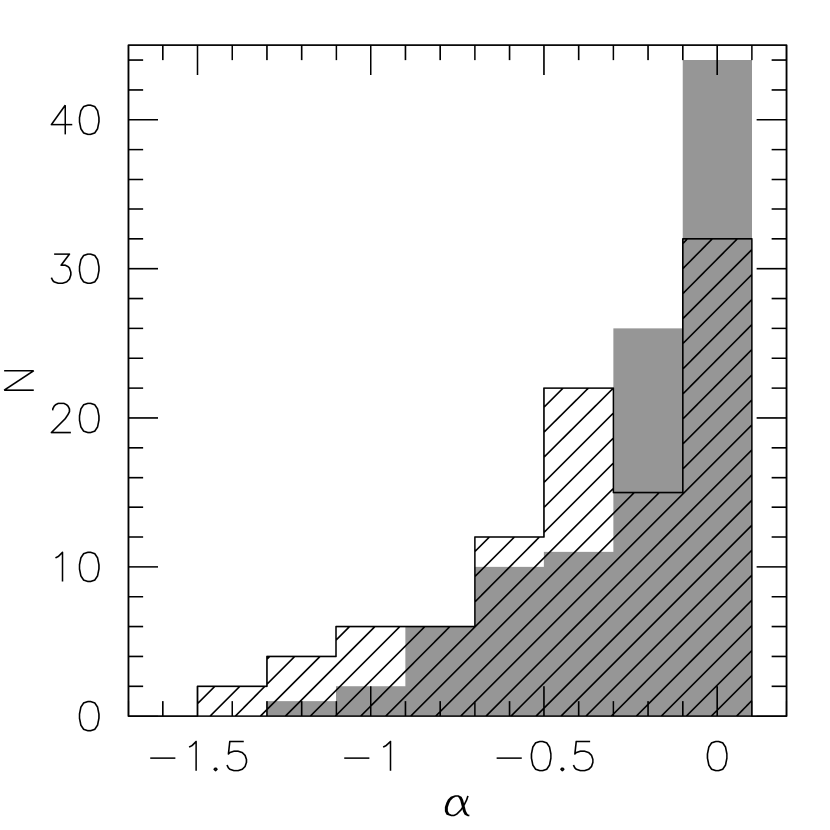
In order for the H04 criteria to make a valid discrimination between CDM and non-CDM models they thus need to be able to reject the majority of the ISO models presented here. Applying these criteria to the ISO models and again fitting using Eq. (1), one finds that reducing the upper limit of to has only a modest effect on and almost the entire ISO sample can still be fitted reasonably well with Eq. (1) and constraints (i)-(iii), as can be seen from the representative examples in Fig. 6. CDM constraint (iv) turns out to be the most restrictive one. It rejects about per cent of the simulated ISO haloes with (note that H04 show that a similar fraction of the LSB galaxies have incompatible densities as well). The bottom row of Fig. 6 shows a few of the rejected models. These do not look any different from the CDM-compatible ISO curves: condition (iv) merely removes some fraction of the ISO haloes that do not have a CDM-compatible density, without any particular selection against specific values of , , or other relevant parameters. The most surprising outcome though is that of this sample of random ISO haloes almost 60 per cent match the H04 CDM criteria. A comparison of the distribution of slopes in this CDM-compatible sample of haloes with the total distribution shows that there has been no selection against shallow slopes (Fig. 9). Of the total sample of 100 observed ISO models, per cent has an observed slope . Once condition (iv) is applied, 57 haloes remain, of which 82 per cent have best-fit slopes . Even when the slopes are derived using the constrained “CDM compatible” fit parameters, one still finds that 70 per cent has a shallow slope . As the range in core-radii used for the models is slightly larger than found observationally, the fractions mentioned here should be considered lower limits. Regardless of how the slope is defined, shallow slopes are still profusely present (and detectable!) in the models.
A comparison with the input ISO halo parameters shows that the rejected haloes are not abnormal in any way. In Fig. 10 is plotted against the input ISO halo central density . There is a clear relation, as might be expected: the average density of a halo is related to its central density. Galaxies are plotted with different symbols depending on whether they meet the constraint or not. It is clear that the halo models that do not meet the CDM criteria are only guilty of having average densities that are too high or too low. They are not degenerate, nor do they suffer from e.g. larger error bars. A more finely-tuned choice of halo parameters could bring the rejection rate down significantly, but as the input ranges of and are based on observed distributions, it is more likely that real galaxies have a wider range of densities than predicted by CDM, and condition (iv) merely selects from a much broader spectrum of galaxy properties those galaxies that happen to lie in the CDM-compatible range.
Figure 11 compares the values of for the best-fit parameters and the CDM-compatible parameters. Haloes that were rejected by the criterion are indicated in the right-hand side of the plot. Following H04 one can divide the haloes in three categories: (Group A): rotation curves that are well fit by Eq. (1) and for which a good fit with apparently CDM-compatible parameters can also be found, i.e. and . (Group B): rotation curves that are well fit by Eq. (1) but for which no good fit with CDM-compatible parameters can be found, usually because of a discrepant value of ; these curves have and or undefined (i.e., with out of range). (Group C): rotation curves that are poorly fit by Eq. (1), i.e. and . The latter category only contains a few galaxies, as there are no large-scale asymmetries in the model rotation curves, and most rise smoothly and monotonically with radius. Note the numerical agreement between the observational values presented in H04 and those of the ISO models, showing that the additional uncertainties introduced in those models are a good representation of the true observational uncertainties.
Models in Group A are, according to H04, “consistent with CDM in terms of their inferred central densities and the shape of their rotation curves.” One now has to add several caveats to this statement. Firstly, even with and a steep slope is not guaranteed. The constraints used to define Group A are not sufficient to filter out the shallow slopes that are still present and detectable in the ISO models, even after the addition of observational uncertainties. Secondly, as the inner slopes are well-defined and not necessarily steep, the shapes of the rotation curves are also not necessarily consistent with CDM. Constraints (i)-(iii) thus seem to have had hardly any effect in improving the agreement with CDM. The only restrictive constraint is condition (iv), the criterion, but even this seems to have only selected models with a certain range in average density from amongst a much larger range of models. This is illustrated in Fig. 12 where a comparison is made between average densities of the ISO models from Group A and B with those expected in a CDM universe. Galaxies in Groups A and B are indicated separately. In the H04 interpretation the ISO halos from Group A are consistent with CDM in terms of shape and average density, while group B is consistent in terms of shape but not density, even though Groups A and B both consist of pure ISO haloes, with easily detectable shallow slopes. The CDM constraints (i)-(iv) fail to take this into account and are thus insufficient to distinguish between CDM and non-CDM models. They cannot exclude the possibility that LSB galaxies have shallow inner mass-density slopes, even at . Additional constraints are needed to make a unique identification of galaxies compatible with CDM.
5 Additional Constraints
Now that it is established that constraints (i)-(iv) are not sufficient to uniquely identify CDM-compatible galaxies, the next step is to identify additional conditions that can. Figures 2 and 5 show that the inner slope and therefore the shape of the rotation curve do not depend on alone, but that there is an equally strong dependence on . These Figures also explain why H04 came to the conclusion that their four constraints were sufficient: implicit in their analysis is the assumption that the shape of the rotation curve depends on alone. While it is true that for kpc a smaller implies a steeper slope, this does not ensure a steep slope in an absolute sense. For , depending on the value of , slopes as shallow as are still possible. Furthermore, it is shown above that the H04 method does not take these shallow slopes into account, and thus allows models with easily detectable and prominent shallow slopes purpose-built in to pass the CDM test with flying colours.
In order to identify galaxies that are really compatible with CDM, an additional constraint is needed, in such a way that only combinations are allowed that yield a steep slope [as well as pass conditions (i)-(iv)]. In practice this means that parameter space needs to be searched for the minimum value that still results in a steep slope444Obviously, as Eq. (1) also depends on , one needs to take that parameter into account as well. This is done by stepping through values of at fixed and , and choosing the value that yields the lowest . Therefore .. In order to compare directly with the simulations the slopes are again evaluated at kpc. At this radius the H04 simulations show slopes , and strictly speaking one ought to restrict the search of space to slopes . However, to take into account uncertainties in data and simulations, and give the CDM models as much leeway as possible, a more liberal range of will be used. Fig. 4 shows that this is the steepest slope we can expect at this radius from an ultra-compact ISO halo with kpc, and this value thus cleanly separates the ISO and CDM domains.
At this point a short digression on the significance of is useful. In testing the goodness-of-fit of a model, the reduced , that is, the total divided by the degrees of freedom of the data, is often used. A value of is then taken as an indication that the model is a good description of the data. The reduced is an appropriate statistic when comparing different models to a single set of data, or data with a similar number of degrees of freedom. An example would be the testing of an NFW model versus an ISO model for a single rotation curve, or a set of curves with a similar number of data points.
H04 determine for each LSB rotation curve the reduced for the best-fitting model, as well as the minimum value using their CDM constraints. They argue that for most of the galaxies the CDM constraints only cause a small increase in the reduced , and that therefore the CDM-constrained models are not much worse than the best-fit models. This is not necessarily so. Remember that the reduced is the divided by the degrees of freedom of the data (the number of data points minus the number of parameters in the model). It is easy to see that in order to cause the same change in reduced the change in absolute must be much larger for a rotation curve with a large number of data points than for a rotation curve with a small number of data points. In other words, a small change in can be very significant (that is, unlikely to be consistent with the uncertainties in the data points) for a curve with a large number of data points, while it can be insignificant (entirely consistent with the uncertainties) for a curve with only a small number of data points.
The observed sample we are dealing with here contains a large number of rotation curves, with a wide range in the number of data points, varying from to over 350. The relevant parameter when judging whether a change in fit parameters yields a model that is still consistent with the data is thus not the reduced , but the change in absolute . The confidence level of any parameter combination is given by the corresponding change in with respect to the minimum value. For a model with three free parameters as used here, the confidence intervals for any fit are given by , respectively.
Using these criteria, a rotation curve can be defined to be consistent with CDM if the best-fit values of and lie within of the closest combination with a slope. In order for the fit to give any meaningful constraints, one should furthermore require that the area enclosed by the confidence level is a small fraction of the total area of parameter space investigated555The choice for is not crucial. We have tested the analysis with a level as well. Though the number of badly constrained fits increases, the relative proportions of CDM consistent vs inconsistent fits does not change appreciably.. If the latter is not the case, then any conclusions regarding agreement or disagreement with CDM are only very weak at best.
Here the Group A rotation curves, defined in H04 to be consistent with their definition of CDM, are investigated again using the new constraints666Here only the de Blok & Bosma (2002) and McGaugh et al. (2001) data are investigated. However, there is no reason to believe that the Swaters et al. (2003) data set differs from the other two in any way.. Groups B and C are already inconsistent with CDM using the more relaxed H04 constraints, and will therefore not be investigated further. For each rotation curve from Group A the minimum was found using Eq. (1), and the change in necessary to be consistent with a slope was determined. The -confidence interval corresponding to this was also calculated, as well as the ratio of the area enclosed by the contour and the total area of parameter space searched kpc). As described above, the ratio is used to determine whether a solution is well-constrained or not. Small values of indicate that the area is only a small fraction of total parameter space, and therefore yield significant solutions. Large values of indicate that the fit does not constrain models in a significant way.
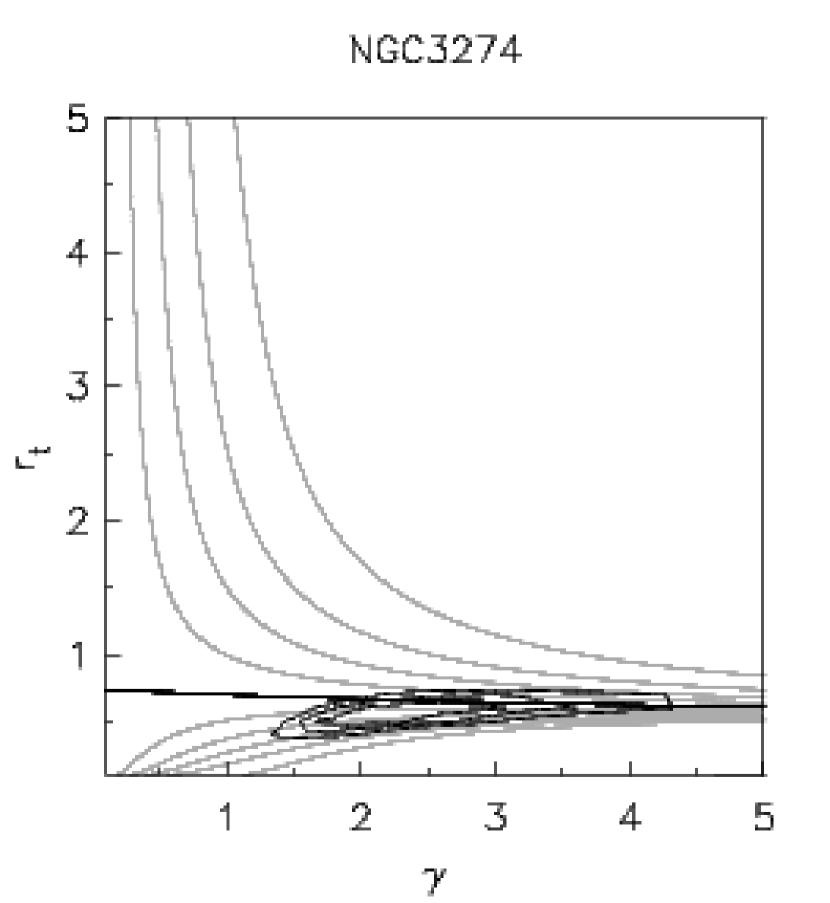
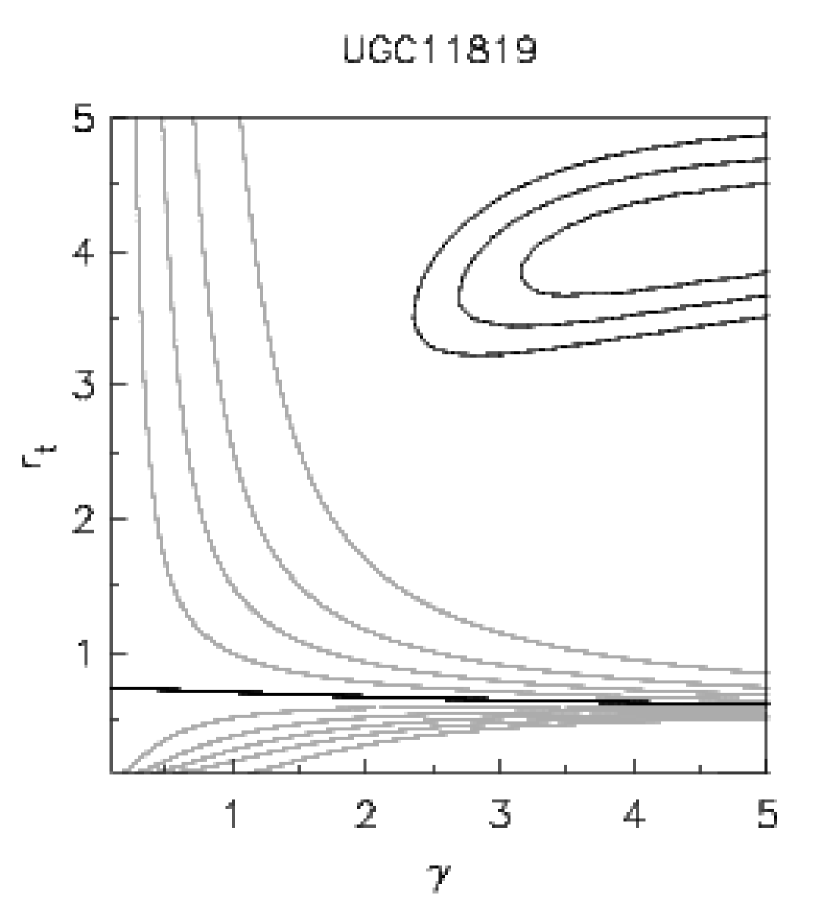
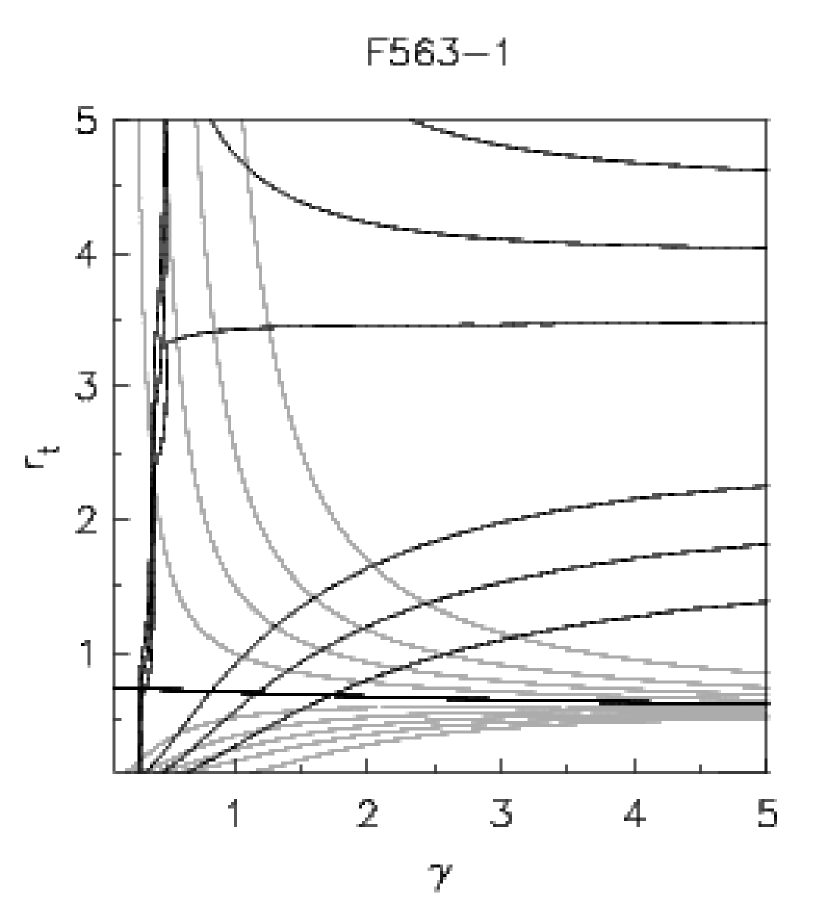
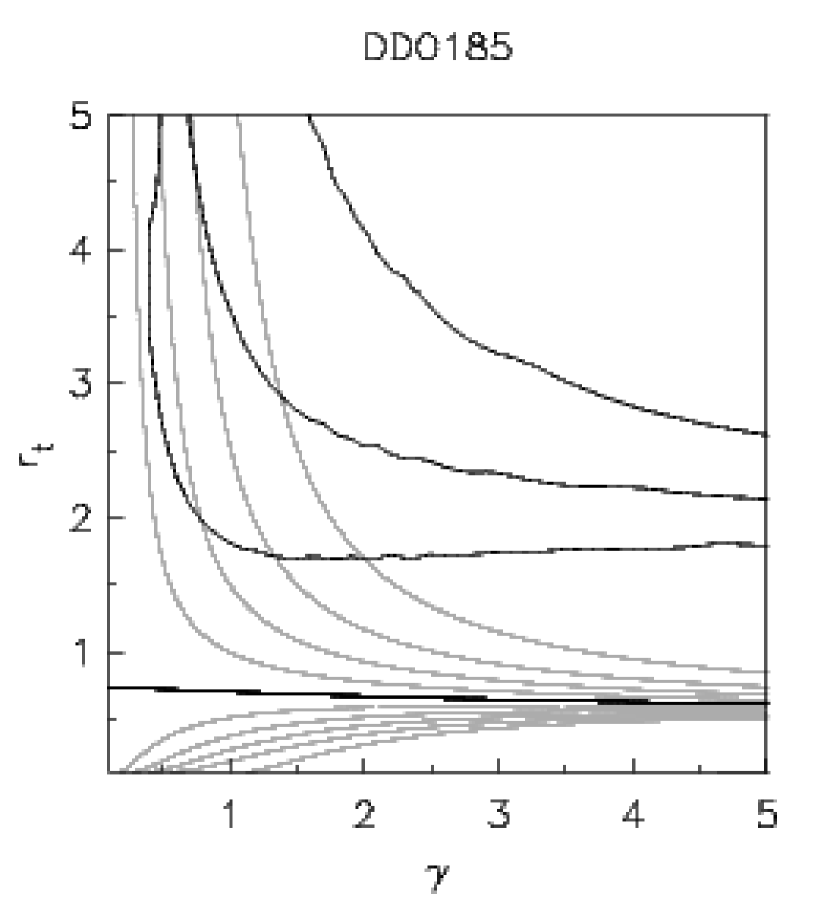
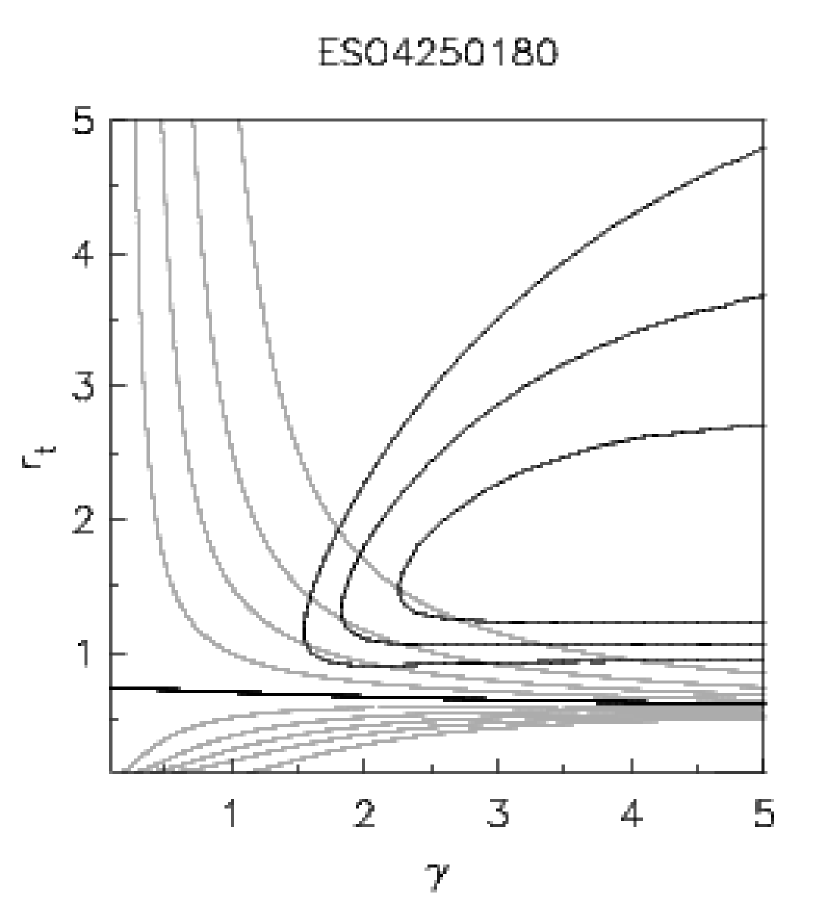
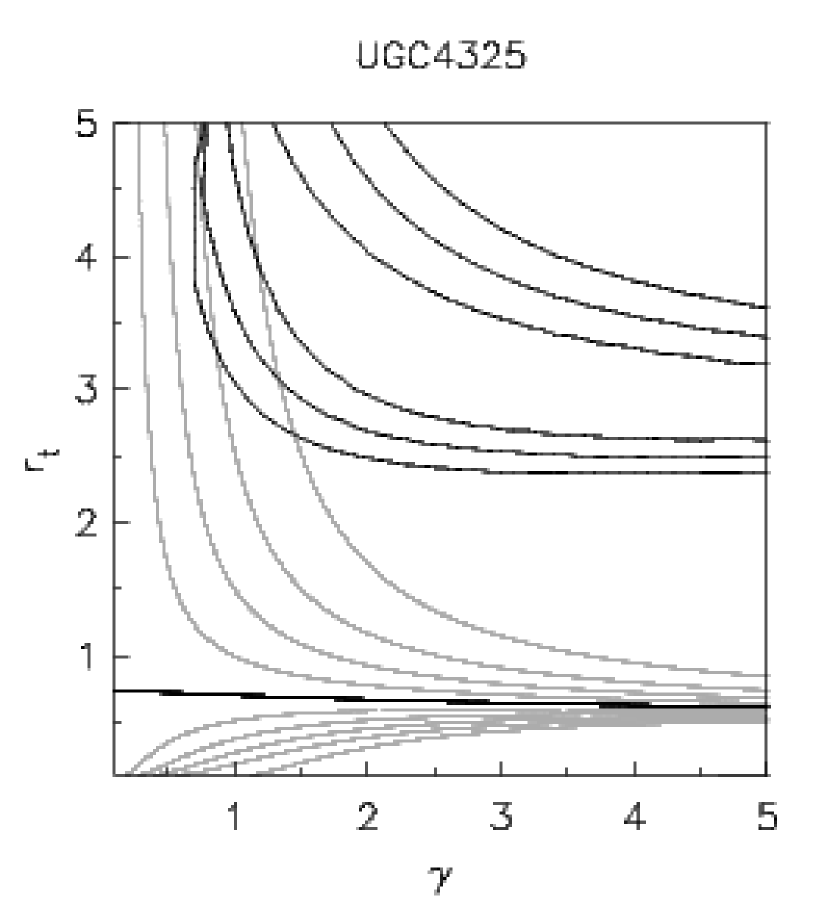
The results are given in Table 1, where the galaxies are sorted in order of the number of data-points in each individual rotation curve. Fig. 13 shows the confidence contours for a number of representative galaxies as described below. From studying the plots of the contours for all galaxies, it was found that a value is a reasonable discriminator between well-constrained and badly constrained fits, but the precise value of is not critical (see Fig. 14 for some examples of fits). The galaxies in Table 1 fall in four distinct categories:
-
1.
Well-constrained solutions, consistent with CDM: objects with best fits within of a steep slope parameter combination, and with a well-constrained solution. An example is NGC3274, as shown in Fig. 13. This category consists of 3 out of the 36 galaxies in Group A.
-
2.
Well-constrained solutions, inconsistent with CDM: objects with best fits more than away from a steep slope parameter combination, and with a well-constrained solution. An example is UGC 11819, as shown in Fig. 13. This category contains 17 out of 36 galaxies.
-
3.
Badly constrained solutions, consistent with CDM: objects with best fits within of a steep slope parameter combination, but with a badly constrained solution. An example is F563-1, as shown in Fig. 13. This category contains 12 out of 36 galaxies.
-
4.
Badly constrained solutions, inconsistent with CDM: objects with best fits more than away from a steep slope parameter combination, and with a badly constrained solution. An example is DDO 185, as shown in Fig. 13. This category contains 4 out of 36 galaxies.
It is clear that only galaxies from the first two categories, i.e. with , can help constrain halo models. A glance at Table 1 shows that most of the solutions that are consistent with CDM are actually badly constrained. This is investigated further in Fig. 15. Here is plotted against the number of data points in each rotation curve. A distinction is made between rotation curves that are consistent with CDM and those that are inconsistent with CDM using the constraints introduced here. Table 1 and Fig. 15 lead to several conclusions. Firstly, of the 15 galaxies that are consistent with CDM, 13 have less than 30 data points. Furthermore, of these 13 galaxies, only 1 has (i.e. is well-constrained). Looking at the 21 galaxies that are inconsistent with CDM, only 10 have less than 30 data points. Of these 10 galaxies, all except one have . Rotation curves with more than 30 data points tend to be better constrained on average, as well as have a tendency to be inconsistent with CDM. It is also interesting to note that even amongst galaxies with only a limited number of data points, the most constrained solutions (small ) tend to be those inconsistent with CDM. The majority of solutions per cent) that are consistent with CDM have only a small number of data points and are ill-constrained. These ill-constrained solutions therefore do not decide between any model one way or the other, and statements that these galaxies are consistent with CDM are thus not very strong. Of the well-constrained solutions the large majority is inconsistent with CDM. Furthermore, of the 13 galaxies with more than 30 data points only 2 are consistent with CDM. These two galaxies (NGC 3274 and NGC 4455) also happen to have the smallest optical scale-lengths and highest surface brightnesses from all galaxies with available photometry in the McGaugh et al. (2001), de Blok & Bosma (2002) and Swaters et al. (2003) samples: both galaxies have mag arcsec-2. These galaxies are therefore unlikely to be dominated by dark matter in their inner parts and it is very likely that the steep slopes in these two galaxies simply reflect the stellar mass distribution (see also the discussion on NGC 3274 in Sec. 9.2.2 of de Blok & Bosma 2002).
Amongst the rotation curves with less than 30 points there is only one galaxy with that seems consistent with CDM. This is UGC 731, a bona-fide LSB dwarf, and is the best and only candidate in the entire observed sample for a CDM-consistent, dark-matter-dominated galaxy with a well-constrained solution. The level of agreement is not perfect though, UGC 731 is consistent with a slope at the confidence level, with the confidence level decreasing to for an slope, which is still only the upper limit of the range of slopes expected from the simulations.
Once the steep slope constraint is added to the H04 constraints there are thus only 3 galaxies left that have a well-constrained fit consistent with a steep slope and CDM. Of these 3 galaxies, 2 are of very high surface brightness and are likely to be dominated by stars in the inner parts, leaving only one possible candidate with a well-constrained CDM-compatible fit. The large majority of the well-constrained fits strongly prefer shallow slopes.
The 2 limit used here already indicates that for many galaxies it is difficult to adjust the fit parameters to get a CDM-compatible fit. Restrictive as this criterion is, it really only gives an upper limit to the true probability. While one has the freedom to adjust the parameters of an individual fit to test the likelihood of an hypothesis for one particular rotation curve, this becomes problematic when dealing with many fits. If every fit is individually adjusted to fit a particular model, does that still constitute a proper test? An analogue can perhaps be found in some of the first supernova results that indicated the existence of a cosmological constant (e.g. Riess et al. 1998). The majority of the supernovae in that early work were each individually consistent within with the non-existence of . Even though the data showed a systematic trend, each measurement could have been corrected individually to fit the no- model. However, the joint result of these small inconsistencies has formed the basis for the discovery of the effects of on the expansion of the universe. While it would be presumptuous to compare those results with the current analysis, it does show that it is important to pay attention to the global conclusion that is forced upon us by the data.
One thing that is clear is that galaxies that are significantly consistent with CDM in terms of their inferred central densities and the shapes of their rotation curves seem to be rare indeed.
6 Summary
I have investigated the claim by H04 that the majority of rotation curves of LSB galaxies are not inconsistent with CDM. I have shown that the method used is unable to distinguish between shallow and steep slopes, even when these are obviously present and easily detectable. I illustrate this by showing that with the H04 method one would infer even pseudo-isothermal, core-dominated haloes to be consistent with CDM. An extra constraint based on the mass-density slope is thus needed to make more definitive statements on any (dis)agreement with CDM. Using this extra criterion I show that only a quarter of the LSB galaxies can be said to be consistent with CDM, as opposed to the three quarters found by H04. The majority of these CDM-consistent LSB galaxies do however have fit parameters that are so ill-constrained, that they are consistent with virtually anything. Restricting the analysis to galaxies with well-constrained solutions, I find that only 3 out of the 20 well-constrained galaxies are possibly consistent with CDM; two of these are High Surface Brightness dwarf galaxies that are likely to be dominated by stars.
In summary, a comparison of the circular velocity profiles of CDM haloes with rotation curves of LSB galaxies indicates that the shapes and inferred central densities of most LSB galaxies are mostly inconsistent with those of simulated haloes within the limitations imposed by observational error.
References
- Alam et al. (2002) Alam, S. M. K., Bullock, J. S., Weinberg, D. H. 2002, ApJ, 572, 34
- Binney (2004) Binney, J. 2004, IAU Symposium, 220, 3
- Bullock et al. (2001) Bullock, J. S., Kolatt, T. S., Sigad, Y., Somerville, R. S., Kravtsov, A. V., Klypin, A. A., Primack, J. R.,& Dekel, A. 2001, MNRAS, 321, 559
- Courteau (1997) Courteau, S. 1997, AJ, 114, 2402
- de Blok (2004) de Blok, W. J. G. 2004, IAU Symposium, 220, 69
- de Blok & Bosma (2002) de Blok, W. J. G., Bosma, A. 2002, A&A, 385, 816
- de Blok & McGaugh (1997) de Blok, W. J. G., McGaugh, S. S. 1997, MNRAS, 290, 533
- de Blok et al. (2001a) de Blok, W.J.G., McGaugh, S.S., Rubin, V.C. 2001, AJ, 122, 2396
- de Blok et al. (2001b) de Blok, W. J. G., McGaugh, S. S., Bosma, A., & Rubin, V. C. 2001, ApJ, 552, L23
- de Blok et al. (2003) de Blok, W. J. G., Bosma, A., & McGaugh, S. 2003, MNRAS, 340, 657
- Fukushige et al. (2004) Fukushige, T., Kawai, A., & Makino, J. 2004, ApJ, 606, 625
- Ghigna et al. (2000) Ghigna, S., Moore, B., Governato, F., Lake, G., Quinn, T., & Stadel, J. 2000, ApJ, 544, 616
- Hayashi et al. (2004) Hayashi, E., Navarro, J.F., Power, C., Jenkins, A., Frenk, C.S., White, S.D.M., Springel, V., Stadel, J., Quinn, T.R. 2004, MNRAS, 355, 794
- Jing et al. (1995) Jing, Y. P., Mo, H. J., Borner, G., & Fang, L. Z. 1995, MNRAS, 276, 417
- Klypin et al. (2001) Klypin, A., Kravtsov, A. V., Bullock, J. S., & Primack, J. R. 2001, ApJ, 554, 903
- McGaugh et al. (2001) McGaugh, S. S., Rubin, V. C., & de Blok, W. J. G. 2001, AJ, 122, 2381
- Moore et al. (1998) Moore, B., Governato, F., Quinn, T., Stadel, J., & Lake, G. 1998, ApJ, 499, L5
- Moore et al. (1999) Moore, B., Ghigna, S., Governato, F., Lake, G., Quinn, T., Stadel, J., & Tozzi, P. 1999, ApJ, 524, L19
- Navarro, Frenk & White (1996) Navarro, J.F., Frenk, C.S., White, S.D.M. 1996, ApJ, 462, 563
- Navarro, Frenk & White (1997) Navarro, J.F., Frenk, C.S., White, S.D.M. 1997, ApJ, 490, 493
- Navarro et al. (2004) Navarro, J. F., et al. 2004, MNRAS, 349, 1039
- Power et al. (2003) Power, C., Navarro, J. F., Jenkins, A., Frenk, C. S., White, S. D. M., Springel, V., Stadel, J., & Quinn, T. 2003, MNRAS, 338, 14
- Riess et al. (1998) Riess, A. G., et al. 1998, AJ, 116, 1009
- Swaters et al. (2003) Swaters, R. A., Madore, B. F., van den Bosch, F. C., & Balcells, M. 2003, ApJ, 583, 732
- Wechsler et al. (2002) Wechsler, R. H., Bullock, J. S., Primack, J. R., Kravtsov, A. V., & Dekel, A. 2002, ApJ, 568, 52
| Name | Points | Ref. | |||
|---|---|---|---|---|---|
| (1) | (2) | (3) | (4) | (5) | (6) |
| F563-1 | 10 | 1.92 | 0.67 | 0.54 | M01 |
| ESO 4250180 | 11 | 24.94 | 0.25 | 4.31 | M01 |
| ESO 4880490 | 12 | 1.07 | 0.27 | 0.28 | M01 |
| ESO 3020120 | 12 | 1.72 | 0.62 | 0.48 | M01 |
| DDO 189 | 14 | 0.75 | 0.79 | 0.18 | dB02 |
| ESO 1870510 | 15 | 0.02 | 0.45 | 0.0011 | M01 |
| UGC 4115 | 15 | 0.36 | 0.87 | 0.064 | M01 |
| F568-3 | 16 | 43.27 | 0.13 | 5.99 | M01 |
| F583-1 | 17 | 15.12 | 0.43 | 3.14 | M01 |
| F571-8 | 19 | 93.60 | 0.10 | M01 | |
| F563-1 | 19 | 0.02 | 0.56 | 0.0011 | dB02 |
| UGC 11583 | 19 | 4.31 | 0.57 | 1.20 | M01 |
| ESO 1200211 | 19 | 2.09 | 0.45 | 0.59 | M01 |
| F583-4 | 19 | 19.67 | 0.13 | 3.72 | M01 |
| ESO 2060140 | 20 | 9.57 | 0.06 | 2.28 | M01 |
| UGC 11819 | 23 | 181.61 | 0.07 | M01 | |
| F730-V1 | 24 | 18.66 | 0.04 | 3.60 | M01 |
| UGC 4173 | 24 | 0.00 | 0.62 | 0.00 | dB02 |
| UGC 11616 | 26 | 105.32 | 0.05 | M01 | |
| DDO 47 | 26 | 0.05 | 0.91 | 0.0040 | dB02 |
| UGC 731 | 28 | 4.95 | 0.11 | 1.35 | dB02 |
| UGC 11454 | 28 | 218.96 | 0.05 | M01 | |
| UGC 5005 | 28 | 1.47 | 0.87 | 0.40 | dB02 |
| UGC 1230 | 34 | 20.27 | 0.31 | 3.79 | dB02 |
| UGC 628 | 37 | 8.92 | 0.05 | 2.17 | dB02 |
| DDO 185 | 42 | 19.23 | 0.44 | 3.67 | dB02 |
| UGC 10310 | 49 | 32.78 | 0.20 | 5.09 | dB02 |
| UGC 3371 | 57 | 11.68 | 0.57 | 2.63 | dB02 |
| NGC 3274 | 66 | 0.00 | 0.01 | 0.00 | dB02 |
| UGC 3137 | 72 | 24.17 | 0.15 | 4.23 | dB02 |
| NGC 4455 | 80 | 1.63 | 0.10 | 0.45 | dB02 |
| UGC 4325 | 84 | 76.41 | 0.24 | dB02 | |
| DDO 52 | 86 | 41.8 | 0.02 | 5.87 | dB02 |
| NGC 100 | 92 | 21.16 | 0.03 | 3.90 | dB02 |
| NGC 5023 | 149 | 95.96 | 0.01 | dB02 | |
| NGC 4395 | 355 | 23.51 | 0.01 | 4.16 | dB02 |
Note. — (1) Identification of galaxy. (2) Number of data-points in rotation curve. (3) needed to find solution with slope . (4) Ratio of area enclosed by 2 contour and total search area. (5) Confidence level of needed to find solution with steep slope. (6) Source of the data: dB02: de Blok & Bosma (2002); M01: McGaugh et al. (2001).