Introduction to Astrophysics of Microquasars
—————————————————————————————
Einführung in die Astrophysik der Mikroquasare
Habilitationsschrift
zur
Erlangung der Venia Legendi der Hohen Mathematisch-Naturwissenschaftlichen Fakulät
der
Rheinischen Friedrich-Wilhelms-Universität Bonn
vorgelegt von Dr. rer. nat. Maria Massi aus Rom
Bonn, im Dezember 2004
FOREWORD
This review was written to fulfill the requirements for the ”Habilitation” procedure at the University of Bonn. It summarizes a part of the research I have conducted over the last years in the field of microquasars and it should stimulate students’ interest in this challenging and fascinating topic.
The astronomical methods used in the range of gamma-rays, X-rays, optical and radio wavelengths are first reviewed and then, all of them, directly applied always to the same astronomical source, the periodic microquasar LS I +61∘303.
Reviewing the literature in that field, this presentation is of course biased towards my own contributions for the reason mentioned in the beginning. Therefore, I want to acknowledge here all colleagues working like me for years on LS I +61∘303, first of all the two discoverers of the source: P.C. Gregory and A.R. Taylor, but also D. Crampton and J.B. Hutching for the optical observations, F.A. Harrison, D.A. Leahy and M. Tavani for the high energy, K,M.V Apparao, and R.K, Zamanov for multiband studies, and of course all my collaborators: J.M. Paredes, M. Ribó, J. Martí, S. Garrington and M. Peracaula.
Maria Massi, December 2004
CONTENTS
1. Introduction……………………………………………………………………………………………….4
2. The Accretion-Ejection Process……………………………………………………………………8
2.1 Accretion……………………………………………………………………………………………….8
2.2 Magnetohydrodynamic Jet Production……………………………………………………….9
2.3 Strong Magnetic Fields: The X-Ray Pulsars………………………………………………11
3. Optical Observations…………………………………………………………………………………12
3.1 The Nature of the Compact Object……………………………………………………………12
3.2 The Nature of the Companion Star……………………………………………………………13
3.3 LS I +61∘303 : The Be Star …………………………………………………………………….14
3.4 LS I +61∘303 : Really a Neutron Star ?……………………………………………………..17
4. X-Ray and Radio Observations…………………………………………………………………..17
4.1 High/Soft State and Multicolor Disk………………………………………………………..19
4.2 The Disk-Jet Connection………………………………………………………………………..21
4.3 LS I +61∘303 : Soft and Hard X-Ray States………………………………………………29
4.4 The Periodical Radio Outbursts of LS I +61∘303 ……………………………………….34
5. Theory of Accretion: The Two-Peak Accretion Model…………………………………..35
6. Gamma-Ray Observations…………………………………………………………………………38
6.1 EGRET Sources……………………………………………………………………………………38
6.2 the Variable Gamma-ray Source LS I +61∘303 ………………………………………….40
7. Radio Interferometry: Imaging at High Resolution………………………………………..42
7.1 The Jet Velocity……………………………………………………………………. ………………42
7.2 The Precessing Relativistic Jet of LSI+61303…………………………………………….44
8. Conclusions……………………………………………………………………………………………..50
9. Summary………………………………………………………………………………………………….52
10. Zusammenfassung…………………………………………………………………………………..54
11. Appendix……………………………………………………………………………………………….57
12. References……………………………………………………………………………………………..59
13. Danksagung……………………………………………………………………………………………69
1 INTRODUCTION
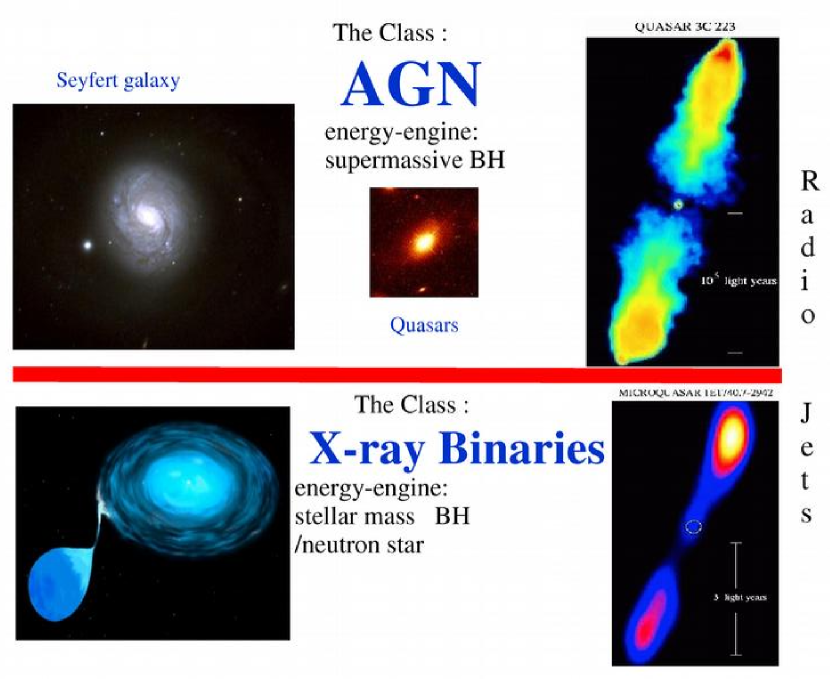
Since the beginning of the 1980s objects like radio-galaxies, quasi-stellar radio sources (Quasars), Seyfert Galaxies are simply classified as Active Galactic Nuclei (AGN), because the “energy-engine” is thought to be the same for all of them: A super-massive black hole of millions of solar masses accreting from its host galaxy (Fig. 1). AGN with radio-emitting lobes or jets are called radio-loud, the others radio-quiet (Ulrich et al. 1997).
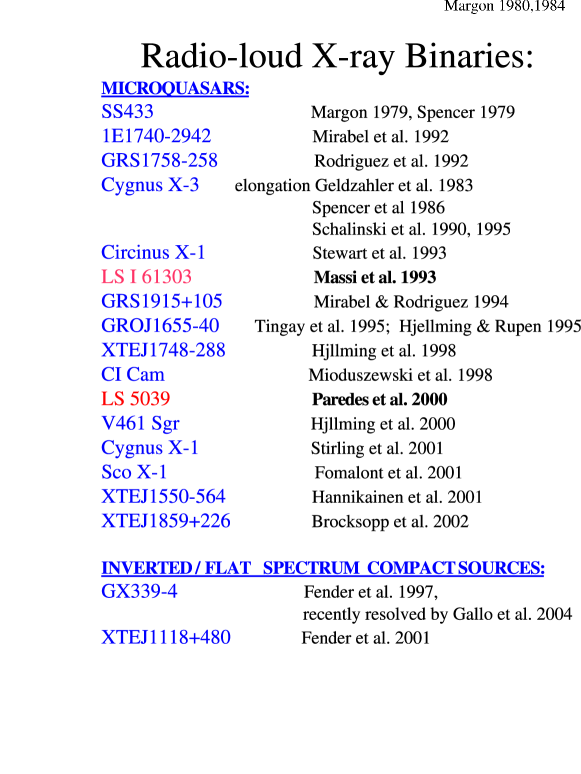
The class of X-ray binary systems is very similar, the “energy-engine” is a compact object of only a few solar masses accreting from the companion star (Fig. 1). Up to now there are known 280 X-ray binary systems (Liu et al. 2000, 2001), but only 18 of them (Fig. 2) show evidence of a radio-jet and therefore are radio-loud applying the same definition as for the AGN.
The radio-loud subclass of X-ray binary systems includes together with the microquasars – objects where high resolution radio interferometric techniques like VLBI have given direct evidence of the presence of collimated and relativistic jets (Mirabel et al. 1992) – also unresolved radio sources with a flat spectrum, which give indirect evidence for continuous ejection.
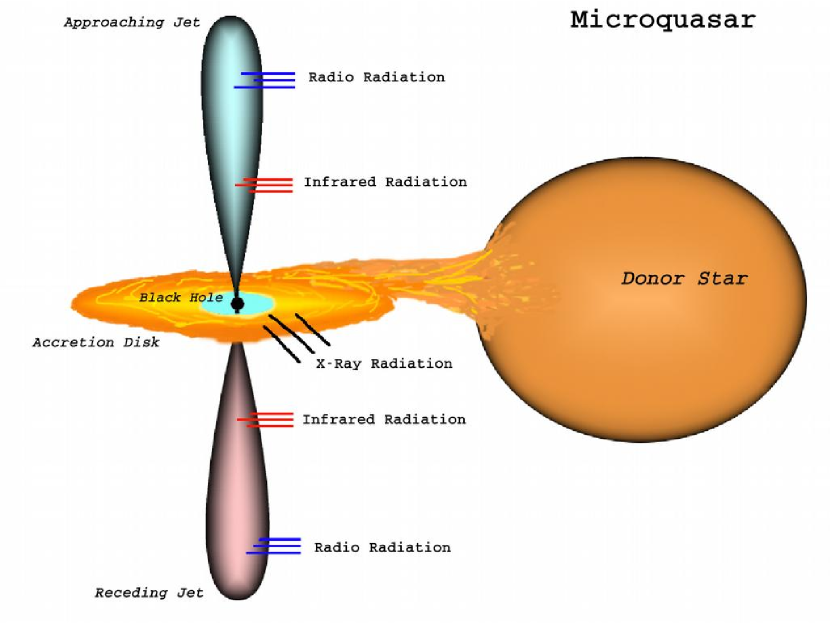
I here review how the three important basic components of a microquasar (Fig. 3) - a compact object, an accretion disk and a collimated relativistic jet - have been observed in gamma-rays, X-rays, optical and radio emission. After a basic introduction of the accretion-ejection processes presented in section 2, the following sections describe the astronomical methods: First, presenting their theory and, afterwards their application on the source LS I +61∘303. In detail: Optical observations, reported in Sect. 3, reveal the nature of the compact object: Neutron star or black hole. X-ray observations, discussed in Sect. 4, deliver information on the accretion disk, while radio observations allow to study the jet; the section describes how the simultaneous use of X-ray and radio tools allow to study ”the disk-jet” connection. The application to LS I +61∘303 shows the limits of an approximation of the accretion theory which assumes a constant velocity of the accretor along the orbit. Section 5 shows that the observational results can be explained if one takes into account the geometry of the orbit. The better understanding of the physical processes motivates for new observations at higher energy. Gamma-ray observations are discussed in Sect. 6. The characteristics of the jet (morphology, velocity, etc) are derived from high resolution radio-astronomical observations and their typical procedures are described in Sect. 7. Finally, the conclusion of this multiband approach applied on LS I +61∘303 are presented in Sect. 8
2 THE ACCRETION-EJECTION PROCESS
2.1 Accretion
X-ray binaries are stellar systems formed by two stars of a very different nature: A normal star (acting as a mass donor) and a compact object (the accretor) that can either be a neutron star or a black hole (White et al. 1996).
Several mechanisms have been proposed to explain the presence of a compact object in a binary system, and they principally depend on the mass of the companion. If the companion is a low mass star (Low Mass X-ray Binary, LMXB) the theory assumes, first, the formation of the neutron star/BH, which later coupled with its companion in a (tidal) capturing process. As a matter of fact several LMXB are close to the core of globular clusters or near the center of the Galactic bulge (Verbunt & van den Heuvel 1996). The High Mass X-ray Binary (HMXB) systems, where the companion has a mass above 5, have a galactic disc distribution characteristic that of young stars (population I). It is assumed that large scale mass transfer has occurred in the system before the supernova explosion: When the progenitor star of the compact object had evolved to a Red Giant and had filled its Roche lobe, the smaller companion accreted from it to a level that it survived after the explosion. In most HMXRB systems the massive companion of the compact object is a rapid rotating Be star, whose formation is explained by the large amount of angular momentum received together with matter from the initially more massive and therefore faster evolving companion (Verbunt & van den Heuvel 1996).
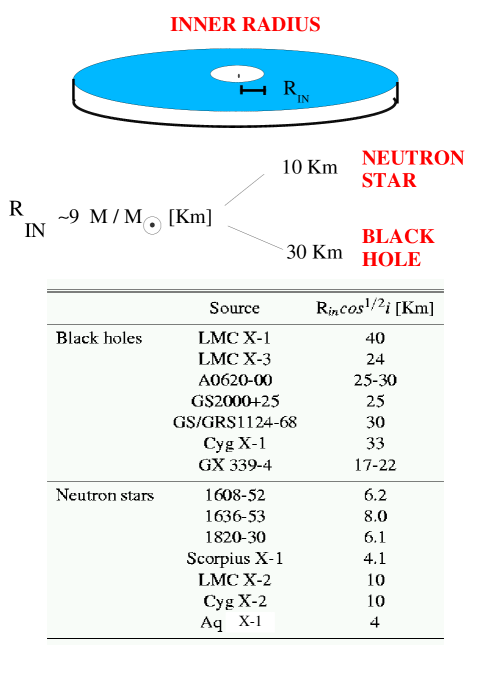
Since the binary pair is in orbital motion around the common center of gravity, the matter leaving the companion star has some angular momentum (), which prevents it from directly falling into the accretor. The stream of matter orbits the compact object with a radius determined by and the mass of the compact object (). The angular momentum is redistributed by the viscosity: Some of the material takes angular momentum and spreads outwards, whereas other material spirals inwards. In this way a disk is created from the initial ring of matter (King 1996; Longair 1994 p. 135). Gradually the matter drifts inwards until it reaches the last stable orbit, called “the inner radius” of the accretion disk (), which for a non rotating black hole is approximately three times the Schwarzschild radius ():
| (1) |
| (2) |
The viscosity has two effects: Besides the transport of angular momentum it also acts like a frictional force resulting in the dissipation of heat. The amount of friction depends on how fast the gas orbits around the compact object; the temperature () reaches its maximum at the inner disk where it rises up to (Longair 1994 p. 141)
| (3) |
On the basis of this equation we see that for a microquasar of about 1 solar mass the matter around the last stable orbit is heated up to tens of million degrees therefore emitting predominantly in the X-ray band. This led to the name ‘X-ray binaries’ for this class of objects. The Earth´s atmosphere is opaque at these wavelengths; therefore it is understandable that there was an impasse (until recent developments in X-ray astronomy) in discovering such stellar sources and (besides SS433 discovered by chance) their subclass with relativistic jets. On the contrary, the temperature of the last stable orbit around a super massive black hole of an AGN with a mass of is . Therefore the emission is in the ultraviolet band causing the ”blue bump” associated with the ”visible” Quasars. This last fact is an example that the same laws are applied to both, AGN and X-ray binaries, deriving parameters only scaled with the mass (see Heinz & Sunyaev 2003; Merloni et al. 2003; Falcke et al. 2003).
The accretion luminosity can be written as:
| (4) |
where , the efficency of energy conversion, expresses here how compact an object (with radius ) is: (Longair 1994 p. 134). Whereas for a white dwarf is only 0.0001, for neutron stars is 0.1. As a comparison, the release of nuclear binding energy occuring in the conversion of four protons into helium has an . Thus, accretion in neutron stars already is an order of magnitude more efficient as an energy source as compared with nuclear energy generation (Longair 1994 p. 134).
However, there is a limit of energy that is possible to extract by accretion: If the force generated in the accretion disk by radiation pressure exceeds the gravitational force of the compact object a further accretion of gas ceases. The expression for that luminosity limit, the Eddington luminosity, is (Longair 1994 p. 137; Frank et al. 2002)
| (5) |
2.2 Magnetohydrodynamic Jet Production
In the case of a small vertical magnetic field threading the disk the plasma pressure dominates the magnetic field pressure and the differentially rotating disk bends the magnetic field lines, which are passively wound up (Fig. 4) (Meier et al. 2001).
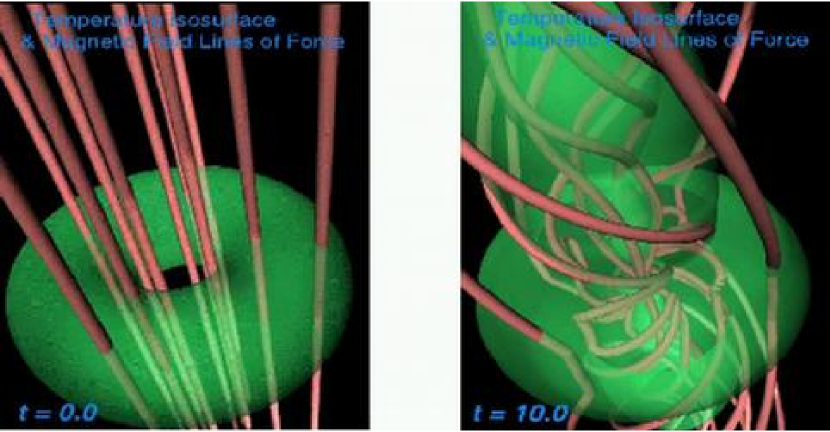
Due to the compression of the magnetic field lines the magnetic pressure may become larger than the gas pressure at the surface of the accretion disk, where the density is lower. At this point the gas starts to follow the twisted magnetic field lines, creating two spinning flows. This extracts angular momentum (magnetic braking) from the surface of the disk and enhances the radial accretion. The avalanching material further pulls the deformed magnetic field with it and afterwards magnetic reconnection may happen (Matsumoto et al 1996). The flux tubes open up and reconnect as is known from stellar flares (Massi et al. 2002).
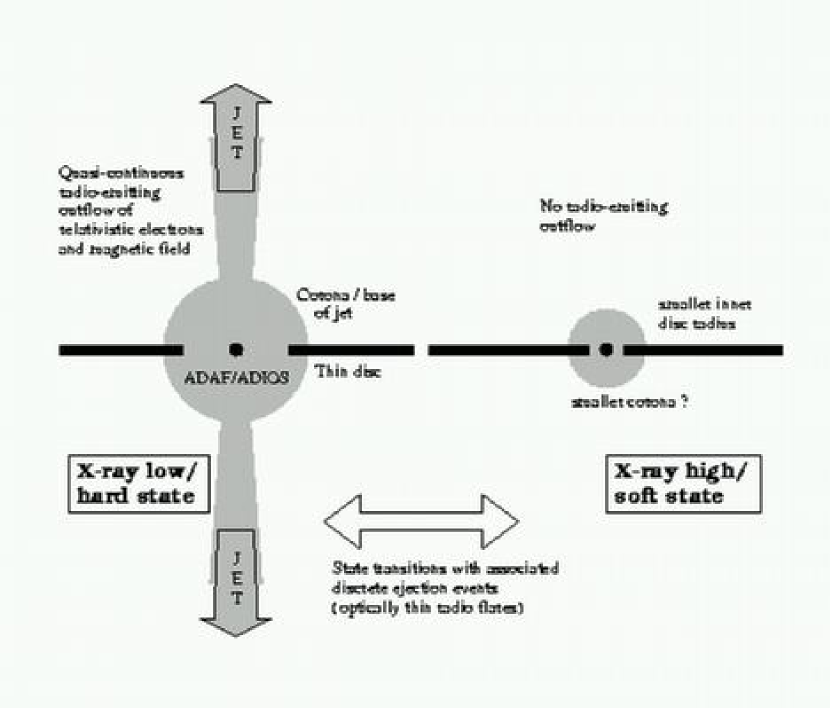
The thickness of the disc is a fundamental parameter in this magneto-rotational process, or better the extent of the poloidal magnetic field frozen in the disc (Meier 2001; Meier et al. 2001; Maccarone 2004). No radio jet is associated with X-ray binaries in High/Soft states (Sect. 4.1), where the X-ray spectrum is dominated by a geometrically thin (optically thick) accretion disc (Shakura & Sunyaev 1973). In the contrary numerical results show a jet being launched from the inner geometrically thick portion of the accretion disc that is present (ADAF/Corona) when the X-ray binaries are in their Low/Hard state (Sect. 4.2) (Meyer et al. 2000; Meier 2001).
In conclusion, a better understanding of the transition from radio-quiet to radio-loud therefore seems to be possible through a better understanding of the X-ray states and their switch mechanism.
2.3 Strong Magnetic Fieds: the X-Ray Pulsars
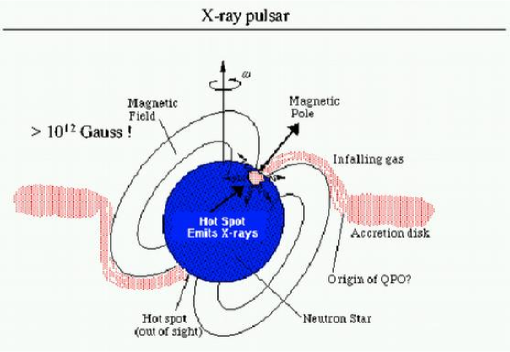
A radio-loud X-ray binary system may contain either a black hole or a neutron star with a low ( Gauss) magnetic field. Accreting neutron stars with a low magnetic field can give rise to jet production because of the following reason: As described in the previous section only for a low magnetic field can the plasma pressure dominate and bend the field. On the contrary, jet formation is prevented in presence of a strong magnetic field. In the case of B Gauss, the plasma is forced to move along the magnetic field lines, converges onto the magnetic poles of the neutron star and there releases its energy creating two X-ray emitting caps that, in case of a misalignment of the rotation and the magnetic axis, produce X-ray pulses (Fig. 5). X-ray pulsars are not associated with microquasars. The lack of detected radio emission from X-ray pulsar systems is discussed in Fender et al. (1996).
3 OPTICAL OBSERVATIONS
3.1 The Nature of the Compact Object
The most reliable method to determine the nature of the compact object is the study of the Doppler shift of absorption lines in the spectrum of its companion. The study of the changing radial velocity during the orbital motion is a technique that has been applied for more than one hundred years to measure the masses of stars in binary-systems. The same method is applied for systems like X-ray binaries, where one component is ”invisible”. In this case the variations of the radial velocity of the normal companion during its orbit are studied.
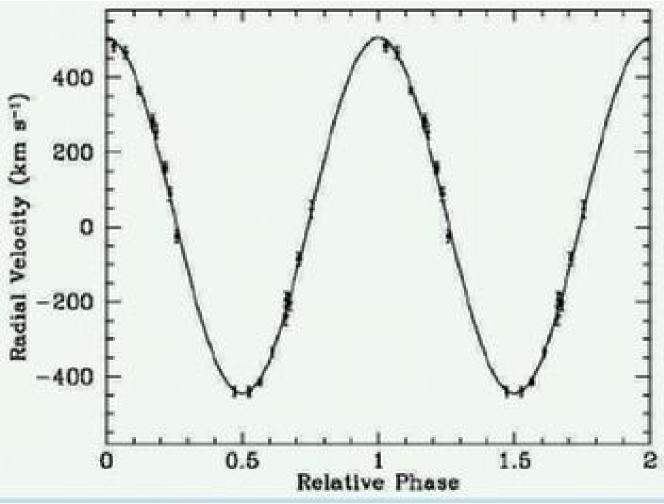
The amplitude ( ) of the radial velocity variations (Fig. 6) of the mass donor and the period (Porb) of the system applying Newton´s/Kepler’s third law define a quantity called the “mass function” (Charles & Wagner 1996), which is equal to:
where and are the masses of the compact object and of the companion, respectively, is the angle between the axis of the orbit and the line of sight and is the gravitational constant.
The mass function alone already provides a lower limit for corresponding to a zero-mass companion (=0) viewed at the maximum inclination angle (i=90∘). In the cases where the inclination and the mass of the companion are known one can solve for the mass of the invisible object.
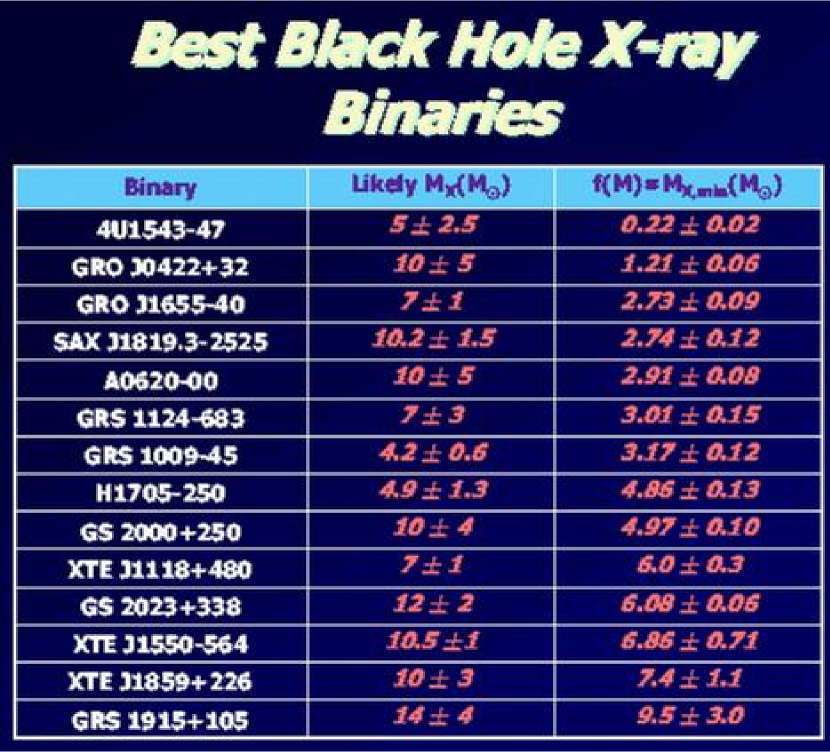
Rhoades & Ruffini (1974), taking the most extreme equation of state that produces the maximum critical mass of a neutron star, established the very upper limit of 3.2 for a neutron star. This absolute maximum mass provides a decisive constraint to observationally distinguish between neutron stars and black holes.
In Fig. 7 a list of some X-ray binaries is given for which both mass function and is available. All sources below GRS 1009-45, with , can be defined black hole candidates on the basis of the mass function alone. On the contrary, for cases where the determination of inclination and mass of the companion is mandatory to determine the type of object.
It is worth mentioning here that the accumulation of accreted material on the surface of a neutron star triggers thermonuclear bursts (see typical profile in Fig. 8). These are called bursts of Type I. No Type I burst has ever been observed from a compact object where optical observations resulted in a mass above 3 . That fact might confirm that in black holes there is no surface where material can accumulate (Narayan & Heyl 2002). In conclusion: Observations of Type I bursts give a direct evidence for the existence of a neutron star.

.
3.2 The Nature of the Companion Star
The classification of the X-ray binaries into Low Mass X-ray Binary and High Mass X-ray Binary systems leaves unspecified the nature of the accreting object and is based on the mass of the companion star (van Paradijs & McClintock 1996).
A LMXB contains a late type (K,M) low mass donor star. The mass transfer takes place via Roche lobe overflow (Frank et al. 2002): Material streams through the inner Lagrangian point and will orbit the compact object at the radius determined by its specific angular momentum.
In HMXB systems, the companion is an OB star. OB stars have a substantial stellar wind (mass loss rates ) with a velocity of km/s. However, matter leaves the star in all directions, not only towards the accretor as in the case of Roche lobe overflow. This accretion therefore is less efficient (King 1996). The expression for the accretion rate is (Bondi 1952):
| (6) |
where is the density, and depends on the velocity along the orbit and on the wind velocity (). The accretion therefore becomes more efficient for denser and slower winds present in Be stars. In these rapidly spinning stars together with a high velocity (1000 km s-1) low density wind at high latitudes there also exists a dense and slow (100 km s-1) disk-like wind around the equator having a power law density distribution (Waters et al. 1988).
3.3 LS I +61∘303: The Be-Star
The ultraviolet spectroscopy of LS I +61∘303 by Hutchings & Crampton (1981) indicates that the primary star is a main sequence B0-B0.5 star (L erg sec-1, TK). Its distance is 2.00.2 Kpc (Frail and Hjellming 1991). The optical spectrum is that of a rapidly rotating star with V i = 360 25 km s-1. The critical rotational velocity for a normal B0 V star is 600 km s-1 and Be stars may rotate at a velocity that does not generally exceed 0.9 of this, i.e. 540 km s-1 (Hutchings et al. 1979). Therefore the lower limit for the inclination of the orbit compatible with these data is 38∘. However, Hutchings & Crampton observed shell absorptions in the strong Balmer and He I lines. For a disk sufficiently flat this corresponds to a large inclination angle (i ) (Kogure 1969). The result is a range of 38∘–90∘ for the inclination of the orbit for LS I +61∘303 .
LS I +61∘303 is the only X-ray binary system showing variations compatible with the orbital period at X-rays (Paredes et al. 1997; Leahy 2001), at Gamma-rays (Massi 2004; Massi et al. 2004b), at optical wavelengths in both continuum (Maraschi & Treves 1981; Paredes & Figueras 1986; Mendelson & Mazeh 1989) and lines, (Zamanov & Martí 2000; Liu et al. 2000; Apparao 2000). The most accurate value for the orbital period is however from radio astronomical measurements resulting in 26.4960 0.0028 days (Gregory & Taylor 1978; Taylor & Gregory 1982; Gregory 2002).
The range of the mass for a B-star is 5–18 M. Fits performed on near infrared data by Martí and Paredes (1995) result in an eccentricity of e 0.7-0.8 and mass in the range 10–18 M.
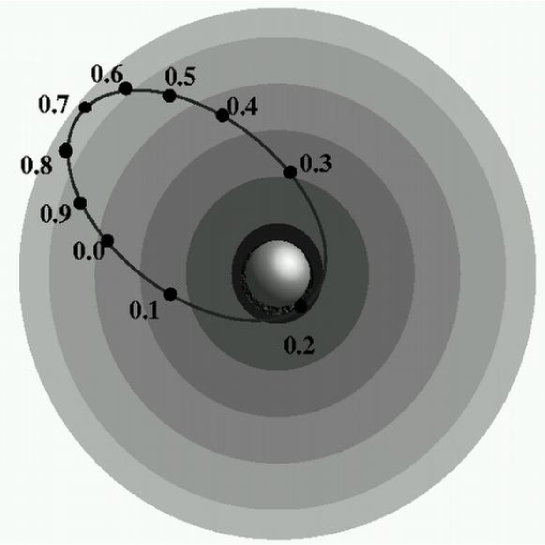
Finally, because of the high eccentricity, an important parameter of the system is the phase at the periastron passage, already determined by Hutchings & Crampton (1981) and very recently confirmed by Casares et al. (2004) to be =0.2. The zero phase by convention refers to the date t0=JD 2443366.775, the date of the first radio detection of the system (Gregory & Taylor 1978).
Figure 9 shows a sketch of the system with the compact object travelling (and accreting) through the dense, variable and structured wind of the Be-star along the quite eccentric orbit.
3.4 LS I +61∘303: Really a Neutron Star ?
The composite and variable nature of the spectral features of LS I +61∘303, its long period and its high eccentricity make it difficult to derive meaningful radial velocities for this source. The observations of made by Hutchings & Crampton (1981) imply a mass function in the range 0.00280.043 (see also Punsly 1999). Following the discussion in section 3.1 we see that the low value of the mass function is not enough to establish the real nature of the compact object. Knowledge of the values for inclination and mass of the companion star also is necessary for that. On the other hand, we have seen in the previous section that the inclination has a quite large range (38∘-90∘) and the possible range for the mass (M) of the companion can be 10–18 M.
Hutchings & Crampton (1981) have assumed =0.02, an inclination of about 70∘ (=0.8) and M=10 M and derived MX=1.2 M. For this reason in the literature it has generally been assumed that the compact object in LS I +61 is a neutron star. Only Punsly (1999) discussed the possibility that the compact object in LS I +61 could be a black hole and he presented a model for the high-energy emission based on it.
As discussed above and also in Massi (2004) the uncertainties in the parameters derived by optical measurements are rather large; changing the inclination to i=38∘ we already get MX=2.5 M. If we assume a value M=18 M we obtain MX=3.4 M. Recently Casares et al (2004) have determined an upper limit of =0.027 which would correpond to MX=3.8 M (Massi et al. 2004b). In conclusion: Accounting for the uncertainties in inclination, the mass of the companion and the mass function it cannot be ruled out that the compact object in LS I +61∘303 is a black hole.
4 X-RAY AND RADIO OBSERVATIONS
An X-ray binary system is called transient, if at least one outburst occurs with a flux variation of more than 2-3 orders of magnitude greater than the normal flux (McClintock & Reimmllard 2004). This outburst, which may last for days to months, is directly related to a variation of the accretion disk and therefore is distinct from the outburst of Type I discussed in section 3.1 which lasts a few seconds.
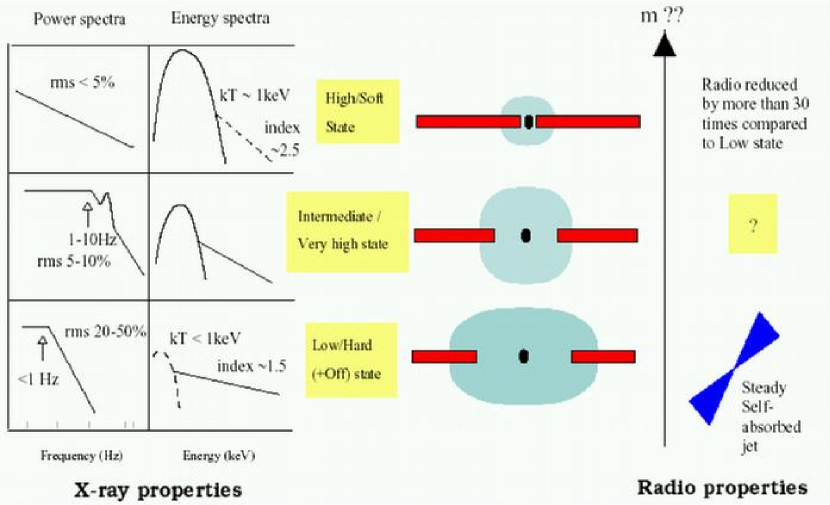
Generally Microquasars have been discovered through high resolution radio observations immediately performed during new transients. However, LS 5039 was discovered (Paredes et al. 2000) on the basis of a cross-identification in catalogs (in optical, radio, X- and Gamma-rays) without any X-ray outburst calling attention to it. Nowadays one observes changes in the X-ray ”states” (Fig. 10). These states are defined by spectral (see below) and timing characteristics (van der Klis 2004): As soon as an X-ray binary is discovered in a ”Low/Hard state”, it immediately is observed at radio wavelengths with high-resolution techniques.
4.1 High/Soft State and Multicolor Disk
X-ray binaries with a neutron star as compact object may have spectra that are completely different depending on whether the magnetic field of the neutron star is strong or weak.
The form of the spectrum of a binary X-ray pulsar, with a surface magnetic field G is a flat hard power-law function with a sharp cut-off above a few tens of keV (Tanaka 1997; White et al. 1996).
The spectrum of an X-ray binary with a weakly magnetized neutron star is typically formed by the properties of the accretion disk and the neutron star envelope. The neutron star envelope contributes to the harder part of the spectrum and has a temperature of 2.5 keV. Mitsuda and collaborators (1984), assuming an optically thick disk, where the energy generated by viscosity is locally dissipated in blackbody radiation, have represented the disk spectrum as a superposition of spectra with temperatures varying from a low value Tout at the outer edge to a maximum Tin at the inner edge (i.e. at the the inner radius ) of the disk. This is the reason why the disk is generally called a multi-temperature or multi-color disk. By means of this model Tin and can be determined through the softer part of the observed spectrum (), which is represented by:
| (7) |
here is the inclination angle of the disk, is the distance and is the Planck function (Shakura & Sunyaev 1973; Mitsuda et al. 1984; van Paradijs & McClintock 1996; Tanaka 1997).
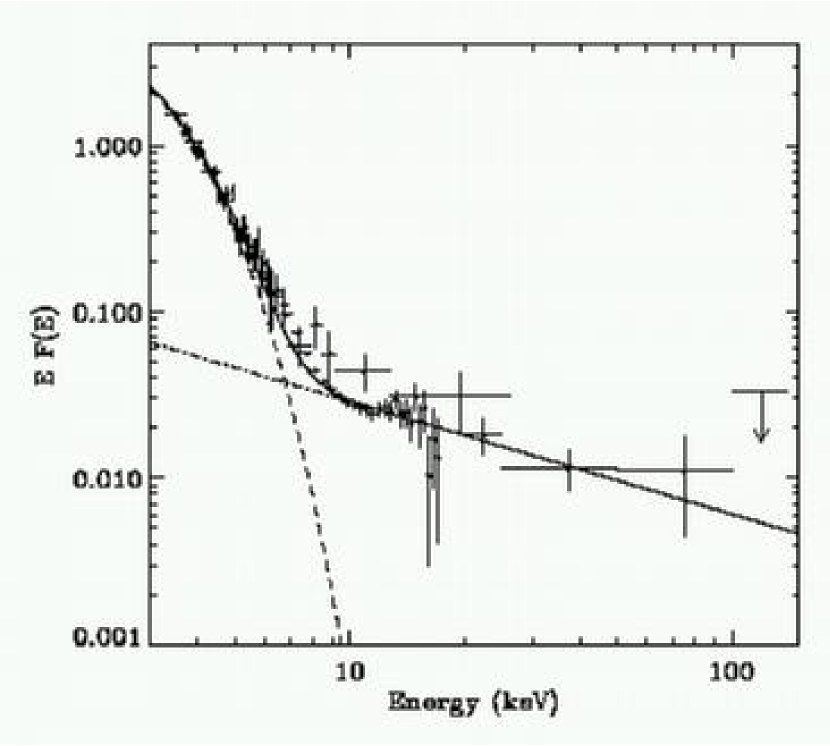
X-ray binaries known to contain a black hole, proved by measurements of the mass function resulting in a mass 3 M⊙, have spectra with a soft component accompanied by a hard power-law tail (Tanaka 1997). The soft component is described by the multicolor blackbody spectrum given above and therefore it is associated with the accretion disk around the black hole. This X-ray state is defined: High/Soft. In this respect it is quite interesting to compare the different values for Tin and derived in the two cases of neutron stars and black holes (Tanaka 1997). In Fig. 11 the values of R obtained from the fits for accretion discs around black holes and neutron stars are collected: The projected inner radius Rin of accretion disks around neutron stars always results in values of 10km, while the values for black hole binaries all are larger by a factor of 3-4 than those for neutron stars. This shows that these compact objects are indeed more massive than 3 as expected following the relationship (Eq. 2).
The temperature Tin for disks around black holes is always found to be less than 1 keV, significantly lower than that for disks around neutron stars with similar luminosities. Also this difference is understood in terms of the difference in the mass MX of the compact object: keV (Eq. 3).
No blackbody component is present in the X-ray spectra of black hole X-ray binaries, which is consistent with the absence of a solid surface in a black hole. The second spectral component in black holes in the High/Soft state is a weak power-law with spectral index , defined by the photon flux E-Γ (Fig. 13). A photon index of 2.0-2.5 has been determined by Tanaka (1997) for a sample of 5 black holes. Esin and collaborators quote a range from 2.2 to 2.7. The recent review by McClintock and Remillard (2004) gives a photon index ranging from 2.1 to 4.8 for 10 black holes.
The power law component in the X-ray spectra of accreting black holes in their High/Soft state is generally interpreted as the result of inverse Compton up-scattering of low-energy disc photons by electrons with a power-law or at least a hybrid distribution (consisting of both thermal and non-thermal electrons) that can be located in coronal regions (possibly flaring) above the disc (Coppi 2000; Zdziarski et al. 2001).
Evidence for the existence of an accretion disc corona comes from systems seen almost edge on: The strong central X-ray source (i.e. the inner disc) remains hidden behind the disc rim, but X-rays are still seen. The source of emission must be quite extended because the eclipse by the companion star is only partial (White et al. 1996). The origin of accretion disc coronae is described by buoyancy of magnetic fields amplified in the disk (see Miller & Stone 2000 and references therein).
4.2 The Disk-Jet Connection
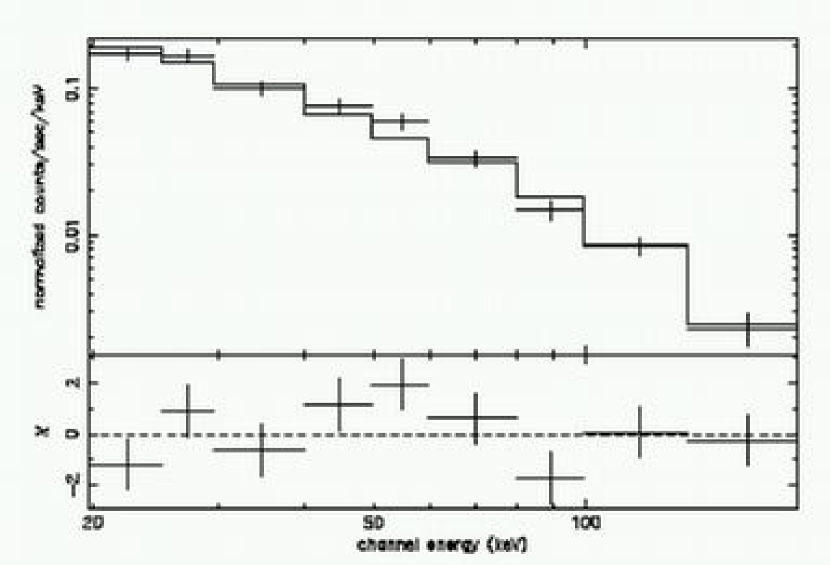
Both X-ray binary systems containing weakly-magnetized neutron stars and those containing black holes change their spectral shapes (Tanaka 1997). The most drastic change is a transition from a spectrum with the accretion disk component as that discussed in the previous section (Fig. 13), to a spectrum without it and showing a single power-law component (Fig. 13).
In the sample discussed by Tanaka (1997) the photon index () in this state varies in the range from 1.4 to 1.7 for systems containing black holes and is equal to 1.8 for systems with neutron stars. Esin and collaborators (1998) quote the range from 1.4 to 1.9. McClintock and Remillard in their recent review (2004) give =1.5–1.9 (excluding GRS 1915+105) for 9 black holes. In conclusion, the power law in this state is definitely less steep than in the High/Soft state. This spectral state, present also in systems with neutron stars, is defined in the literature as Low/Hard only for systems with black holes.
It has been established that when an X-ray binary system is radio-loud and in particular with a flat or inverted radio spectrum (i.e. spectral index with flux density ) then it is always in its Low/Hard state (Fender 2004 and references therein). Emissions in the radio band and at hard X-rays are related by: ( Corbel et al 2003; Gallo et al. 2003).
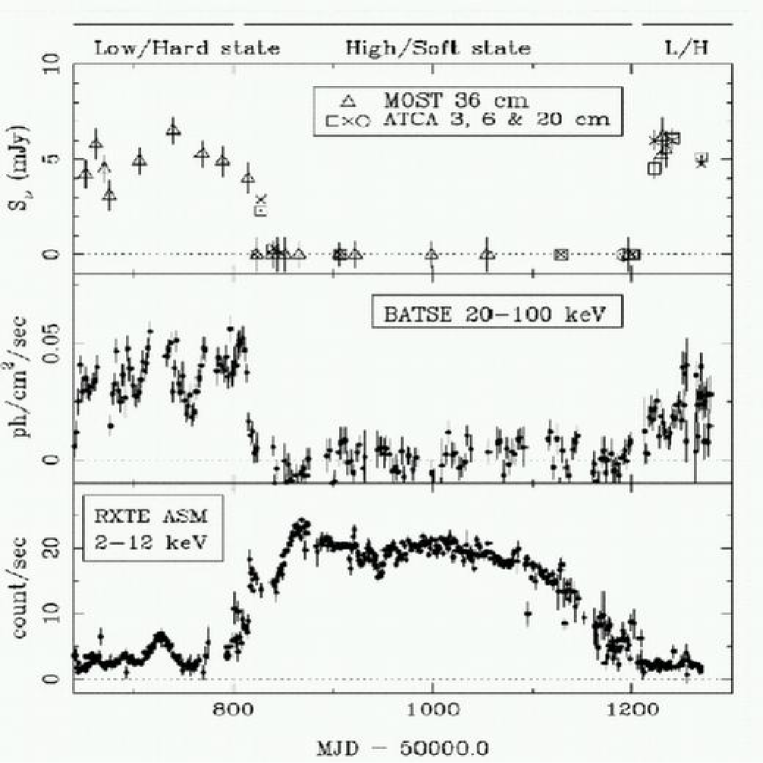
Figure 14 shows a multiband monitoring of GX 339-4. At the beginning of the observations both radio emission and hard-X ray emission (Hard/Low state) are present, whereas the emission in the softer X-ray band is quite weak. When the system switches to the High/Soft state, then both radio and hard X-ray emission become quenched.
Finally, as GX 339-4 switches again into its Low/Hard state, radio emission is again observed (Fender et al. 1999). From the plot it is clear that the radio and the hard X-ray fluxes are strongly anticorrelated with the soft X-rays.
As stated above the radio emission during a Low/Hard state has a spectrum which is flat or inverted.

As shown in the sketch of Fig. 15 one can imagine a continuous jet in adiabatic expansion (conical jet) as formed by contiguous cylinders of increasing radii and decreasing Bi. With each cylinder a canonical synchrotron spectrum is associated with an optically thin part (where is the electron energy index) and an optically thick part , with the two parts of the spectrum joining around (van der Laan 1966; Dulk 1985). Hence, the composite spectrum in case of a prolongated emission will have an optically thin part (that of cylinder 1) and a thick part (cylinder 3) at the two opposite ends, but will also develop a central part with an intermediate or even flat slope (Torricelli et al. 1998; Massi 1999). A flat spectrum therefore reveals a continuous jet. That has observationally been proven by direct imaging a radio jet in Cyg X-1 during its Low/Hard state (Stirling et al. 2001).
With sufficient sensitivity in the range of a few tenths of keV in the Low/Hard state it has been possible to observe a second component due to the accretion disc and therefore to measure the inner disk radius. The resulted to be (McClintock et al 2001b; McClintock & Remillard 2004). In the High/Soft state (sect. 4.1 and Fig. 11), the measured inner radius of the accretion disk corresponds to . Either the inner disk has been removed or during the transition High/Soft to Low/Hard the inner part of the disk has made a transition to a cooler state, which makes it effectively invisible in X-rays. The transition from a soft thermal state to a hard power-law state therefore corresponds to a change in the disk structure, evolving from a state mainly characterized by the emission from the inner part of the disk to a state, in which this inner-most region has been strongly modified (Tanaka 1997; Belloni et al. 1997). Since the magneto-hydrodynamic theory of jet production (Sec. 2.2) assumes a large vertical magnetic field component, the inner-most region is expected now to be geometrically thick and therefore strongly different from the geometrically thin (optically thick) case of the High/Soft state. However, how in detail is the space within the inner radius filled? What is the origin of the power law emission in the Low/Hard state and why is it so well correlated to the radio emission? This all is still matter of debate (Fig. 16) (see the reviews by McClintock & Remillard 2003 and Fender 2004).
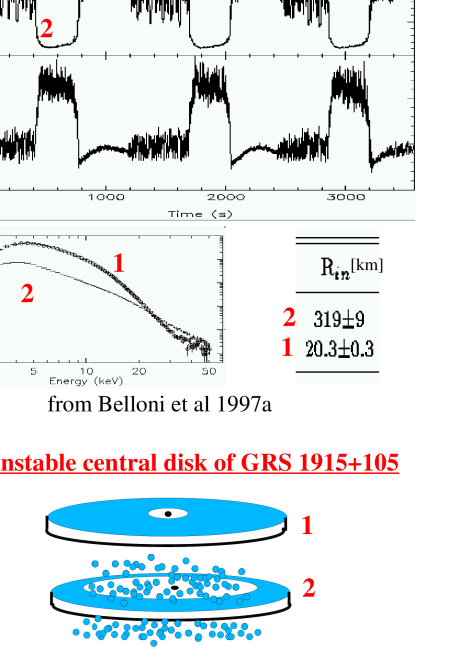
Together with the two extreme states High/Soft (radio quiet) and Low/Hard (continuous ejection) there are two intermediate (concerning their hardness) states: the Very High State (VHS) and the Intermediate State (IS). Multiple recurrent oscillations in X-rays in the source GRS 1915+105 (Belloni et al. 2000) are due to different VHS-like states called A,B and C, where ejections- emitting in the radio band - occur in the hardest (C) state (reaching a Low/Hard state with ). Synchronized variations of the inner radius have been observed to occur during this oscillations (Belloni et al. 1997,1997b). Figure 17 shows the spectral change corresponding to a variation of from 20 km (value compatible with the last stable orbit around a rotating black hole) to more than 300 km.
During similar episodes of cyclic variations of the inner disk in GRS 1915+105, Mirabel and collaborators (1998) could follow the onset of a flare - first at infrared wavelenghts and then at radio wavelengths - with a delay consistent with synchrotron radiation from expanding magnetized clouds of relativistic particles (Fig.18). The straightforward interpretation was that during the disappearance of the inner disk a relativistic plasma cloud was expelled.
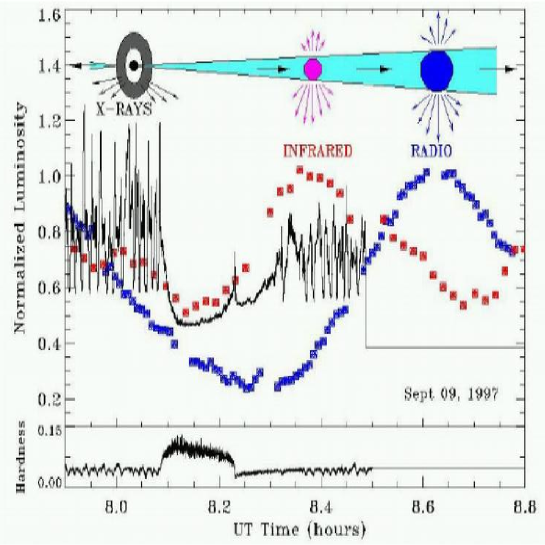
The mass of the ejected cloud has been estimated to g (Mirabel 1998), while the matter which disappeared from the inner disk in one dip of similar time length (Belloni 1997), has been estimated to g. This fact could imply that only a very small fraction of the mass is ejected, whereas is not clear which fraction fell indeed onto the compact object (Mirabel and Rodriguez 1999).
These small oscillations are now well established, they have recurrence time-scales of tens of minutes and have been observed in X-ray (interpreted as possible draining and refilling of the inner disk) and at infrared, millimeter and radio wavelengths (interpreted as repeated ejection events) (Fender et al. 1999: Eikenberry et al. 1998; Fender et al. 2002). Finally, Fender and coauthors (1999: 2002) have shown that these low ( 40 mJy in radio) amplitude oscillations can happen during the decrease of flux in major flare events.
In conclusion:
-
1.
A Soft state, characterized by disk emission (at temperatures 1 keV contributing mostly at 1-2.5 kev) and a power law component steeper than implies a radio-quiet X-ray binary system.
-
2.
Quasi-periodic oscillations with time-scales of several minutes in X-ray and in the infrared or radio band are a signature of episodic disk-removal/variations and plasma bubble ejection. In case of such isolated small ejections, one can follow the adiabatic expansion of the cloud and monitor radiation becoming optically thin at progressively lower frequencies.
-
3.
When the X-ray binary system is persistently emitting a radio jet the X-ray spectrum has a power law component with . This X-ray state is called Low/Hard. The superposition (Fig. 15) of spectra of different contiguous jet regions with different self-absorption cutoffs result in a composite flat spectrum (i.e. S, with ) through and beyound radio wavelengths. Emissions in the radio band and at hard X-rays are related by:
4.3 LS I +61∘303: Soft and Hard States
There are three X-ray observations of LS I +61∘303: with ROSAT (Taylor et al. 1996), ASCA (Leahy et al. 1997) and RXTE (Harrison et al. 2000). The ROSAT observation was performed over a total orbital cycle in the energy range from 0.07 to 2.48 keV. A single component fit was made, either a black body or a power-law and average fitted results were presented: A temperature of 0.26 keV and a power law index of =2.
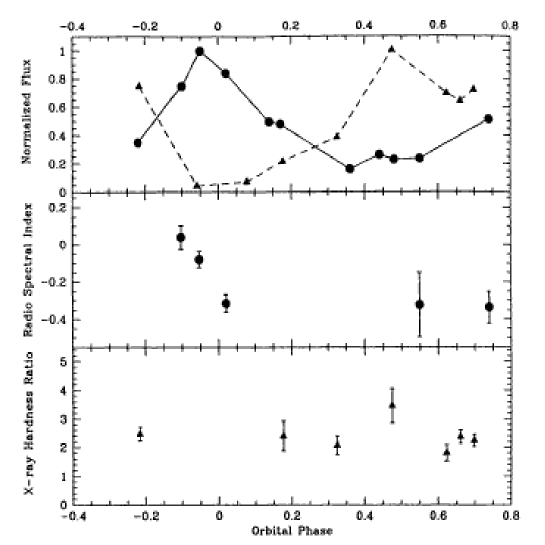
The hardness-ratio is calculated all around the orbit and Taylor et al. (1996) notice the hardening of the X-ray emission during the onset of the second radio outburst (Fig. 19).
Greiner and Rau (2001) calculated the photon index around the orbit based on RXTE data (measured range 2.3–25 keV) (Fig. 20). It is quite remarkable that the fit (only a single component, i.e. a power law) gives 2.0-2.4 all around the orbit (i.e. a High/Soft state) except for one point - simultaneous with the onset of a radio outburst -, where the photon index is = 1.6 (i.e. Hard state). This seems to be the typical case of the theory presented in the previous section for a Low/Hard state. The X-ray peak occured at phase 0.48 whereas the radio outburst came almost 6 days later (Fig. 20). However, in the light of developments in the theory of the disk-jet connection (reviewed in the previous sections) the spectral switch to the hard state is relevant for the ejection; this switch must precede the onset of the radio outburst and RXTE data actually show this for LS I +61∘303 (Massi 2004).
If a source remains in the Low/Hard state, it is radio-loud and the spectrum is flat. How does the spectrum of LS I +61∘303 behave taking into account that the Low/Hard state seems to be of a quite short duration ? Indeed, a flat spectrum has been measured by Taylor et al. (1996): in Fig. 19-middle the radio spectral index is equal to zero before the radio peak. When the ejection phase is terminated the figure very nicely shows that the flat spectrum evolves into an optically thin one (i.e. changes from 0, due to the composite spectrum, to -0.3 related to the optically thin part of the “last”emitted bubble or cylinder as in Fig. 15). As shown by Paredes et al. (1991) the flat spectrum in LS I +61∘303 can be reproduced by a model of an adiabatically expanding cloud of synchrotron-emitting relativistic electrons only if a continuos ejection of particles (lasting two days) is taken into account as well as adiabatic expansion losses.
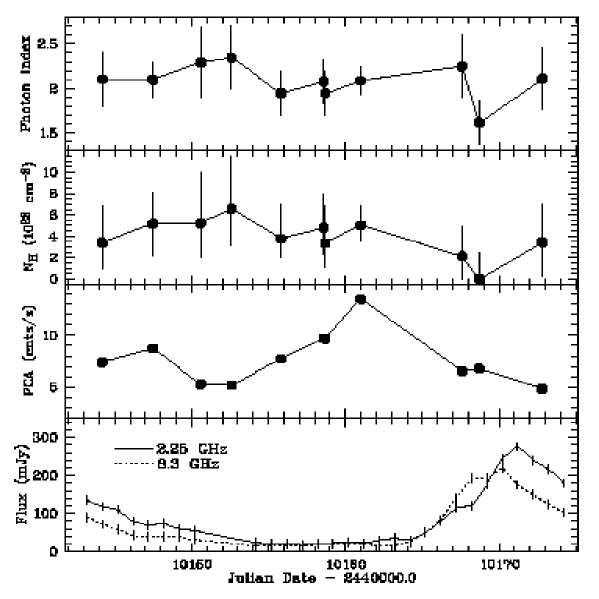
Leahy et al. (1997) reported two ASCA observations, where the photon index was 1.63-1.78 at orbital phase =0.2, which is the periastron passage (where an ejection is predicted), and =1.75-1.90 at orbital phase 0.42 coincident with the onset of a radio outburst (as shown in Fig. 21). In conclusions, both ASCA values give a photon index consistent with a Low/Hard state during predicted/observed ejections.

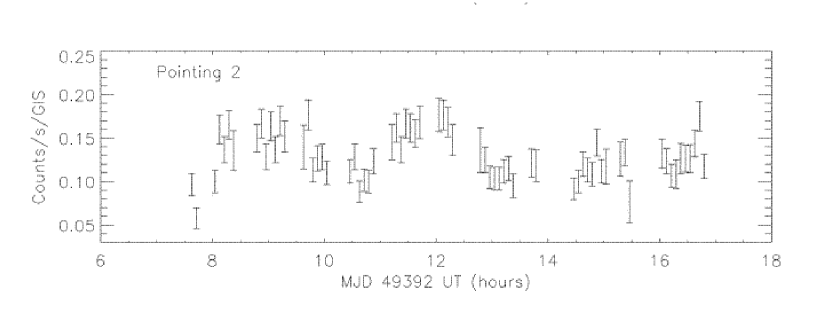
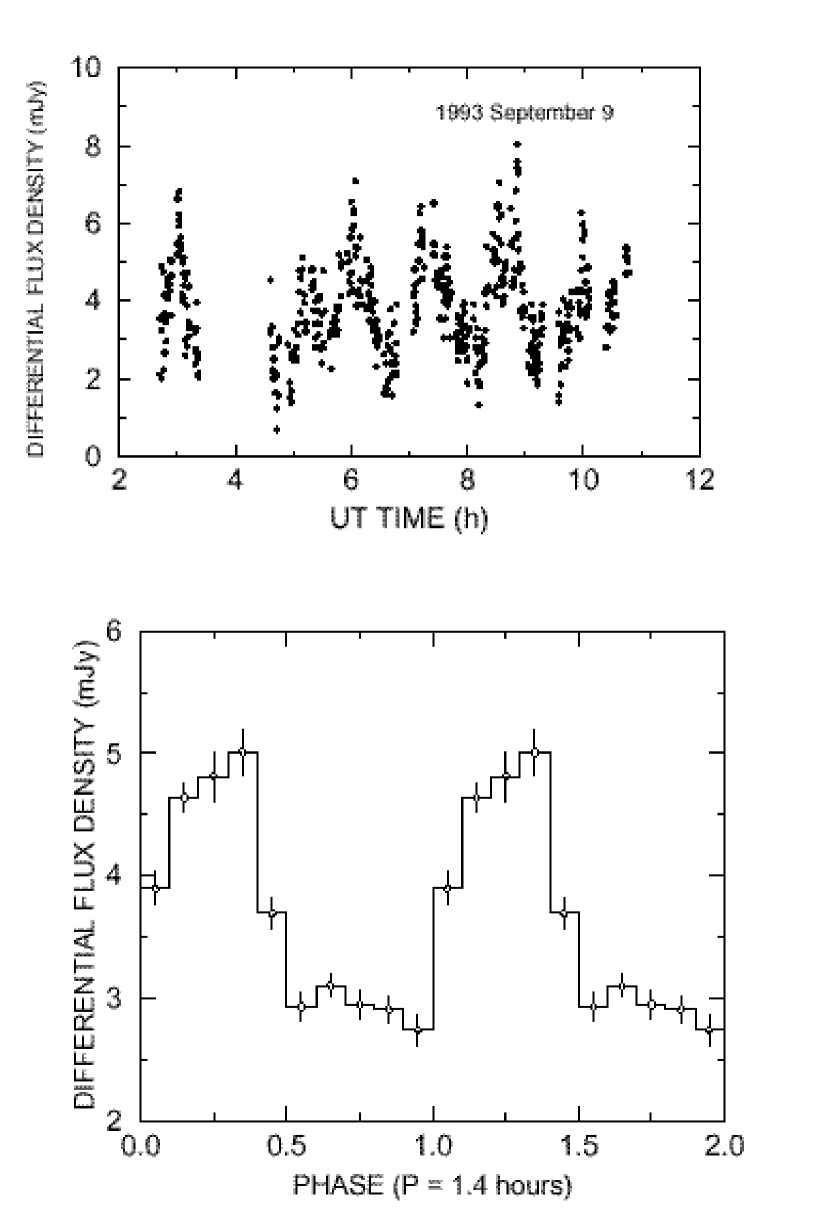
Harrison and collaborators (2000) have performed a periodicity analysis of the two ASCA observations. The result is a clear periodicity (Fig. 22) in the ASCA pointing related to the onset of a radio outburst while no periodicities are found in the other more sparcely sampled pointing. The X-ray oscillations occured at phase 0.42 before the radio peak, which (Fig. 21) occured at phase 0.5-0.6. The photon indexes given above reflect an average of all the data; therefore we cannot check, if the Low/Hard state is stable or if there is a continuos switching between a sort of Very High States (i.e. A,B,C) like for GRS 1915+105 (Belloni et al. 2000) or if the Low/Hard state is indeed reached only in the hardest interval. Such oscillations are also present in the radio band. Peracaula and collaborators (1997) have performed a period-analysis for three radio observations: two in a decreasing phase of large outbursts and one at a high, but quiescent flux level. While in the last data set there was no evidence for a periodicity, on the contrary, a period of P = 84 minutes and significant power also at harmonics of P/2 (i.e. minutes again) and 2P have been found in the two data sets related to the decay of radio outbursts (Fig. 23).
In conclusion:
-
1.
There is no estimate of any inner radius for the accretion disk in LS I +61∘303 . The multicolor disk mostly emits below 2.5 keV and this range is excluded by the RXTE analysis.
-
2.
The available X-ray observations for LS I +61∘303 reveal transitions to Hard/Low states at the onset of radio outbursts as is expected in the context of the disk-jet connection (Massi 2004).
-
3.
A prolongated ejection of particles generates a flat spectrum in the late portion of the rise in flux.
-
4.
X-ray oscillations and radio-oscillations are present at the early rise phase and during the decay of radio outbursts (Peracaula et al. 1997: Harrison et al. 2000)..
4.4 The Periodical Radio Outbursts of LS I +61∘303
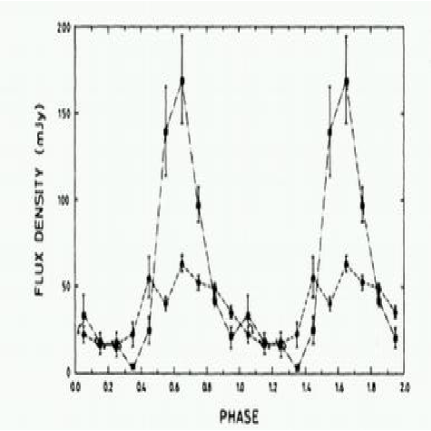
The greatest peculiarity of LS I +61∘303 is its periodic radio outburst activity with P=26.496 days (Gregory 2002)

(see in Fig.24 Left-Top a typical radio light curve). The second peculiarity of LS I +61∘303 is that the amplitude of each outburst is not randomly varying, but itself periodic with a periodicity of 4.6 years (Fig. 24 Left-Bottom) (Gregory 1999, 2002).
The orbital phase at which these outbursts occur is modulated (Gregory et al. 1999) and varies within the interval 0.5–0.8 (Fig. 24 Right and Fig. 25)(Paredes et al. 1990).
The theory of accretion (Eq. 6) predicts maximum accretion where the density is highest. The maximum density is obviously at the periastron passage, because the density of the wind there is the largest and in addition there probably occurs direct accretion from the the star (Roche Lobe overflow). As shown in Fig. 24 Right the at periastron passage is 0.2 and therefore practically is opposite to the orbital region, where the radio outbursts occur. Therefore one of the fundamental questions concerning the periodic radio outbursts of LS I +61∘303 has been for years: Why are the radio outbursts shifted with respect to the periastron passage ?
5 THEORY OF THE ACCRETION: THE TWO PEAK ACCRETION MODEL
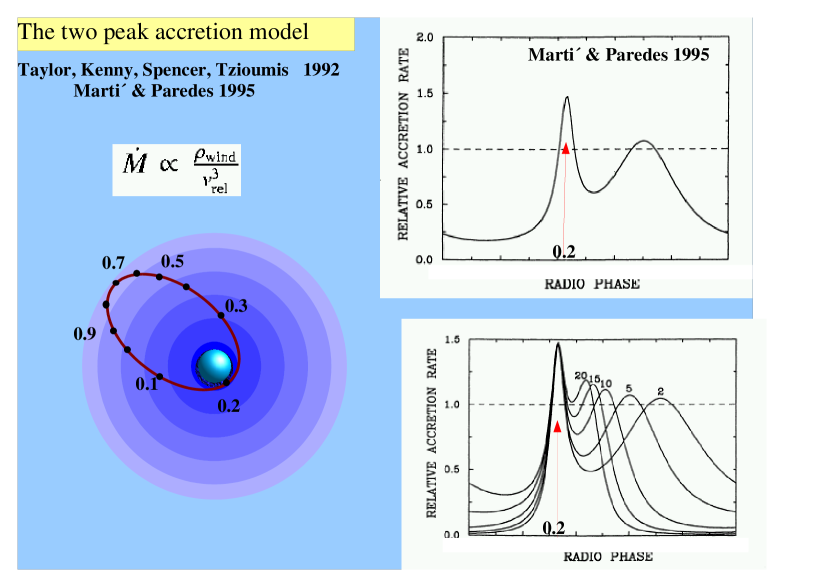
Equation 6 gives only one accretion peak for variable density and constant velocity . However, the orbit of LS I +61∘303 is quite eccentric and therefore with a strong variation of the velocity along the orbit. Taylor et al. (1992) and Martí & Paredes (1995) have shown that in this case the accretion rate develops indeed two peaks: The first peak corresponds to the periastron passage (highest density), while the second peak occurs when the drop in the relative velocity compensates the decrease in density (because of the inverse cube dependence) (Fig. 26 Top Right).
This also implies that, while the first peak always occurs at periastron passage, the second peak may move to different points in the orbit, if variations in or occur. Figure 26 Right-Bottom shows how for increasing values of the wind-velocity the second peak shifts toward the first peak (Martí & Paredes 1995).
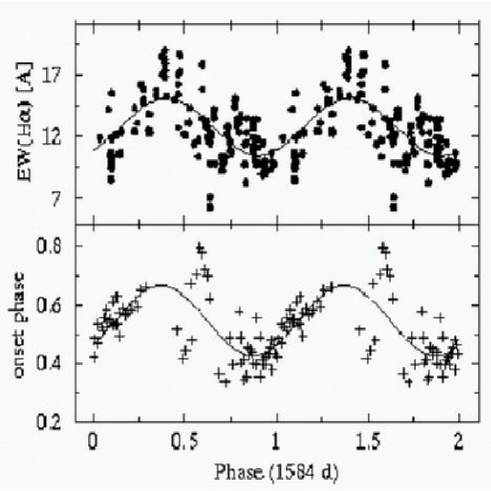
On the other hand variations in the mass loss of the Be star have been well established by H emission line observations (Zamanov & Martí 2000). Gregory & Neish (2002) suggest a periodic outward moving density enhancement (i.e., shell ejection) in the Be star wind. The variation of H emission line (Zamanov & Martí 2000) is periodic with a comparable scale (1584 d) as the radio modulation and it is in phase with the onset of the outbursts (Fig. 27). The orbital shift in the phase of the radio outbursts is therefore related to variations of the wind parameters.
Finally, Martí & Paredes (1995) have shown that during both peaks the accretion rate is above the Eddington limit and therefore one expects that matter is ejected twice within the 26.496 days interval.
In conclusion, radio outbursts displaced from periastron passage correspond to the second peak of the two-accretion/ejection peaks. The remaining problem therefore is: Why is the first outburst at periastron passage in the radio band missing ?
6 GAMMA-RAY OBSERVATIONS
6.1 EGRET Sources
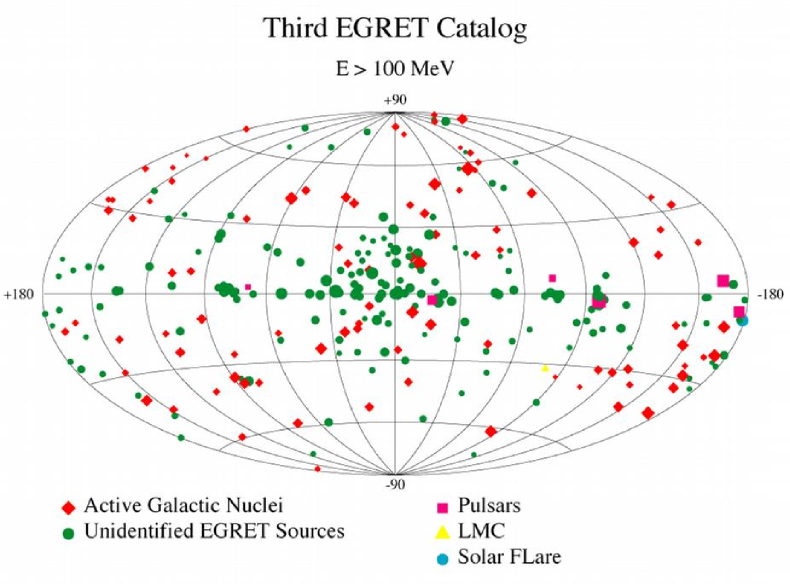
The Third EGRET Catalog contains about 170 not yet identified high energy Gamma-ray sources (E 100 MeV) ((Fig. 28). The discovery of the coincidence of the microquasar LS5039 (Fig. 29) with an unidentified EGRET source by Paredes and collaborators (2000) has opened the possibility that other EGRET sources could be microquasars as well. Gamma-rays can be produced by external Compton scattering of stellar UV photons of the massive companion by the relativistic electrons of the jet. LS5039 is a persistent radio emitting source and the Gamma ray flux, with all uncertainties reflected by the poor sampling, still reflects this persistence (Fig. 29)(Paredes et al 2000).

Therefore, for a periodic source like LS I +61∘303 periodic Gamma-ray emission would be expected.
6.2 The Variable Gamma-Ray Source LS I +61∘303
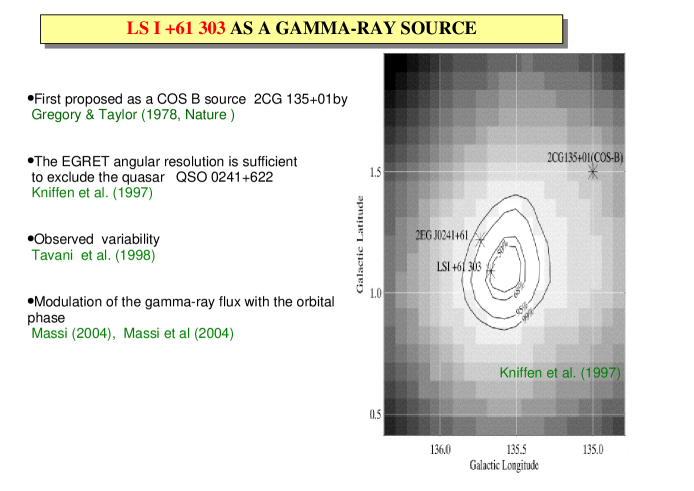
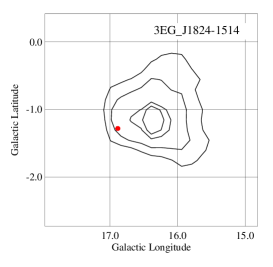
Gregory and Taylor (1978) reported the discovery of a radio source (later on associated with LS I +61∘303 ) within the 1 error circle of the COS B -ray source 2CG 135+01. This association however remained controversial because of the presence of the quasar QSO 0241+622 within the relatively large COS B error-box. In the CGRO mission (1991 May- 1995 October) the source, given there as 2EG J0241+6119, was detected by EGRET with a significance of 17 , with a time averaged photon flux of cm-2 s-1 for energies 100 MeV. This flux reported by Kniffen et al. (1997) is slightly different from those quoted in the EGRET Catalogs because of the addition of data after the 1993 September cutoff date for the catalog. The position of this gamma-ray source is = 135∘.58, = 1∘.13. As shown in Fig. 30 the contour position obtained with additional data is about 11´ from the 2EG catalog position and about 40´ from the old 2CG catalog position. The radius of the 95 confidence error contour is about 13´, ruling out the possible identification with QSO 0241+622 at l = 135∘.7, b = 2∘.2, which is 64´ away. The position is only 8´ distant from LS I +61∘303 (Kniffen et al. 1997). In 1998 Tavani and collaborators established the possibility of variability of 2CG 135+01 on timescales of days (Tavani et al. 1998). Massi (2004) examined the EGRET data as a function of the orbital phase and noticed the clustering of high flux values around periastron passage. Figure 31 shows (Massi et al. 2004) the follow-up of the EGRET gamma-ray emission along one full orbit. At epoch JD 2 450 334 (i.e. circles in the plot, with empty circles indicating upper limits) the orbit has been well sampled at all phases: A clear peak is centered at periastron passage 0.2 and 1.2. At a previous epoch (JD 2 449 045; triangles in the plot) the sampling is incomplete, but the data show an increase near periastron passage at 0.3, and a peak at 0.5. The 3 squares refer to a third epoch (JD 2 449 471).
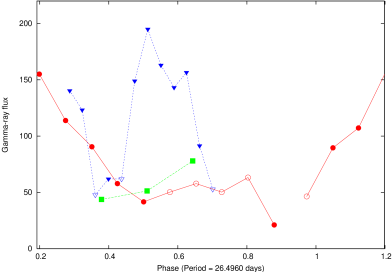
In conclusion, the gamma-ray data strongly support the ejection at periastron passage predicted by the two-peak model (Massi 2004b). During the first ejection (because of the proximity of the Be star) stellar photons are upscattered by the inverse Compton process by the relativistic electrons of the jet (Bosch-Ramon & Paredes 2004). The inverse Compton losses are so severe that no electrons survive: radio outbursts indeed never have been observed at periastron passage in more than 20 years of radio flux measurements (Gregory 2002). At the second accretion peak the compact object is far enough away from the Be- star, so that energetic losses are smaller and electrons can propagate out of the orbital plane. At this point the gamma-ray peak at is very interesting. It could originate from a second ejection which occurred still enough close to the Be-star. In fact, while the first ejection is always at periastron passage, the second ejection occurs at a varying point in the orbital phase interval 0.4–0.8.
7 RADIO INTERFEROMETRY: IMAGING AT HIGH RESOLUTION
Nowadays it is possible to obtain images of jets at infrared wavelengths and in X-rays (Sams et al. 1996; Corbel et al. 2002). However, these jets at tenths of arcseconds are not related to the emitting regions close to the engine (with quite short lifetimes because of their large adiabatic/synchrotron losses) but require a re-acceleration mechanism. The study of the jet closest as possible to the “engine” at a spatial resolution up to milliarcseconds (mas) is possible at radio wavelengths thanks to Very Long Baseline Radio Interferometry (VLBI) (Appendix).
7.1 The Jet Velocity
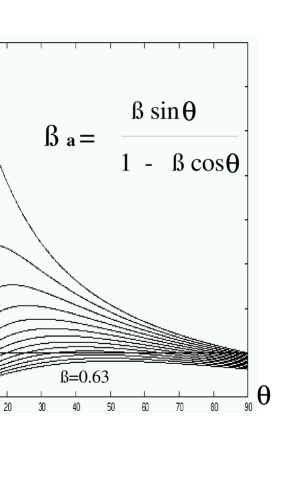
For symmetric ejection of two jets at a velocity (i.e. expressed as a fraction of ), the two (approaching and receding) jets move with an apparent velocity of (Mirabel & Rodríguez 1994, Fender 2004):
| (8) |
is the angle between the direction of motion of the ejecta and the line of sight to the observer. Depending on the angle, for a jet with the apparent velocity of the approaching jet can become greater than 1 (superluminal effect, see Fig. 32).
In order to show how the apparent velocity of the jet is derived, let us assume =90. In this case the proper motion, , of the jet on the sky plane is:
| (9) |
where the distance is in kpc and is expressed in milliarcseconds per day (mas/day). The range of is about 0.15–0.99 and the range of the distance is about 1-12.5 kpc. From the two extreme conditions, i.e and , the proper motion ranges from 2 mas/day to 170 mas/day. In order to estimate from multi-epoch observations one has to select the proper radio network. One must take into account that at =6cm the VLBI provides a resolution of mas, MERLIN one of 50 mas and the VLA in the largest configuration one of 100 mas. Therefore high proper motions are best studied with MERLIN and the VLA.
Beside multi-epoch observations even with only one observation it is possible to recover the quantity , if is significantly less than 90∘. In fact, the observed flux densities from the approaching and receding jets,
| (10) |
(where is the spectral index of the emission and is 2 for a continuous jet and 3 for discrete condensations) are governed by the Doppler factor,
| (11) |
(where is the Lorentz factor) and therefore (Mirabel & Rodríguez 1994) one can determine the quantity by means of the ratio between the flux densities from the approaching and receding jet:
| (12) |
Let us assume an ejection nearly aligned to the line of sight with =0.5 and with the other parameters: , k=2 and . Using equation 10 one determines and . As a result, the counter-jet can be rather faint, and if results to be lower than the noise limit of the radio image the counter-jet will completely disappear. In this case the image will show a one-sided jet (the approaching one) and only a lower limit for can be estimated using the noise limit of the image (Massi et al. 2001).
A constant ejection angle implies a constant ratio between the flux densities from the approaching and receding jet during the epochs. An obvious variation of this ratio is interpreted as a variation of the ejection angle , explained as jet precession.
7.2 The Precessing Jet of LS I +61∘303
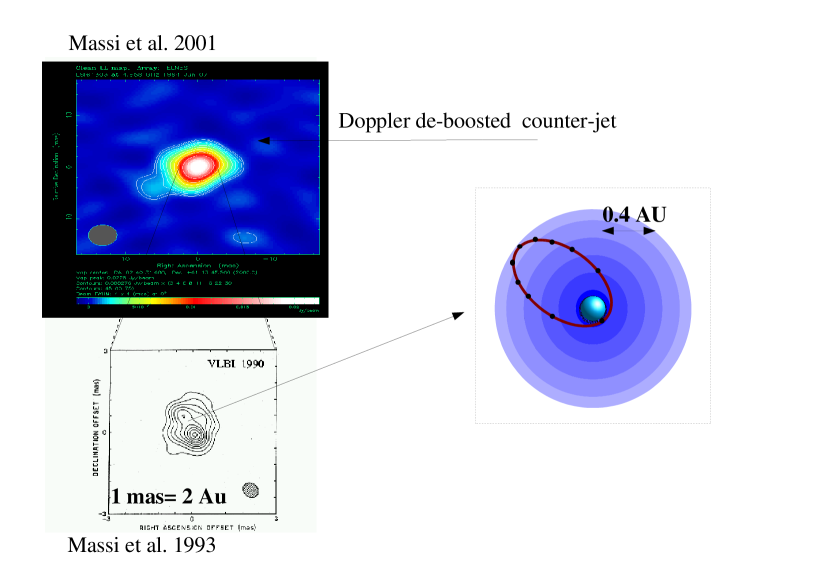
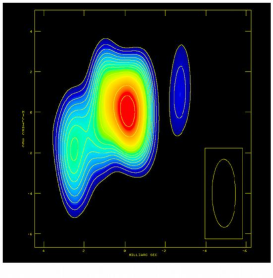
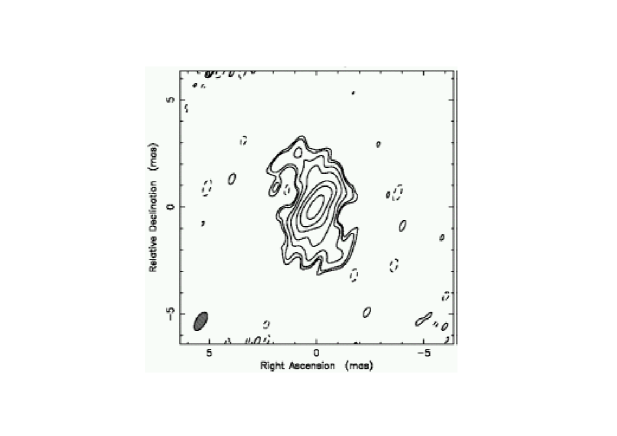
The first VLBI observation resolving the source (Massi et al. 1993) in Fig. 33 reveals a complex morphology (Fig.33 Bottom): A structure at PA formed by two components separated 0.9 mas (about 2 AU at the distance of 2 kpc) is surrounded by an envelope clearly rotated with respect to it. This envelope could be an older expanding jet, previously ejected at another angle (because of precession).
Taylor and collaborators (2000) performing VLBI observations in combination with the HALCA orbiting antenna of the VSOP mission, imaged a structure reminiscent of the precessing radio jet seen in SS433 (Fig. 34). On the other hand at a lower resolution with a scale up to tens of AU (with the EVN), Massi and collaborators (2001) obtained an image that for the first time showed an elongation in a clear direction without any ambiguity (see Fig. 33). The most interesting aspect of the EVN map is that, for the first time, we detected asymmetric emission in the southeast direction. Using the noise level () of the map and the peak value of the approaching component () for k=2 and =-0.5 we determine . This would correspond to the two limits of for and for . A value for the velocity well within the range to found for other Microquasars (Mirabel & Rodríguez 1999i).
Two observations at still lower resolution have been performed with MERLIN (see Table 1). The first MERLIN image shows a double S-shaped jet extending to about 200 AU on both sides of a central source.
| Date | Start MJD | Stop MJD | ||
|---|---|---|---|---|
| April 22 | 52021.73 | 52022.10 | 0.670 | 0.684 |
| April 23 | 52022.68 | 52023.17 | 0.706 | 0.724 |
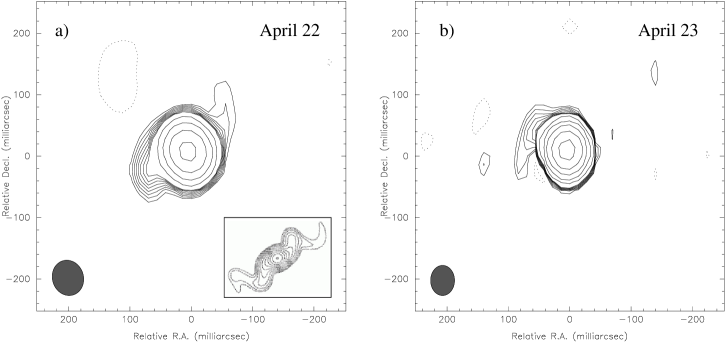
The morphology of the MERLIN image (Fig. 35a) has a bent, S-like structure. In the small box in Fig. 35a we show the simulated radio emission from the Hjellming & Johnston 1988 model of the precessing jet of SS 433 (rotated here for comparison purposes). The similarity between the MERLIN image of LS I +61∘303 and the precessing model for SS 433 strongly suggests a precession of the jet of LS I +61∘303. The precession becomes evident in the second MERLIN image, shown in Fig. 35b, where a new feature oriented to Northeast at a position angle (PA) of 67∘ is present. The Northwest-Southeast jet of Fig. 35a has PA=124∘. Therefore, a quite large rotation has occurred in only 24 hours. This fast precession causes a deformation of the morphology during the second observation, and the one-sided jet appears bent in Fig 35b. Only 3 features can be associated with the double jet of the day before. The feature at 3 to the East is well compatible with a displacement of hours.
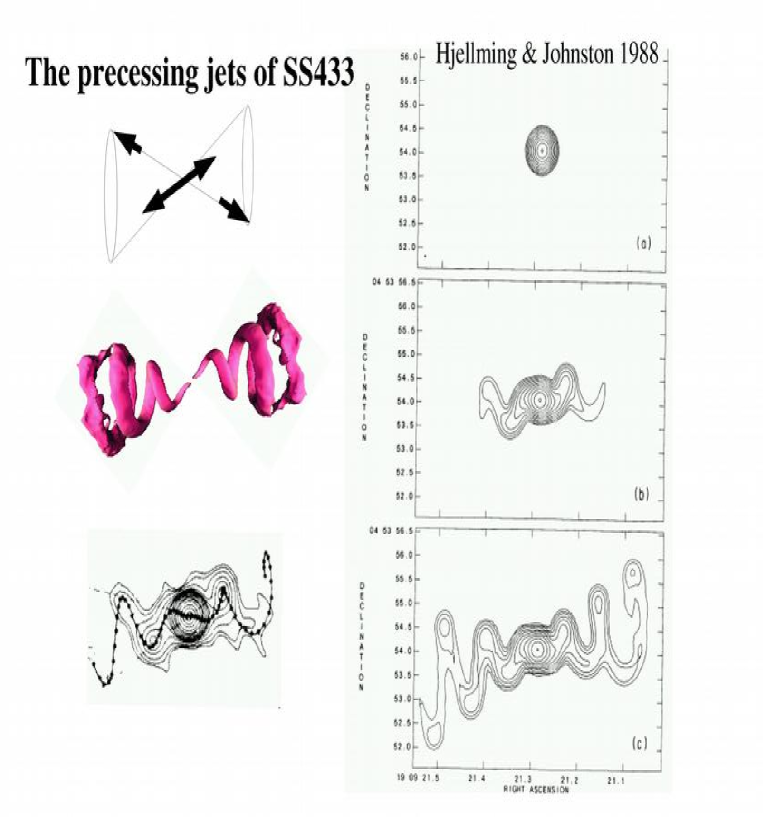
The appearance of successive ejections of a precessing jet with ballistic motion of each ejection is, as shown in Fig. 36, a curved path that, depending on the modality of the expansion and therefore on the adiabatic losses, seems to be a “twin-corkscrew” or a simply S-shaped pattern (Hjellming & Johnston 1988; Crocker et al 2002). The last one seems to be the case of LS I +61∘303. Can we trace any ballistic motion of any jet component ?

We have splitted the data base of each MERLIN run into two subsets. The first map (Fig. 37-a) represents the first four hours of the first run. It shows an ejection ”A” already quite displaced from the core. In Fig.37-b, there is present a new ejection ”B” at another PA. The combination of these two maps together produce as a consequence a ”bent” jet, that is the southern jet of Fig. 35a. The two counter-jets for ”A” and ”B” are (Figs. 37-a and 37-b) too weak to be detected, and they become visible only in the more sensitive image of Fig. 35a, where all the jet and counter jets for A and B form together the ”S-shaped” jet. The ”B” component is still detectable after 9 hours in the third image (Fig.37-c). Its motion is ballistic: the PA is still the same (almost 90∘) as in Fig.37-b. A new component ”C” is present at another PA (Fig. 37-d) 6 hours later, little rotation of the PA is compatible with PA of the previous image. The Northern elongation in the higher sensitivity map of Fig. 35b therefore is the result of a set of little ejections of a rotating stream. The noise level in this image is still lower than that in Fig. 35a, nevertheless the counter-jet is not visible. This implies a decreased due to precession. In the case of the MERLIN image of April 22 we derive , which for leads to an ejection angle of . This is an average of the ejection angles and of features A and B in Figs. 37a and 37b. A direct estimate of these angles is prevented because of the lack of the receding jets. Using the r.m.s. noise we derive , and for the C ejection in Fig.37c, .
Therefore, the angle between the jet and the line of sight, , has decreased by more than 10∘ in 24 hours. It is this much narrower alignment of the jet with the line of sight, that causes the counter-jet to get further Doppler de-boosted with respect to the first image and lets it disappear below the sensitivity limit of the image.
8 CONCLUSIONS
The conclusions of this review of the astronomical methods used for the investigation of Microquasars, with an examplary view on the source LS I +61∘303, are:
-
1.
It is still an open issue, whether the compact object in this system is a neutron star or a black hole. In fact, taking into account the uncertainty in inclination, mass of the companion and the mass function, the existence of a black hole cannot be ruled out.
-
2.
The observational results from X-rays for LS I +61∘303 are consistent with transitions between X-ray spectral states typical for a variable accretion disk. These transitions are properly related to the onset of strong radio emission, as expected if the jet is ”fed” by the disk. Quasi-periodic oscillations at soft X-rays and radio wavelengths are present in a strong analogy with those observed in GRS 1915+105. They occur at the onset and decay of large radio outbursts. If confirmed, this fact might indicate that at the beginning the matter is ejected from the disk in the form of discrete condensations (i.e. blob-like), then follows a steady state where the matter-supply occurs at a higher/continuous rate (i.e. a continuous jet) and finally the ejection again ends up in a blob-like form. (Hujerat & Blandford 2003).
-
3.
At a scale of hundreds of AU the radio jet quite strongly changes its morphology in short intervals ( 24 hours), evolving from an initial double-sided jet into an one-sided jet. This variation corresponds to a reduction of more than 10∘ in the angle between the jet and the line of sight. This new alignment severely Doppler de-boosts the counter-jet. Further observational evidence for a precessing jet is recognizable even at AU scales.
-
4.
The same population of relativistic electrons emitting radio-synchrotron radiation upscatters - by inverse Compton processes - ultraviolet stellar photons and produces Gamma-ray emission. Ejections near the periastron passage produce Gamma-ray flares but no radio flares, implying severe Compton losses.
We conclude that, because precession and variable Doppler boosting are the causes of the rapid changes in the radio-morphology, precession and variable Doppler boosting are likely to produce Gamma-ray variations at short time scales. The amplification due to the Doppler factor for Compton scattering of stellar photons by the relativistic electrons of the jet is (where ), and therefore is higher than that for synchrotron emission, i.e. (Georganopoulos et al. 2001; Kaufman Bernadó et al. 2002). LS I +61∘303 becomes therefore an ideal laboratory to test the recently proposed model for Microblazars with INTEGRAL and MERLIN observations now and by AGILE and GLAST in the future.
9 SUMMARY
Because of their accretion disk super-massive black holes, with 106-109 solar masses, in the heart of galaxies are the cause for the most energetic sources of emission in our Universe. The centers of such galaxies are called Active Galactic Nuclei (AGN). Some AGN, like the quasars, produce ”jets” of subatomic particles with speeds approaching that of light. A microquasar - as its name suggests - is a miniature version of a quasar: A disc of a few thousand kilometers radius surrounds a black hole of a few solar masses and two relativistic jets are propelled out of the disk by the same process occurring in a Quasar. The Microquasars therefore can serve as a convenient ”laboratory” for studying the physics of jets. The Microquasars are objects very much closer to us than Quasars and the study of the evolution of relativistic jets can be done in a few days only, whereas on the contrary for far distant Quasars observations of many years apart are necessary to obtain appreciable proper motions of the radio jets. Moreover, concerning the intrinsic variability of Microquasars, these “small” objects change more quickly than Quasars: Considering as a characteristic time scale for variations , phenomena of timescales of minutes connected with a Microquasar of 10 solar masses would take years in a AGN of solar masses. Such an enormous difference is the main reason why Microquasars got such a great interest and growth in Astrophysics in the last decade.
The Microquasars belong to the class of the X-ray binaries, where a compact object (black hole or neutron star) accretes from a normal companion star. Such systems are well known since the 1960s. The X-ray emission originates from the very hot accretion disk surrounding the compact object. However, it took a long time to discover that some of these systems also have relativistic radio jets like Quasars. For several years, after its discovery in 1979, SS 433 with its spectacular jets was thought to be a unique exotic case, a mere curiosity in our galaxy. Since the beginning of the 1990, after the discovery of other possible candidates of the same nature, several groups (including the author of this review) have begun a systematic research on X-ray binaries with radio jets.
Here I review the astronomical methods used from Gamma-rays over X-rays and optical to radio wavelengths for the investigation of these objects. The description of the methods is accompanied by directly applying them to the system LS I +61∘303 , one of the most enigmatic objects in our galaxy, because it is associated with a variable high-energetic Gamma-ray emission of unknown origin.
The nature of the accretor - a neutron star or a black hole - is determined by optical measurements of the Doppler shift of spectral lines of the normal star orbiting around the invisible companion. Observations at X-rays probably are the most spectacular ones, in respect to the progress in the knowledge of the accretion disk and the disk-jet connection. Fitting the X-ray spectra information of the size of the last stable orbit around the compact object can be derived and ejections of matter into relativistic jets can be related to variations of the disk. The results from X-ray observations for LS I +61∘303 are consistent with transitions between spectral states typical for a variable accretion disk. These transitions are properly related to the onset of strong radio emission as expected for a jet ”fed” by the disk.
Onset and decay of some large radio outbursts are modulated with quasi-periodic oscillations that correspond to repetitive ejections of discrete condensations (i.e. blob-like). Continuous ejections have a flat radio spectrum and Low/Hard X-ray state.
Speed and morphology of the ejections at high resolution are studied with radio interferometric techniques. The results of more than 10 years of VLBI/EVN and MERLIN observations of LS I +61∘303 are presented together with our discovery of the relativistic jet and its precession. Successive ejections are in ballistic motion; because of precession their projected path on the sky plane draw a bending jet.
The radio bursts occur around apastron passage, where the low velocity of the accretor enables it to capture more material of the wind from the companion star. However, no bursts are observed at periastron passage, where accretion theory predicts another super-accretion event. There the accretor is completely embedded in the densest part of the wind. I found that this great open question about LS I +61∘303 and the other enigma about the association of LS I +61∘303 with a variable Gamma-ray source are indeed not two separate questions, but on the contrary one is the answer to the other: We do not see a radio outburst at periastron passage, because we see a Gamma-ray outburst. With LS 5039 for the first time we identified a Microquasar with an high-energy (E 100 Mev) source. This fact opens the perspective that others of the more than one hundred still unidentified EGRET sources could belong to a new class of objects: Gamma-ray Microquasars.
In this review I show that the variable Gamma-ray emission of LS I +61∘303 is related to the orbit of the system, with peaks clustering where the companion star - a strong emitter of ultraviolet photons - is closest (at periastron). The suggested most probable explanation is that the ejected relativistic electrons are not able to emit synchrotron radiation at radio wavelengths, because at periastron passage they are embedded in such a strong UV-field of radiation that they loose completely their energy by inverse Compton process. During the second accretion peak, the compact object is much farther away from the companion star and inverse Compton losses are lower: The electrons can propagate out of the orbital plane and radio outbursts are observed.
10 ZUSAMMENFASSUNG
Supermassive Schwarze Löcher mit 106-109 Sonnenmassen im Zentrum von Galaxien sind wegen ihrer Akkretionscheibe der Grund für die stärksten Strahlungsquellen in unserem Universum. Die Zentren solcher Galaxien werden Aktive Galaktische Nuklei (AGN) genannt. Einige AGN wie z.B. Quasare produzieren ”Jets” von subatomaren Teilchen mit Geschwindigkeiten bis nahe an die Lichtgeschwindigkeit. Ein Mikroquasar ist, wie der Name schon sagt, die Miniatur eines Quasars: Eine Scheibe von einigen tausend Kilometern umgibt ein Schwarzes Loch von einigen Sonnenmassen und zwei relativistische Jets werden durch denselben Prozess wie bei Quasaren aus der Scheibe herausgeschleudert. Ein Mikroquasar kann deshalb als ein brauchbares “Labor” zum Studium der Physik solcher Jets dienen. Die Mikroquasare sind Objekte, die wesentlich näher zu uns liegen als Quasare und die Untersuchung der Evolution von relativistischen Jets kann in nur ein paar Tagen geschehen,wohingegen man für weit entfernte Quasare langjährige Beobachtungen benötigt, um ausreichende Eigenbewegungen zu erhalten. Weiterhin, wenn man die intrinsische Variabilität von Mikroquasaren betrachtet, ändern sich diese “kleinen” Objekte schneller als Quasare: Nimmt man als charakteristische Zeitskala für Variationen , nehmen Phänomene mit einer Zeitskala von Minuten bei Mikroquasaren von 10 Sonnenmassen eine Zeit von Jahren bei einem Quasar von Sonnenmassen in Anspruch, wenn man es mit der Masse des Akkretors skaliert.Diese enorme Differenz ist der Hauptgrund, weshalb Mikroquasare in der letzten Dekade solch ein grosses Interesse und Wachstum in der Astrophysik auf sich gezogen haben.
Die Mikroquasare gehören zur Klasse der Röntgen-Doppelsterne, wo ein kompaktes Objekt ( Schwarzes Loch oder Neutronenstern ) von einem normalen Begleitstern einen Massenzuwachs erfährt. Solche Systeme sind seit den 1960er-Jahren gut bekannt.Die Röntgenstrahlung stammt von der sehr heissen Akkretionsscheibe, die das kompakte Objekt umgibt. Allerdings dauerte es eine lange Zeit, bis man entdeckte, dass einige dieser Systeme ebenso wie Quasare relativistische Radio-Jets aussenden. Für viele Jahre nach seiner Entdeckung 1979 galt SS 433 mit seinen spektakulären Jets als ein einzelner exotischer Fall, eine einzigartige Kuriosität in unserer Galaxie. Anfag der 1990 nach der Entdeckung von anderen möglischen Kandidaten derselben Art begannen einige Gruppen ( einschliesslich des Autors dieses Reviews) mit einer systematischen Forschungsarbeit an Röntgen-Doppelsternen mit Radio-Jets.
Ich gebe hier einen Überblick über die astronomischen Methoden, die im Bereich von Gamma-Strahlung über Röntgen-Strahlung und optischen bis hin zu Radio Wellenlängen zur Untersuchung dieser Objekte angewandt werden. Die Beschreibung dieser Methoden wird unmittelbar begleitet durch die Anwendung der Methoden auf das System LS I +61∘303 , einem der rätselhaftesten Objekte in unserer Galaxie,weil es mit einer variablen hochenergetischen Gamma- Strahlungsquelle unbekannten Ursprungs verbunden ist.
Die Natur des Akkretors - ein Neutronenstern oder eine Schwarzes Loch - wird durch optische Messungen anhand der Dopplerverschiebung von Spektrallinien des normalen Sterns, der sich um seinen unsichtbaren Begleiter bewegt, ermittelt. Beobachtungen im Röntgenbereich sind wahrscheinlich die spektakulärsten im Hinblick auf den Fortschritt bezüglich der Kenntnisse über die Akkretionsscheibe und die Scheiben-Jet Verknüpfung. Indem man die Röntgenspektren untersucht, erhält man Informationen über die letzte stabile Bahn um das kompakte Objekt und ebenso kann man die Variation dieser Grösse mit dem Auswurf von Materie in die relativistischen Jets correlieren. Die Ergebnisse von Röntgenbeobachtugen von LS I +61∘303 sind konsistent mit Übergängen zwischen spektralen Zuständen im Röntgenbereich typisch für eine veränderliche Akkretionsscheibe.Diese Übergänge sind passend verbunden mit einem Anstieg von starker Radiostrahlung, wie man es für einen Jet, der von der Scheibe “gespeist” wird, erwartet.
Anstieg und Abfall der starken Ausbrüche sind moduliert mit quasi-periodischen Oszillationen, die wiederholten Auswürfen von diskreten Kondensationen entsprechen. Ununterbrochene Auswürfen haben Radiospektrum flach und Röntgenzustand “Low/Hard”.
Die Geschwindigkeit und die Morphologie der Auswürfe wereden mithilfe der Radiointerferometrie-Technik untersucht. Die Ergebnisse über mehr als zehn Jahre von Beobachtungen mit VLBI/EVN und MERLIN von LS I +61∘303 werden hier zusammen mit unserer Entdeckung des relativistischen Jets und seiner Präzession dargestellt. Aufeinander folgende Auswürfe folgen ballistischer Bewegung; wegen der Präzession bildet ihr auf die Himmelsebene projezierter Weg einen gebogenen Jet.
Der Radioausbruch geschieht um den Apoastron-Durchgang herum, wobei die geringe Geschwindigkeit es dem Akkretor erlaubt, mehr Material vom Wind des Begleitstern einzufangen. Allerdings werden keine Ausbrüche beim Periastron-Durchgang beobachtet, wo die Akkretions-Theorie ein weiteres super-akkretives Ereignis vorhersagt. Dort ist der Akkretor vollständig vom dichtesten Teil des Windes umgeben. Ich fand heraus, dass diese grosse offene Frage über LS I +61∘303 und das andere Rätsel bezüglich der Verbindung von LS I +61∘303 mit der veränderlichen Gamma-Strahlungsquelle in Wirklichkeit keine zwei getrennten Fragen sind, sondern im Gegenteil ist die eine die Antwort auf die andere: Wir beobachten keinen Radioausbruch beim Periastron- Durchgang, weil wir einen Gamma-Strahlungsausbruch sehen. Mit LS 5039 haben wir zum ersten Mal einen Mikroquasar mit einer hochenergetischen (E 100 Mev) Quelle identifiziert. Diese Tatsache eröffnet die Perspektive, dass andere der mehr als hundert noch nicht identifizierten EGRET Quellen zu einer neuen Objektklasse gehören können: Gamma-Strahlungs-Mikroquasare.
In diesem Review zeige ich, dass die veränderliche Gamma-Strahlung von LS I +61∘303 mit der Umlaufbahn des stellaren Systems verbunden ist, mit sich läufenden Spitzen dann, wenn der Begleitstern - ein starker Strahler von Ultraviolett-Photonen - am nächsten ist (beim Periastron-Durchgang). Die vorgeschlagene wahrscheinlichste Erklärung ist, dass die ausgeworfenen relativistischen Elektronen nicht in der Lage sind, Synchrotonstrahlung im Radiobereich auszusenden, weil sie beim Periastron-Durchgang in solch einem starken UV-Strahlungsfeld eingebettet sind, dass sie vollstandig ihre Energie wegen des inversen Compton Prozesses verlieren. Während der zweiten Akkretions-Spitze ist das kompakte Objekt wesentlich weiter weg von seinem Begleitstern und so sind Compton-Verluste geringer: Die Elektronen können aus der Bahnebene heraustreten und man beobachtet Radioausbrüche.
11 APPENDIX: Theory of Very-Long-Baseline-Interferometry Data Analysis
The lack of phase information had prevented VLBI from being a true imaging technique until Rogers and his co-workers (1974) applied a phase closure relationship. The introduction of the closure phase concept marks the beginning of a new era in VLBI. Many authors developed methods, reviewed by Pearson and Readhead (1984), which explicitly or implicitly use this quantity. Massi (1989) showed how the methods explicitly using the closure phase can be unified in one equation. In an attempt to unify all methods together Massi & Comoretto (1990) found that all methods turn out to be particular cases of the method proposed by Schwab (1980) depending on a proper scheme of baseline weighing.
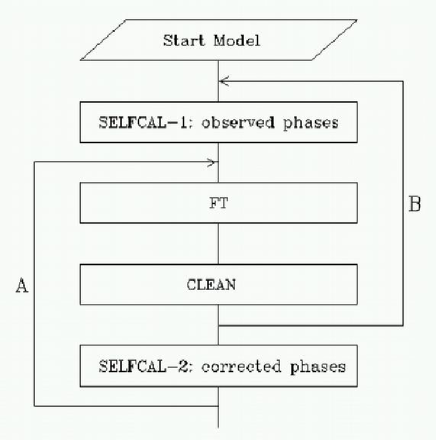
Using Schwab’s method, called self-calibration,a map of the radio source can be obtained by using an algorithm which includes fourier transform and CLEAN, following an iterative procedure first indicated by Readhead and Wilkinson (1978) and called Hybrid mapping (Fig. 38).
That this procedure can converge on wrong solutions has been pointed out by many authors in the past: Walker (1986) indicated the bias in the resultant data due to the use of a point source as starting model. Bååth (1989) suggested the use of the original data set in each iteration of self calibration. Linfield (1986) analysed the role of the (u-v) coverage and lack of intermediate spacing. Generally, the full procedure to avoid false features is not clear and only experience with imaging helps the user to avoid them.
Massi & Aaron (1999) demonstrated that the problem is connected with the non-linear nature of self calibration which leaves initial wrong assumptions frozen in the final solution. We demonstrated that the general precondition to avoid false structures in the map is that the errors (or more precisely their cube) of the model should be smaller than the observed closure phases. This condition, generally satisfied for a standard earth based array, is violated if one telescope of the array is very displaced from the others, as it is for an array including a telescope mounted on a satellite. In this case one should avoid the use of a point like model as starting model. Moreover, one should at each iteration of self calibration, adopt the model derived by CLEAN directly on the original data and not on the corrected data biased by previous wrong solutions (Fig. 38).
Using self calibration it is assumed that the baseline based errors are negligible. In spite of the fact that these baseline errors are quite small their effect on the map’s quality is rather serious. Tests were performed to determine at which level errors limit the obtainable dynamic range with the VLA (Perley 1986), with the VLBA (Briggs et al. 1994), with the Nobeyama Radioheliograph (Koshiishi et al., 1994). Massi and collaborators have performed such an analysis for the European VLBI Network (EVN). The result was that the instrumental polarization (D terms) of the telescopes of the network had an average value of 9 percent arriving at some telescopes at values of 20 percent. For comparison the values of VLBA telescopes were below 2 percent. The instrumental polarization was therefore the main reson for the lower performance of the EVN damaging the dynamic range of the images up a factor of 7 (Massi et al. 1991; 1996; 1997; 1997b; 1997c; 1997d; 1997e; 1998; Massi 1999b).
12 REFERENCES
Apparao, K.M.V.
2000, A&A, 356, 972
Bååth, 1989, Very Long Baseline
Interferometry. Techniques and Applications. ed. M. Felli and R. Spencer.
Klewer Academic Publishers. NATO ASI Series C. Vol.283, pag.206
Belloni, T., Klein-Wolt, M., Méndez, M., van der Klis, M. & van Paradijs, J.
2000, A&A, 355,27
Belloni, T.,
Méndez,M., King, A.R., van der Klis, M. & van Paradijs,
J. 1997a, ApJ., 479, L145
Belloni, T.,
Méndez, M., King, A.R., van der Klis, M. & van Paradijs,
J. 1997b, ApJ., 488, L109
Bondi, H, 1952, MNRAS, 112, 195
Bosch-Ramon, V. & Paredes, J. M.
2004, A&A, 425,1069
Briggs, D.S., Davis, R.J., Conway, J. E. & Walker, R.C.
1994, July 25, VLBA memo 697
Brocksopp, C., Fender, R. P., McCollough, M., Pooley, G. G., Rupen, M. P., Hjellming, R. M., de la Force, C. J., Spencer, R. E., Muxlow, T. W. B., Garrington, S. T. & Trushkin, S.
2002, MNRAS, 331, 765
Cadolle Bel, M., Goldwurm, A.,Rodriguez, J. et al. 2004.
A&A, 426, 659
Casares, J., Ribas, I., Paredes, J. M., Martí, J. &
C. Allende Prieto
2004, MNRAS, submitted
Charles, P.A., & Wagner, R.M.
1996, Sky & telescope, May, 38.
Coppi, P. S. 2002
Bulletin of the American Astronomical Society, Vol. 32, p.1217
Corbel, S., Fender, R. P., Tzioumis, A. K.,
Tomsick, J. A., Orosz, J. A., Miller, J. M.,
Wijnands, R., & Kaaret, P.
2002, Science, 298, 196
Crocker, M.,M., Davis, R., J., Spencer, R., E., Eyres, S., P., S., Bode, M., F.,& Skopal, A.
2002, MNRAS, 335 , 1100
Dulk, G. A., 1985, ARA&A, 23, 169
Eikenberry, S.S., Matthews, K., Morgan, E., Remillard, R.A.,
& Nelson, W. R. 1998, ApJ., 494, L61
Esin, A.A, Narayan, R.,Cui, W., Grove, J.E., & Zhang, S.N.
1998, ApJ, 505, 854
Falcke, H., Körding, E., & Markoff, S.
2004, A&A, 414, 895
Fender, R.P
2004, Compact Stellar X-Ray Sources, W.H.G. Lewin & M. van der Klis (Ed.),
Cambridge University Press, Cambridge, astro-ph/0303339
Fender, R.P. & Belloni, T.
2004, ARA&A, 42, 317
Fender, R.P., Garrington, S.T., McKay, D.J.,
Muxlow, T.W.B., Pooley, G.G., Spencer, R.E., Stirling, A.M., & Waltman, E.B.
1999, MNRAS, 304, 865
Fender, R. P., Hjellming, R. M., Tilanus, R. P. J., Pooley, G. G., Deane, J. R., Ogley, R. N. & Spencer, R. E.
2001, MNRAS, 322 , L23
Fender, R.P., Rayner, D., Trushkin, S.A., O’Brien, K., Sault, R.J., Pooley,
2002, Lect. Notes Phys. 589, 101 astro-ph/0109502
Fender, R.P., Rayner, D., Trushkin, S.A., O’Brien, K., Sault, R.J., Pooley,
G.G., & Norris, R.P.
2002, MNRAS, 330, 212
Fender, R. P., Roche, P., Pooley, G. G.,
Chakrabarty, D., Tzioumis, A. K., Hendry, M. A., Spencer, R.E.
1996
Proceedings of 2nd INTEGRAL workshop : The Transparent Universe’, ESA SP-382
astro-ph/9612080
Fender, R. P., Spencer, R. E., Newell, S. J. & Tzioumis, A. K.
1997, MNRAS, 286, L29
Filippenko, A. V., Leonard, D. C., Matheson, T., Li, W., Moran, E. C., Riess, A. G. 1999, PASP, 111, 969
Fomalont, E. B., Geldzahler, B. J. & Bradshaw, C. F.
2001, ApJ, 558, 283
Frail, D.A., & Hjellming, R.M.
1991, AJ, 101, 2126
Frank, J., King, A. & Raine, D.J. 2002,
Accretion Power in Astrophysics, ARI, CUP
Gallo, E., Corbel, S., Fender, R. P., Maccarone, T. J. & Tzioumis, A. K
2004, MNRAS, 347, 52L
Gallo, E., Fender, R. P. & Pooley, G. G.
2003, MNRAS, 344, 60
Geldzahler, B. J., Johnston, K. J., Spencer, J. H.,
Klepczynski, W. J., Josties, F. J., Angerhofer, P. E., Florkowski, D. R., McCarthy, D. D., Matsakis, D. N.& Hjellming, R. M.
1983, ApJ, .273, 65L
Georganopoulos, M., Kirk, J.G.,& Mastichiadis, A.
2001, ApJ, 561, 111
Gregory, P.C. 2002, ApJ, 575, 427.
Gregory, P.C. & Neish, C. 2002, Ap. J. 580, 1133
Gregory, P.C., & Taylor, A.R. 1978, Nature, 272, 70
Greiner, J., & Rau, A. 2001, A&A 375,145
Hannikainen, D., Wu, K., Campbell-Wilson, D., Hunstead, R., Lovell, J., McIntyre, Vi., Reynolds, J., Soria, R. & Tzioumis, T.
2001, Exploring the gamma-ray universe:, Proc. A. Gimenez, V. Reglero & C. Winkler. (Ed.), ESA SP-459, Noordwijk: ESA Pub. Division,
ISBN 92-9092-677-5, 291
Harrison, F.A., Ray, P.S., Leahy, D.A., Waltman,
E.B.,& Pooley, G.G. 2000, ApJ, 528, 454
Hartman, R.C., Bertsch, D.L., Bloom, S.D., etal.
1999, ApJS, 123, 79
Heinz, S. & Sunyaev, R. A.
2003, MNRAS, 343, 59
Hjellming, R. M., & Johnston, K. J. 1988, ApJ, 328, 600.
Hjellming, R. M. & Rupen, M. P.
1995, Nature, 375, 464
Hjellming, R. M., Rupen, M. P., Hunstead, R. W., Campbell-Wilson, D., Mioduszewski, A. J., Gaensler, B. M., Smith, D. A., Sault, R. J., Fender, R. P., Spencer, R. E., de la Force, C. J., Richards, A. M. S., Garrington, S. T., Trushkin, S. A., Ghigo, F. D., Waltman, E. B. & McCollough, M.
2000, ApJ, 544, 977
Hjellming, R. M., Rupen, M. P., Mioduszewski, A. J., Smith, D. A., Harmon, B. A., Waltman, E. B., Ghigo, F. D. & Pooley, G. G.
1998, AAS, 193, 103.08 (Bull. AAS 30, 1405)
Hujeirat, A.,& Blandford, R. astro-ph/0307317
Hutchings, J.B., & Crampton, D. 1981, PASP, 93, 486
Hutchings, J.B., Nemec, J.M., & Cassidy, J.
1979, PASP, 91, 313
Kaufman Bernadó, M.M., Romero, G.E., & Mirabel, I.F.
2002, A&A, 385, L10
King, A.
1996, X-Ray Binaries, W.H.G. Lewin, J.
van Paradijs & M. van der Klis (Ed.),
Cambridge University Press, Cambridge, 419.
Kniffen, D. A., Alberts, W. C. K., Bertsch, D. L., Dingus, B. L., Esposito, J. A., Fichtel, C. E., Foster, R. S., Hartman, R. C., Hunter, S. D., Kanbach, G., Lin, Y. C., Mattox, J. R., Mayer-Hasselwander, H. A., Michelson, P. F., von Montigny, C., Mukherjee, R., Nolan, P. L., Paredes, J. M., Ray, P. S., Schneid, E. J., Sreekumar, P., Tavani, M. & Thompson, D. J.
1997,ApJ, 486, 126
Kogure, T. 1969, PASJ, 21, 71
Koshiishi, H., Enome, S., Nakajima, H., Shibasaki, K., Nishio, M.,
Takano, T., Hanaoka, Y., Torii, C., Sekiguchi, H., Kawashima, S.,
Bushimata, T., Shinohara, N., Irimajiri, Y. & Shiomi, Y.
1994, PASJ, 46, L33
Leahy, D. A. 2001 A&A, 380,516
Leahy, D.A., Harrison, F.A.,& Yoshida, A. 1997, ApJ, 475, 823
Linfield R. P., 1986, A. J. 92, 21
Liu, Q.Z., Hang, H.R., Wu, G.J., Chang, J.,& Zhu, Z.X.
2000, A&A, 359, 646
Liu, Q.,Z., van Paradijs, J., & van den Heuvel, E.P.J.
2000, A&AS, 147, 25
Liu, Q.,Z., van Paradijs, J.,& van den Heuvel, E.P.J.
2001, A&A, 368, 1021
Longair, M.S. 1994,
High Energy Astrophysics, Vol. 2,
Stars, the Galaxy and the interstellar medium,
Cambridge University Press, Cambridge, 135.
Maccarone, T. J. 2004,
MNRAS 351, 1049
Maraschi, L.,& Treves, A. 1981, MNRAS, 194, 18
Margon, B.A.
1979 IAUC, 3345, 1
Margon, B.A.
1980, Sci. Am. 243, 54
Margon, B.A. 1984, ARA&A, 22, 507
Martí, J., & Paredes, J.M. 1995, A&A, 298, 151
Massi, M.
1989, A&A, 208, 392
Massi, M.
1999, Dissertation, The Dynamo and the Emission Processes in the Stellar System UX Arietis. University Bonn
Massi, M.
1999b, EVN Doc. n.91
Massi, M.
2003, Recent Research Developments in Astronomy & Astrophysics,
eds. A. Gayathri (Ed.), Kerala, India 700-712 (2003)
Massi, M.
2004, A&A, 422, 26
Massi, M.
2004b, proc. 7th EVN Symposium. Bachiller,Colomer,Desmurs,de Vicente (eds) October 12th-15 2004, Toledo, Spain astro-ph/0410502
Massi, M., & Aaron, S.
1997c, EVN Doc. n. 75
Massi, M., & Aaron, S.
1997d, EVN Doc. n. 77
Massi, M.& Aaron, S.
1999, A&AS, 136, 211
Massi, M., & Comoretto, G.
1990, A&A, 228,569
Massi, M., Comoretto, G., Rioja, M., & Tofani G.
1996, A&A Suppl., 116, 167
Massi, M., Menten, K.,& Neidhöfer, J. 2002, A&A, 382, 152.
Massi, M., Paredes, J.M., Estalella, R.,& Felli, M.
1993, A&A, 269, 249
Massi, M., Ribó, M., Paredes, J.M., Peracaula, M., & Estalella, R.
2001, A&A, 376, 217
Massi, M., Ribó, M., Paredes, J.M., Garrington, S.T.,
Peracaula, M., & Martí, J.
2004, A&A, 414, L1
Massi, M., Ribó, M., Paredes, J.M., Garrington, S.T.,
Peracaula, M., & Martí, J.
2004b, proc. of the Symposium on High-Energy Gamma-Ray Astronomy, Heidelberg, July 26-30, 2004 (AIP Proceedings Series)
astro-ph/0410504
Massi, M., Ribó, M., Paredes, J.M.,
Peracaula, M., Martí, J., & Garrington, S.T.
2002b, The 4th Microquasar Workshop, Ph. Durouchoux, Y. Fuchs & J. Rodriguez,
(Ed.), Center for Space Physics, Kolkata, 238
Massi, M. Rioja, M., Gabuzda, D., Leppanen,K.
Sanghera,H., Ruf, K., & Moscadelli L.
1997, A&A, 318, L32
Massi, M. Rioja, M. Gabuzda, D. Lepp”anen, K. Sanghera, H. Ruf, & K. Moscad
elli, L.
1997b, Vistas in astronomy, vol. 41, Part 2
Massi, M., Ruf, K., & Orfei S.
1998, EVN Doc. n.85
Massi, M. Tofani, G. & Comoretto, G.
1991,A&A, 251, 732
Massi, M., Tuccari, G., & Orfei, S.
1997e, EVN Doc 81
Matsumoto, R., Uchida, Y.,Hirose, S., Shibata, K., Hayashi, M.R., Ferrari, A.,
& Bodo,G.
1996, ApJ, 461, 115.
McClintock, J.E., & Remillard,R.A.
2004, Compact Stellar X-Ray Sources, W.H.G. Lewin & M. van der Klis (Ed.),
Cambridge University Press, Cambridge, astro-ph/0306213
Meier, D. L. 2001
ApJ, 548, 9
Meier, D. L., Koide, S.,& Uchida, Y. 2001, Science, 291, 84.
Mendelson, H., & Mazeh, T. 1989 MNRAS 239, 733
Merloni, A., Fabian, A. C. & Ross, R. R.
2000, MNRAS, 313, 193
Merloni, A., Heinz, S., & di Matteo, T.
2003, MNRAS 345, 1057
Meyer, F., Liu, B.F & Meyer-Hofmeister, E.
2000, A&A 354, L67
Mioduszewski, A. J., Hjellming, R. M. & Rupen, M. P.
1998, AAS, 192, 7402
Mirabel, I.F., Dhawan, V., Chaty, S., Rodríguez, L.F.,
Martí, J., Robinson, C.R., Swank, J., & Geballe, T.R.
1998, A&A, 330, L9
Mirabel, I.F.,& Rodríguez, L.F.
1994, Nature, 371, 46
Mirabel, I.F., & Rodríguez, L.F. 1999, ARA&A, 37, 409
Mirabel, I. F., Rodriguez, L. F., Cordier, B.; Paul, J.;& Lebrun, F.
1992, Nature, 358, 215
Mitsuda, K., Inoue, H., Koyama, K., Makishima, K., Matsuoka, M.,
Ogawara, Y.,Shibazaki, N., Suzuki, K.,& Tanaka, Y.
1984, PASJ 36, 741
Narayan, R., & Heyl, J.S.
2002, ApJ, 574, 139
Paredes, J.M., Estalella, R. & Rius, A. 1990,
A&A, 232, 377
Paredes, J.M. & Figueras, F. 1986
A&A, 154, L30
Paredes, J.M., Marti, J., Estalella, R. & Sarrate, J.
1991, A&A, 248, 124
Paredes, J.M., Marti, J., Peracaula & M., Ribo, M. 1997,
A&A, 320 ,L25
Paredes, J. M., Martí, J., Ribó, M., & Massi, M.
2000, Science, 288, 2340
Paredes, J.M., Massi, M., Estalella, R., & Peracaula, M.
1998, A&A, 335, 539
Pearson, T. J. & Readhead, A. C. S.
1984, ARA&A, 22, 97
Peracaula, M., Gabuzda, D. C., & Taylor, A. R.
1998, A&A, 330, 612
Peracaula, M., Martí, J.,& Paredes, J.M.
1997, A&A, 328, 283
Perley, R. A.
1986, ”Syntesis Imaging” proc. NRAO eds R.A. Perley,
F.R. Schwab & A. H. Bridle, p.290
Punsly, B. 1999, ApJ, 519, 336
Readhead, A. C. S. &Wilkinson, P. N.
1978, ApJ, 223, 25
Rhoades, C.E. & Ruffini, R. 1974
Physical Review Lett., 32, 324
Rodriguez, L. F., Mirabel, I. F., & Marti, J.
1992, ApJ, 401, L15
Rogers, A. E. E., Hinteregger, H. F., Whitney, A. R., Counselman, C. C., Shapiro, I. I., Wittels, J. J., Klemperer, W. K., Warnock, W. W., Clark, T. A. & Hutton, L. K.
1974, ApJ, 193, 293
Sams, B.,Eckart, A., & Sunyaev, R. 1996, Nature, 382, 47
Schalinski, C. J., Johnston, K. J., Witzel, A.
Parsec-scale radio jets, Proc.
Schalinski, C. J., Johnston, K. J., Witzel, A., Spencer, R. E., Fiedler, R., Waltman, E., Pooley, G. G., Hjellming, R. & Molnar, L. A.
1995, ApJ, 447, 752S
Schwab F. R., 1980, Proc. Soc. Photo-Opt. Inst. Eng. 231,18
Shakura, N.I.,& Sunyaev, R.A.
1973,A&A,24, 337
Spencer, R. E. 1979 Nature, 282, 483
Spencer, R. E., Swinney, R. W., Johnston, K. J., & Hjellming, R. M.
1986, ApJ, 309, 694
Stewart, R. T., Caswell, J. L., Haynes, R. F. & Nelson, G. J.
1993, MNRAS. 261, 593
Stirling, A.M., Spencer, R.E., De la Force, C.J., et al.
2001, MNRAS, 327, 1273
Tanaka,Y.
1997, Accretion Disks-New Aspects, E. Meyer-Hofmeister & H. Spruits (Ed.),
Lecture Notes in Physics 487.
Springer-Verlag Berlin Heidelberg New York, 1
Taylor, A.R., Dougherty, S.M., Scott, W.K., Peracaula, M., & Paredes, J.M.
2000, Astrophysical Phenomena Revealed by
Space VLBI,
H. Hirabayashi, P.G. Edwards, & D.W. Murphy (Ed.), ISAS, 223
Taylor, A.R., & Gregory, P.C. 1982, ApJ, 255, 210.
Taylor, A.R., Kenny, H.T., Spencer, R. E.,& Tzioumis, A. 1992,
ApJ, 395,268
Taylor, A.R., Young, G., Peracaula, M., Kenny, H.T.,& Gregory, P.C.
1996, A&A, 305, 817
Tavani, M., Kniffen, D., Mattox, J.R., Paredes, J.M., & Foster, R.S.
1998, ApJ, 497, L81
Tennant, A. F., Fabian, A. C., & Shafer, R. A.
1986, MNRAS, 221, 27
Tingay, S. J., Jauncey, D. L., Preston, R. A., Reynolds, J. E., Meier, D. L., Murphy, D. W., Tzioumis, A. K., McKay, D. J., Kesteven, M. J., Lovell, J. E. J., Campbell-Wilson, D., Ellingsen, S. P., Gough, R., Hunstead, R. W., Jones, D. L., McCulloch, P. M., Migenes, V., Quick, J., Sinclair, M. W. & Smits, D
1995, Nature, 374, 141
Torricelli, G. Franciosini, E., Massi, M., Neidhöfer, J.
1998, A&A, 333, 970
Ulrich, M., Maraschi, L., & Urry, C.M.
1997, ARAA, 35, 445
Van der Klis, M.
2004, Compact Stellar X-Ray Sources, W.H.G. Lewin & M. van der Klis (Ed.),
Cambridge University Press, Cambridge, astro-ph/0410551
Van der Laan, H. 1966, Nature, 211, 1131
Van Paradijs, J. & McClintock, J.E. 1996
1996, X-Ray Binaries, W.H.G. Lewin, J.
van Paradijs & M. van der Klis (Ed.),
Cambridge University Press
Verbunt, F., & van den Heuvel, E.P.J.
1996, X-Ray Binaries, W.H.G. Lewin, J.
van Paradijs & M. van der Klis (Ed.),
Cambridge University Press
Wallace, P.M., Griffis, N.J., Bertsch, D.L., Hartman, R.C., Thompson, D.J.,
Kniffen, & D.A., Bloom, S.D.
2000, ApJ, 540, 184
Waters, L.B.F.M., van den Heuvel, E.P., Taylor, A.R., Habets, G.M.H.J.,
& Persi, P. 1988, A&A, 198, 200.
White, N.E., Nagase, F., & Parmar, A.N.
1996, X-Ray Binaries, W.H.G. Lewin, J.
van Paradijs & M. van der Klis (Ed.),
Cambridge University Press, Cambridge, 1, 33, 6
Zamanov, R. K.
1995, MNRAS, 272, 308
Zamanov, R. K., Reig, P., Martí, J., Coe, M. J., Fabregat, J., Tomov, N. A., Valchev, T.
2001, A&A, 367, 884
Zamanov, R.K., Martí, J. 2000, A&A, 358, L55
Zdziarski, A. A., Grove, J. E., Poutanen, J., Rao, A. R. & Vadawale, S. V.
2001, ApJ, 554, 45L
Zhang, S. N., Cui, W., Harmon, B. A., Paciesas, W. S., Remillard,
R. E., & van Paradijs, J. 1997, ApJ, 477, L95
13 DANKSAGUNG
Mein besonderen Dank gilt Prof. Ulrich Mebold für die Gelegenheit diese Arbeit durchzuführen und Prof. Karl Menten für seine stetige Unterstützung und sein kontinuierliches Interesse an diesem Projekt.
Die Resultate dieser Arbeit wurden über die letzten Jahre in Zusammenarbeit mit vielen Kollegen gewonnen; für die Arbeit mit dem VLBI-, EVN- und MERLIN- Netzwerk sei besonders Marc Ribó, Prof. Josep Paredes, Prof. Josep Martí, Simon Garrigton and Marta Peracaula gedankt.
Ich möchte Prof. Ralph Spencer für seine hilfreichen Kommentare, Prof. Rolf Chini für seine Unterstützung und Jürgen Kerp für alle seine wichtigen praktischen Ratschläge danken.
Meinem Mann, Jürgen Neidhöfer gilt mein Dank für die zahlreichen Diskussionen, die unseren gemeinsamen Interessen an den physikalischen Prozessen von Doppelstern-System and ihren Periodizitäten galten, und für die kritische Durchsicht des Manuskripts.
Danken möchte ich auch meinen beiden Söhnen Guido und Claudio für ihre Geduld, wenn ich einige ”sekundäre” Sachen wie ”die Wäschebügeln” wochen lang verschoben habe.
14 ABSTRACT
The Astrophysics of microquasars - galactic miniatures of the far distant quasars - has become one of the most active fields of modern Astronomy in recent years. Here I review the astronomical methods used for the investigation of these objects, from Gamma-rays over X-rays and optical to radio wavelengths. The description of each astronomical method is always followed by an examplary application on the source LS I+61 303, one of the most observed Be/X-ray binary systems because of its periodical radio emission and strong, variable Gamma-ray emission.