Photometric Accretion Signatures Near the Substellar Boundary
Abstract
Multi-epoch imaging of the Orion equatorial region by the Sloan Digital Sky Survey has revealed that significant variability in the blue continuum persists into the late-M spectral types, indicating that magnetospheric accretion processes occur below the substellar boundary in the Orion OB1 association. We investigate the strength of the accretion-related continuum veiling by comparing the reddening-invariant colors of the most highly variable stars against those of main sequence M dwarfs and evolutionary models. A gradual decrease in the band veiling is seen for the cooler and less massive members, as expected for a declining accretion rate with decreasing mass. We also see evidence that the temperature of the accretion shock decreases in the very low mass regime, reflecting a reduction in the energy flux carried by the accretion columns. We find that the near-IR excess attributed to circumstellar disk thermal emission drops rapidly for spectral types later than M4. This is likely due to the decrease in color contrast between the disk and the cooler stellar photosphere. Since accretion, which requires a substantial stellar magnetic field and the presence of a circumstellar disk, is inferred for masses down to 0.05 M⊙ we surmise that brown dwarfs and low mass stars share a common mode of formation.
peregrin@apo.nmsu.edu 22affiliationtext: New Mexico State University, Department of Astronomy, P.O. Box 30001, Dept 4500, Las Cruces, NM 88003 33affiliationtext: Department of Astronomy, University of Washington, Box 351580, Seattle, WA 98195 44affiliationtext: Los Alamos National Laboratory, ISR-4, MS D448, Los Alamos, NM 87545 55affiliationtext: Department of Physics & Astronomy, University of Wyoming, 1000 E. University Blvd., Laramie, WY 82071 66affiliationtext: Apache Point Observatory, 2001 Apache Point Road, Sunspot, NM 88349
1 Introduction
Brown dwarfs are defined as objects that have less than the minimum mass required for stable Hydrogen fusion. In the absence of rotation and for solar metallicity this mass, referred to as the hydrogen-burning limit, is 0.075 M⊙ or 79 MJup (Chabrier & Baraffe, 2000). Young brown dwarfs are fully convective with photospheric temperatures comparable to M stars. In the models of Baraffe et al. (1998) 2 Myr old proto-brown dwarfs of masses 0.020 M⊙ up to the hydrogen-burning limit have temperatures between 2500 K and 2900 K, corresponding to spectral types of M8.5 to M6 (Luhman, 2003). The presence of a circumstellar disk in combination with the ability of fully convective objects to generate significant magnetic fields should result in young brown dwarfs exhibiting Classical T Tauri behavior (Jayawardhana, Mohanty, & Basri, 2002).
The young brown dwarfs in this paper are found as isolated objects within the Orion OB1 star formation region. Distances and inferred ages of the Orion OB1a,b,c, and d subassociations are given in Table 1 (from Sherry (2003)). There are two possible scenarios for brown dwarf formation: (1) individual formation out of isolated low-mass molecular cores, just as stars are presumed to form from higher-massed cores, and (2) ejection of the lowest massed objects from a cluster though dynamical interactions. In the latter scenario, objects are ejected before accreting enough material to grow into stars, thereby forming brown dwarfs (Reipurth & Clarke, 2001; Kroupa et al., 2003).
Consequences of the ejection process include a broader spatial distribution, increased velocity dispersion for the lower massed objects, and a truncation of the circumstellar disk via tidal forces. The ejection velocity dispersion is of order 5 km/sec corresponding to a dispersion in proper motion of 2.6 mas/yr at the 400 pc distance of Orion. Models of the ejection process (Armitage & Clarke, 1997) predict that the disk will be truncated to an outer radius of 10 AU or less, resulting in disk lifetimes of less than 1 Myr. In order to differentiate the star-like and ejection formation scenarios we examine observational signatures, such as Classical T Tauri behavior, that are due to the presence of a circumstellar disk.
1.1 Accretion Signatures in T Tauris
T Tauri variables were originally identified by Joy (1945) as a class of irregular variable stars exhibiting marked changes in brightness and color on timescales of hours to days. These changes are greatest in the blue and ultraviolet (Herbst et al., 1994), and are expected to be related to disk accretion. Magnetospheric accretion models (Königl, 1991) predict that the inner circumstellar disk is truncated by the magnetic field of the star. For accretion to occur the truncation must be at or within the Keplerian co-rotation radius, at which the orbital period of the disk matches that of the star’s rotation.
Disrupted disk material flows towards the star in accretion columns that follow the magnetic field lines connecting the inner edge of the disk with the high latitude regions of the star. As evidenced by the broad velocity profiles observed in H and other spectral features, much of the permitted line emission arises in these columns. Other emission lines, including He I and the broad component of the Ca II IR triplet, plus the veiling blue and ultraviolet continua arise in the high temperature shock fronts at the base of the accretion columns near the stellar surface (Gullbring et al., 2000). The lifetime of the classical T Tauri phase is thought to be 1 to 10 Myr (Kenyon & Hartmann, 1995).
Protostellar magnetospheric accretion is one of a dynamic process characterized by intricate magnetic field topologies and unstable field-disk interactions. Detailed MHD computations by Romanova (2002), Küker, Henning, & Rüdiger (2003), and von Rekowski & Brandenburg (2003) indicate that even for the idealized case of a dipole field aligned with the stellar rotation axis the accretion process is fundamentally unstable. An intensive photometric and spectroscopic campaign targeting the nearly edge-on Classical T Tauri AA Tau by Bouvier (2003) shows clear evidence for large scale instabilities developing in T Tauri magnetospheres as the magnetic field lines are twisted by differential rotation between the star and the inner disk. Observational support of magnetospheric accretion in AA Tau includes time delays between the H, H, He II line emission and the accretion shock generated emission consistent with free-fall from 8 stellar radii and the presence of two rotationally modulated hot spots.
1.2 Accretion in Very Low Mass Stars and Brown Dwarfs
There has been considerable effort over recent years to observe and characterize the formation processes in young very low mass stars and brown stars. This has included analyses of spectroscopic signatures of accretion, veiling measurements, variability studies, and IR searches for circum(sub)stellar disk emission.
1.2.1 Emission Lines
H emission lines with widths in excess of 200 km/s have been detected in young brown dwarfs having masses as low as 20 MJup in many star formation regions including IC 348, Taurus, Chamaeleon I, Upper Scorpius, and Oph (Jayawardhana, Mohanty, & Basri, 2002; Muzerolle et al., 2003; Natta et al., 2004; Mohanty, Jayawardhana, & Basri, 2005; Muzerolle et al., 2005). The mass accretion rate appears to scale roughly as which is steeper than the linear relation inferred by White & Basri (2003) based on studies in Taurus-Auriga. In addition, the uncertainties in the determination of stellar parameters (mass, radius) from evolutionary models of very low mass objects (Baraffe et al., 2002) during first few Myr contribute another source of uncertainty in these relations. However, Padoan et al. (2005) propose that the accretion rate is controlled by accretion from the surrounding gas in the star formation region rather than from the disk evolution. The resulting Bondi-Hoyle accretion model yields trends consistent with the Muzerolle et al. (2003) relation although the validity of this hypothesis needs to be checked through detailed observations and simulations.
Natta et al. (2004) find that the mass accretion rate scales exponentially with the width of the H line measured at the 10% intensity level by comparing previous results in the substellar domain (Muzerolle et al. (2003), White & Basri (2003), and Barrado y Navascues et al. (2004)) with observations in Chamaeleon I and Oph and study of Classical T Tauri stars(Gullbring et al., 1998). The lowest detected accretion rates are on the order of M⊙/yr.
1.2.2 Optical Veiling
Optical veiling measurements of young brown dwarfs have been primarily obtained redward of 6000 Å. Barrado y Navascues, Mohanty, & Jayawardhana (2004) find = 1.0 and = 0.25 from the infilling of several TiO bands in the very low mass object LS-RCrA 1, where is the ratio of the excess emission to the photospheric emission measured at a wavelength (). Due to the presence of [S II], [O I], [O II], and [N II] forbidden lines in the spectra they propose that this substellar object is driving an outflow analogous to that which forms the Herbig-Haro shocks seen near intermediate and low mass T Tauri stars.
Accretion shock models for very low mass stars (Muzerolle et al., 2000) suggest that accretion rates as low as M⊙/yr would be detectable in the Johnson V band against an M6 photosphere. We expect a greater sensitivity to accretion rates when working in the Sloan Digital Sky Survey (SDSS) band due to increased brightness contrast between the shock and the photosphere.
1.2.3 Variability
Optical photometric variability of low mass pre-main sequence stars is the result of four physical effects. These are rotational modulation of cool spots, rotational modulation of hot spots formed at the base of magnetospheric accretion columns, instabilities in the mass accretion rate, and flaring.
The study by Herbst et al. (1994) finds three distinct patterns of variability in Weak-lined T Tauris (WTTS) and Classical T Tauris (CTTS). The Type I variables are characterized by low amplitude multi-band fluctuations on timescales of to 18 days. This behavior is primarily seen in WTTS but can been detected in some WTTS. The second type of variation only occurs in the CTTS and is marked by ireegular high amplitude brightness changes, especially in the near ultraviolet and the blue, on timescales as short as a few hours. The Type III variations, like the Type II, are irregular but occur on much longer timescales of days to weeks. This last category are only seen in pre-main sequence stars having early spectral types (AO to K1).
Type I variations are believed due to rotational modulation of cool spots on the stellar surface. These spots are a consequence of the magnetic activity and can persist for over 100 rotational periods yielding periodic variations in . Flaring is often seen in the and especially bands. WTTS only exhibit Type I variations. When magnetospheric accretion is present, i.e. in the CTTS stage, then Type II variations are seen. These are due to a combination of rotational modulation of the accretion hot spots together with short period fluctuations in the mass accretion rate. In most cases the variations in the accretion mask the rotation signature. Herbst et al. (1994) also identify a third class (Type III) variables such as RY Tau and SU Aur that exhibit large non-periodic variation in the band but do not show significant veiling. This behavior is thought to be caused by variable obscuration but is also limited to intermediate and high-mass stars (spectral types A0 to K1); we do not expect to find Type III variables in our low-mass sample.
In this sample of intermediate and low mass T Tauris Herbst et al. (1994) find that the maximum amplitudes seen in Type I variables are 0.8 magnitudes in and 0.5 magnitudes in for V410 Tau (SpT = K3). For the Type I variables of spectral type M0 and later the band amplitudes are typically less than 0.3 magnitudes.
Variability studies of young very low mass stars and brown dwarfs have primarily used the longer wavelength filters, most notably the Johnson-Cousins . Herbst et al. (2002) utilized an intermediate band filter centered at 815.9 nm to study variability in the Orion Nebula Cluster and found that 46% of the stars with were periodic, where is the standard deviation measured over all observations for a star. Only 24% having were periodic, the majority exhibited the irregular variation characteristic of Type II variables.
In their study of IC 348 Cohen, Herbst, & Williams (2004) found that the full range of variation for periodic stars of spectral type M0-M4 or later is magnitudes in the band. No CTTS exhibited periodic variability over 5 seasons of monitoring. Cohen, Herbst, & Williams (2004) also characterized the variability in their sample by finding that in their subsample the WTTS had and the CTTS were found to have . Only the Type II variables (CTTS) had .
The survey of the Cha I star formation region in , , and by Joergens et al. (2003) found that the largest amplitudes in each band were 0.18, 0.14, and 0.13, respectively. The earliest spectral type in the sample was M5, corresponding to a maximum mass of 0.12 M⊙. These objects showed periodic variations, presumably due to spots, whose peak-to-peak amplitudes drop in later spectral types.
band monitoring of the Ori and Ori clusters were performed by Scholz & Eislöffel (2004a) and Scholz & Eislöffel (2005). They found that periodic variables had amplitudes less than 0.2 magnitudes. The larger amplitude variables were generally non-periodic. S Ori 45, a 20 Jupiter mass member of the Ori cluster (SpT = M8.5) was studied by Zapatero Osorio et al. (2003) in the bands who measured a periodic peak to peak amplitude magnitudes.
Caballero et al. (2004) find that nine out of 32 young brown dwarf candidates (spectral types M5.5 to L2) exhibit band variability. The amplitudes of mid-term (day-to-day) variations were as high as 0.36 magnitudes while shorter term variations had standard deviations 0.05 magnitudes. Correlations were found between high amplitude variability ( magnitudes) and detection of either a near-IR excess or strong H emission indicative of a possible accretion disk.
1.2.4 Near-IR Excess
The thermal emission from the inner circumstellar disk can be detected in the near-IR and bands (Meyer, Calvet, & Hillenbrand, 1997). For the less massive and cooler young brown dwarfs the reduced contrast between the disk emission and the substellar photosphere motivates disk surveys in band. An band survey by Liu, Najita, & Tokunaga (2003) finds that for low mass stars and substellar objects in IC 348 and Taurus the disk fraction is not dependent on mass or age and that the presence of disk emission is associated with accretion indicators such as H emission.
Comparison of disk models with mid-IR photometry shows that the disks surrounding young brown dwarfs can be flared like those around Classical T Tauri stars (Mohanty et al., 2004). The model fits also suggest the presence of inner holes that are a few substellar radii in size.
1.3 The Orion Equatorial Region
The Orion OB1 a,b,c and d sub-associations have been the targets of several surveys. These include the optical photometric and spectroscopic study of the Ori cluster in Orion OB1b by Walter, Wolk, & Sherry (1998), the H Kiso object prism survey (Wiramihardja et al., 1989), and the ROSAT All-Sky Survey (Alcalá et al., 1996). With the exception of the Orion Nebula Cluster (OB1d) these are found along the celestial equator and are considered in this study. The estimated ages span 1.7 Myr to 11.4 Myr with distances between 330 and 460 parsecs corresponding to distance moduli of 7.6 to 8.3 magnitudes.
Recent imaging surveys of the Orion equatorial region include Wolk (1996), Sherry (2003), and Briceño (2003). Wolk (1996) performed photometric monitoring of X-ray selected stars in the Orion OB1a and OB1b associations with an estimated completeness limit of = 18.5. Sherry (2003) conducted a deeper survey covering 5 square degrees in Orion OB1b around Ori, Ori, and Ori using the CTIO 0.9 and 1.5 meter telescopes. Their adopted faint limit was = 20.5. The band photometry was not analyzed.
The CIDA-QUEST variability survey (Briceño, 2003) is acquiring multi-epoch drift-scanned imaging in the Orion equatorial region using the 1.0/1.5 meter Schmidt telescope at The National Astronomical Observatory of Venezuela. Exposures are acquired in the VRIH bands at a plate scale of 1.02” per pixel. The 10 limit is approximately although in selection of candidate pre-main sequence stars they specify (Briceño, 2004), resulting in a minimum mass limit of 0.12 M⊙.
Studies of neighboring regions include Barrado y Navascues et al. (2004) who performed a deep survey of the Orionis cluster (d = 400 pc; 5 Myr) with the CFHT 12K camera. Their completeness limits were 22.75 in both bands with the lowest mass confirmed cluster member having 0.02 M⊙ with a spectral type of M8.5. Studies of NGC 2264 including S Mon and the Cone Nebula region (Rebull et al., 2002) and of the Orion Nebula Flanking fields (Rebull et al., 2000) explicitly used ultraviolet and near-IR excess as disk indicators. Their limiting magnitudes are , , and .
1.4 Program
The goal of this paper is to study the trends in veiling emission, variability, and near-infrared excess in the low mass stars and brown dwarfs found in the Orion OB1a,b, and c subassociations. If brown dwarfs form in the same manner as stars we expect that these characteristics will vary smoothly across the stellar/substellar mass boundary.
The remainder of this paper is organized as follows: the SDSS and Two Micron All-Sky Survey (2MASS) observations used in this paper are presented in §2. In §3 we discuss the expected colors of young mass stars and brown dwarfs using the colors of spectroscopically verified field M dwarfs (West et al., 2004), the evolutionary models of Baraffe et al. (1998) (hereafter BCAH98), and the bolometric corrections of Girardi et al. (2004). The selection criteria for young low mass objects including an estimate on the contamination fraction are presented in §4. We discuss the empirical trends in variability and color in §5 and in §6 we provide a summary of results and upcoming work.
2 Observations
2.1 Photometry
The Sloan Digital Sky Survey (SDSS) obtains deep photometry with magnitude limits (defined by 95% detection repeatability for point sources) of , , , and . These five passbands, , have effective wavelengths of 3540, 4760, 6290, 7690, and 9250 Å, respectively. A technical summary of the SDSS is given by York et al. (2000). The SDSS imaging camera is described by Gunn et al. (1998). Ivezić et al. (2004) discuss the data management and photometric quality assessment system.
The Early Data Release and the Data Release One are described by Stoughton et al. (2002) and Abazajian et al. (2003). The former includes an extensive discussion of the data outputs and software. Pier et al. (2003) describe the astrometric calibration of the survey and the network of primary photometric standard stars is described by Smith et al. (2002). The photometric system itself is defined by Fukugita et al. (1996), and the system which monitors the site photometricity by Hogg et al. (2001). Abazajian et al. (2003) discuss the differences between the native SDSS 2.5m system and the standard star system defined on the USNO 1.0 m (Smith et al., 2002).
The SDSS low Galactic latitude data which includes the Orion equatorial imaging used in this work are described by Finkbeiner et al. (2004). 2MASS (Skrutskie et al., 1997) obtained nearly complete coverage of the sky in . The multi-epoch data (Table 2) we use in this study were obtained under photometric conditions and cover and .
2.2 Reddening-Invariant Indices
In this work we employ reddening-invariant indices of the form . is dependent upon the assumed ratio of general to selective extinction (; Cardelli, Clayton, & Mathis (1989)). Here refer to the specific passbands, e.g. and is the color excess due to reddening in the color. This definition of reddening-invariant colors follows the original Johnson & Morgan (1953) that would be written as in our notation. In the color-color diagram the axis is perpendicular to the reddening vector.
This approach has previously been used to study pre-main sequence populations by de Geus, de Zeeuw, & Lub (1989) and Brown, de Geus, & de Zeeuw (1994) for the Scorpius-Centaurus OB and Orion OB1b associations, respectively. In both cases reddening-invariant colors were formed by . using the Walraven system. Stellar parameters were estimated using reddening-invariant two-color diagrams to compare observed stellar colors against those from Kurucz model grid (Kurucz, 1979).
While the contrast between the accretion shock and the cool photosphere is greatest in the SDSS band, we choose not to use the color due to sensitivity issues and the presence of a “red leak” in the SDSS imager filter. M dwarfs are 2.5 magnitudes fainter in than in , thus use of the band in Orion would not reach young brown dwarfs.
We use the extinction tables derived by D. Finkbeiner111private communication; see http://www.astro.princeton.edu/dfink/sdssfilters/ to define the coefficients used in defining reddening-invariant colors. These tables contain the values for the SDSS filters for specific values of and source spectra. The values we present here are obtained using an F dwarf source spectrum and = 3.1 and 5.5. The case is the standard extinction law found in the diffuse ISM. The law is representative of that found in molecular clouds due to larger dust grains and is shown here for example. Throughout this paper we will adopt as it is characteristic of all but perhaps the most heavily extincted regions of the Orion OB1b association (Warren & Hesser, 1978).
| (1) |
and
| (2) |
The near-IR reddening-invariant color is independent of the value of , from Schlegel, Finkbeiner, & Davis (1998) we obtain
| (3) |
3 Expected Colors of Young Brown Dwarfs
In this section we compare the expected colors of young brown dwarfs against those of field M dwarfs of equivalent temperatures. Examination of the temperature - surface gravity (Figure 1) relations based on the BCAH98 models shows for objects at the Hydrogen Burning Limit younger than 10 Myr the effective temperature ranges between 2900 K and 3000 K and the surface gravity varies from log(g) = 3.5 to 4.2.
When the locations in Hertzsprung-Russell diagrams of spectroscopically classified and presumably co-eval stars in specific star formation regions are compared against evolutionary models the inferred ages mismatch using the spectral type to scale defined for disk dwarfs. This has led to the adoption of a semi-empirical temperature scale intermediate between that of the dwarfs and the giants (Luhman, 2003). This practice is motivated by the surface gravities expected in pre-main sequence stars and results in effective temperatures several 100 K warmer at a given spectral type. Thus a of 2900 K corresponds to a spectral type of M4.5 for a dwarf (Reid & Hawley, 2000) but of M6.5 for a pre-main sequence star.
The photospheric colors of M dwarfs and M giants differ at the later spectral types with the M giants becoming bluer due to surface gravity effects. This color shift with lower surface gravity is due to the change in the optical depth for the formation of molecules, most importantly TiO, that dominate the stellar spectrum. Luhman (1999) notes that for objects of later spectral types, e.g. M8, the trend is reversed with the lower surface gravity stars becoming redder longward of 8500 Å. Due to these deviations from disk dwarf colors UV-excess and blue-excess techniques based on the ZAMS become ambiguous for pre-main sequence stars later than M4 (Rebull et al., 2000).
3.1 Disk Dwarf Colors
Figure 2, based on the sample of West et al. (2004), shows that the color index increases towards cooler spectral types among M dwarfs, reaching a maximum value at M8. At the ages in which we expect to see accretion activity this turnover occurs for objects near 0.02 which are too faint to be included in this survey.
To study the change in relative to the disk dwarf locus we obtain linear fits between and using photometry of M dwarfs in the SDSS Third Data Release (DR3; Abazajian et al. (2005)) obtaining
| (4) |
using a minimum threshold to of 0.5 to avoid the slope change in the color-color diagram at the earliest M dwarfs. The fit residuals have RMS values of 0.148 and 0.117 for = 3.1 and 5.5, respectively.
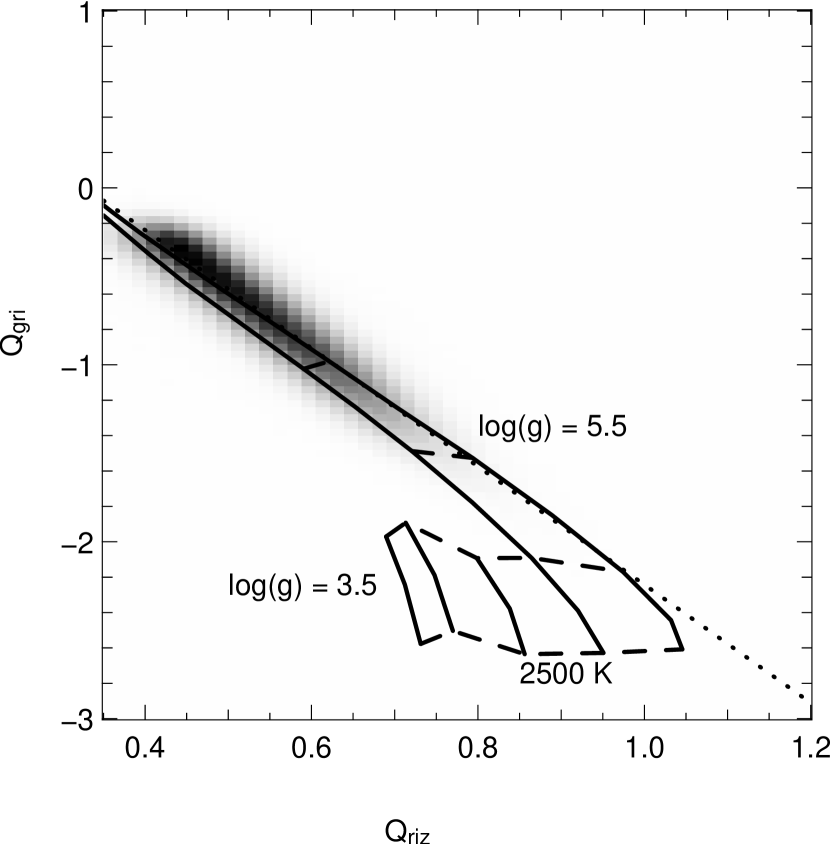
The reddening-invariant two-color diagram is shown in Figure 3 with the theoretical isochrones of Girardi et al. (2004) overplotted. These isochrones are based on the “AMES” (4000 K 2800 K) and “AMES-dusty” (2800 K 500 K) model atmospheres of Allard, Hauschildt, & Schwenke (2000) for cool stars and brown dwarfs. While the latter cover log(g) between 3.5 and 6.0, the bolometric corrections were only computed for the warmer “AMES” models having log(g) of 5.5 and 6.0.
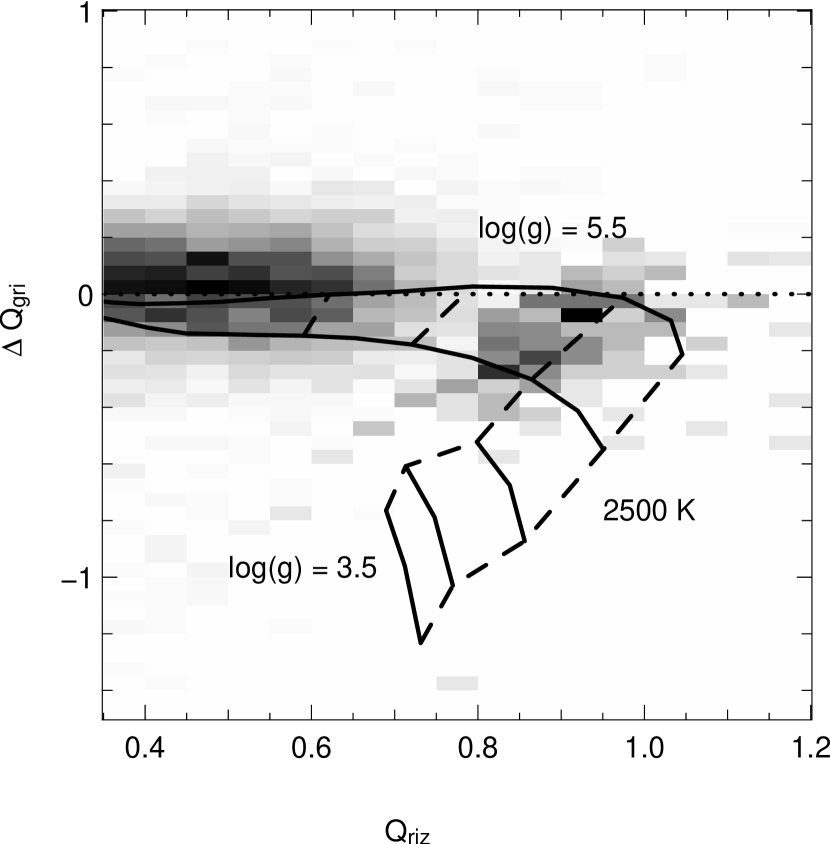
The fit residuals () are plotted against for the model isochrones and the spectroscopic sample of West et al. (2004). For the purposes of illustration this M dwarf sample is subdivided at M4.5 with the two resulting histograms in color-color space scaled to match peak counts. As is seen in Figure 4 the observed reddening-invariant colors are well-described by the log(g) = 5.0 and 5.5 models appropriate for the disk dwarfs. The blueward trends in both and increasing with decreasing surface gravity as shown by the log(g) = 4.5, 4.0, and 3.5 models. The dotted lines connect models of 2500 K, 2700 K, 2900 K, and 3100 K. We refer to as the observed offset since it is measured relative to the linear fit. As described below, understanding the effect of low surface gravity on is crucial for estimating the band veiling from reddening-invariant colors.
3.2 Veiling Models
The identification of accretion shocks by photometry involves detection of the additional continuum flux generated by the reprocessing of the high temperature shock back along the accretion column. The veiling produced by this excess continuum is defined as the ratio of the shock flux to that of the stellar photosphere within a specified wavelength range or filter passband.
The observed increase in brightness in an arbitrary filter is
| (5) |
where is the veiling in and is the observed magnitude. The observed veilings in low mass T Tauris are significantly higher in the near-ultraviolet and blue regions of the spectrum than in the red. For all but the mostly heavily veiled sources the contribution of the accretion continuum to the photosphere is minimal at wavelengths above 7000Å (Muzerolle et al., 2003) and therefore should be minimal in the SDSS and bands. This is a contrast effect between the K shock emission and the 3000 K star.
The change in a reddening-invariant color due to veiling is then
| (6) | |||||
Our veiling models are characterized by the veilings in the SDSS and band, and . We explicitly assume that and are zero (cf. supra) and obtain
| (7) |
and
| (8) |
In the general case where we can not deduce the photospheric spectral type from . However, since veiling makes stars look bluer (earlier, more massive), we can use the observed to deduce the earliest possible spectral type. For veiling models consisting of a non-zero and we can examine the variations in the and color. Figure 5 shows the color shifts for varying continuously from -0.5 to 1 and = 0.00, 0.25, 0.50, 0.75, and 1.00. The negative veiling values are used to model the cool spots seen in Weak-lined T Tauris.
When an unknown veiling is present in the band, the key diagnostic feature in the color-color diagram is the vertical displacement of the star from the stellar locus along the reddening-invariant index. This is shown in Figure 6 as a function of assuming the linear fits to the locus given above. In the case of weak to moderate veiling, , we see that differing the to ratio only results in a minimal spread of derived for a given . We can therefore use the observed as a proxy for continuum veiling even when the spectral type and color are not known a priori assuming that the intrinsic offset due to low surface gravity can be inferred.
4 Candidate Selection
Possible low mass and very low mass accreting stars were selected on the basis of color, location in color-magnitude diagrams, and variability. An estimate of contamination was obtained by applying these criteria to a neighboring field.
4.1 Color and Magnitude Criteria
We adopted selection criteria and to target M dwarf colored stars. This corresponds to 3700 K or spectral types later than M0.5 in the field and M1 on the Luhman (2003) scale. The maximum stellar mass inferred from the 2 Myr Baraffe et al. (1998) isochrone is 0.8 M⊙.
To reduce the scatter in the reddening invariant colors we required photometric errors less than 0.05 magnitudes in . This was relaxed for the band to extend the detection limit. The resulting magnitude and error limits are summarized in Table 3. The limiting band magnitude of 15.5 corresponds to a lower mass limit of 0.05 M⊙ ( M7) based on the BCAH98 2 Myr isochrone. Propagation of these errors into the expressions for the reddening-invariant colors yields maximum errors for of 0.088 and 0.075 and for of 0.045 and 0.046, each in the cases of = 3.1 and 5.5, respectively. The maximum error in is 0.159 which is dominated by the error of 0.1 at the faint limit.
In order to remove background stars we required that candidates were brighter than the main sequence placed at the distance of Orion in both the amd color-magnitude diagrams. The color-absolute magnitude relations in the SDSS passbands for late K and M dwarfs are and (Golimowski et al. 2005 in prep.). The errors in these relations are dominated not by photometric uncertainly (which is typically 1-2%), but by the intrinsic cosmic scatter of the sample.
4.2 Variability
Due to the non-periodic variations of low mass CTTS and the irregular sampling by the SDSS we expect the resulting lightcurves to be fairly random. A truly random sequence has a standard deviation () equal to 1.0/ of the peak-to-peak amplitude. Given a finite number of samples and a probability that the true value of exceeds a specific threshold we need to find the corresponding minimum threshold for the observed that indicates significant variability. We generated a series of Monte Carlo simulations to determine the maximum in a random sequence given an intrinsic of the parent population and a limited number of observations. The scaling factors presented in Table 4 reflect the maximum seen in 99% of the simulated data sets using 10,000 realizations per point. In the limit of large number of observations the scaling factors tend towards unity.
We identify variable stars on the basis of the band exceeding both a threshold of 0.05 magnitudes (scaled by the correction factor defined above), and three times the photometric error in . Of these we also select a subset that meet the same conditions applied to the band. This band variability criterion matches the typical boundary between Type I and Type II band variations in very low mass stars and young brown dwarfs.
4.3 Results
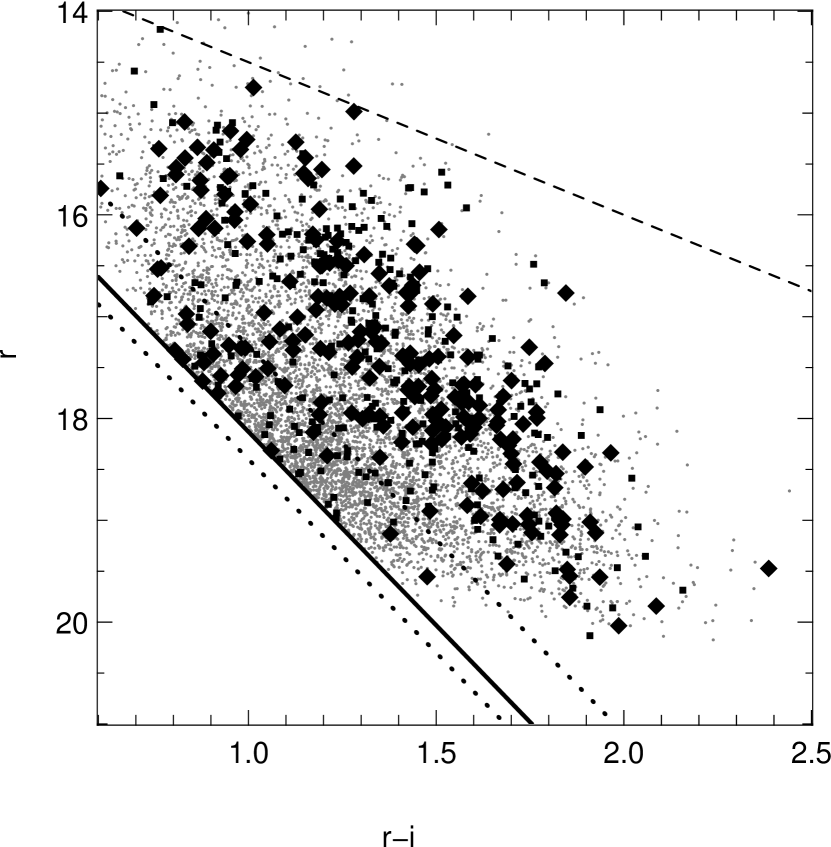
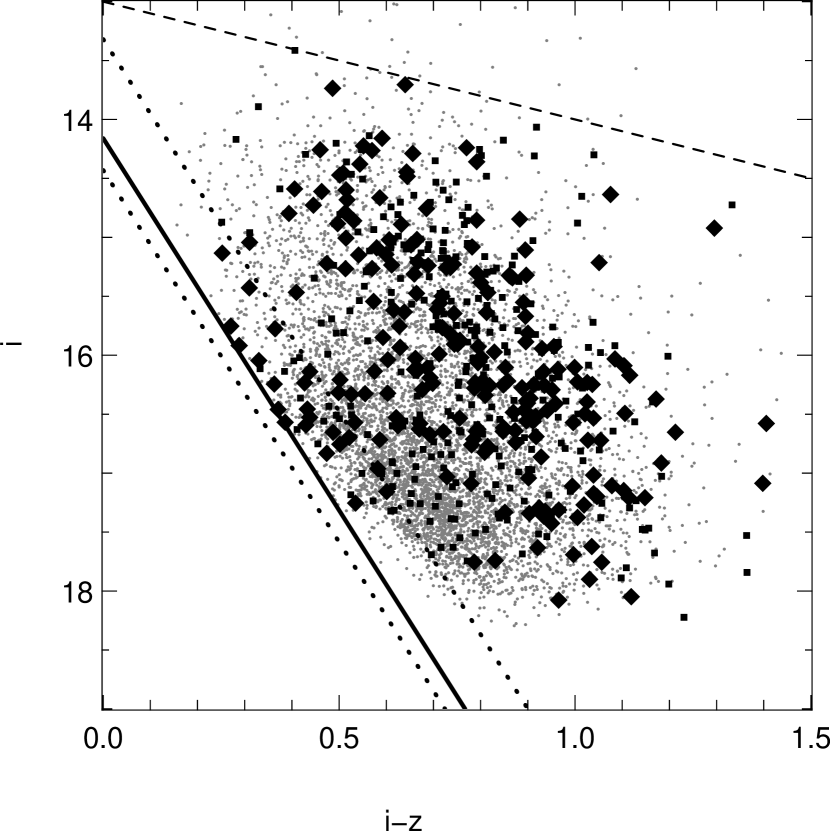
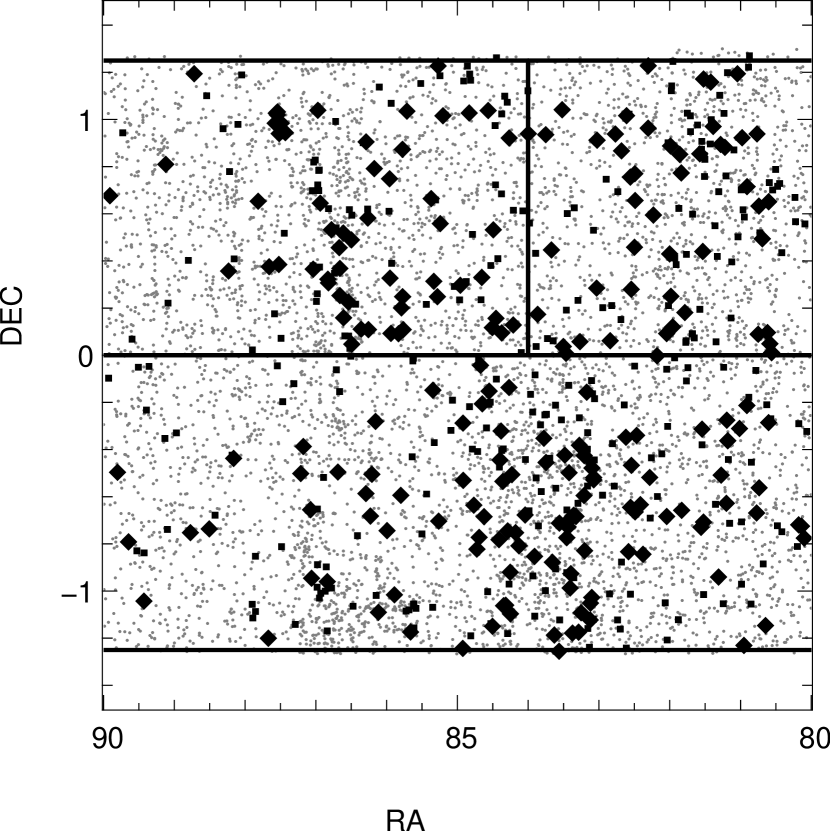
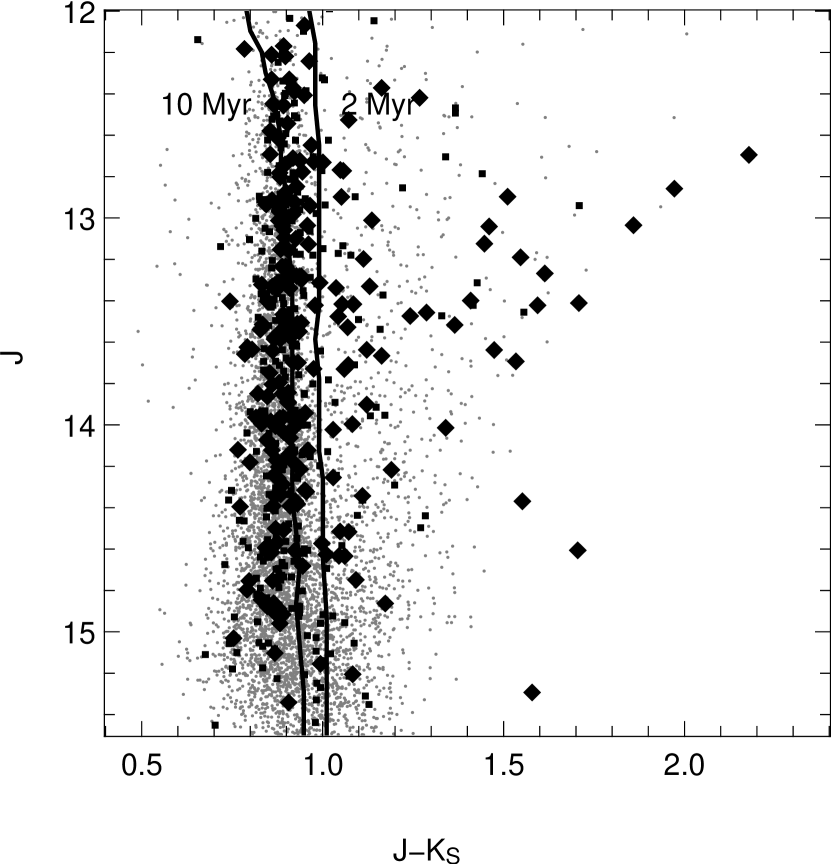
On the basis of these criteria we identify 507 stars that are significantly variable in the band of which 215 also meet the criteria for band variability. In Figures 7 and 8 we see that the majority of the variable stars form a locus parallel to and roughly 2 magnitudes above the main sequence placed at the distance of the Orion star formation region. The spatial distribution of these low mass candidates is concentrated in the Orion OB1a and OB1b associations and the NGC 2068/2071 protocluster (Figure 9). The Orion OB1c subassociation members comprise a dispersed population in this region.
4.4 Comparison Field
In order to assess the possible contamination of our Orion sample by variable field stars we apply the criteria defined above to a neighboring equatorial field bounded by and which encompasses three times the area of our survey. This is a complex region containing at least three populations of young stars which we now describe.
On the basis of ROSAT All-Sky Survey (Trümpler, 1983) detections Neuhaüser (1997) subsequently identified a population of 30 Myr low mass WTTS south of the Taurus-Auriga cloud. While we expect to see Class I variability in these stars signs of active accretion or the presence of inner circumstellar disks should not be evident due to the typical 10 Myr disk lifetime. We also expect to detect the background 8 Myr old Gould Belt stars (Guillout et al., 1998) which may include CTTS. As the Gould Belt midplane crosses our equatorial survey area near we suspect some Gould Belt stars might be found in our Orion sample.
The third star formation complex is that associated with the nearby (80 20 pc) translucent cloud MBM 18 (Larson & Reed, 2003). This high latitude cloud contains compact regions of CO(1-0) emission with line intensities above 3 K. If MBM 18 is an active star formation region then due to its proximity we expect all but the lowest massed young stars to be too bright for the SDSS,
Application of our Orion CTTS criteria results in 133 band variables of which 19 are also variable in the band. After scaling by the ratio of the survey areas these imply possible contamination fractions of 8.7% and 2.9% for the Orion band variables and its band variable subset, respectively.
5 Empirical Results For The Orion Population
5.1 Veiling Signatures
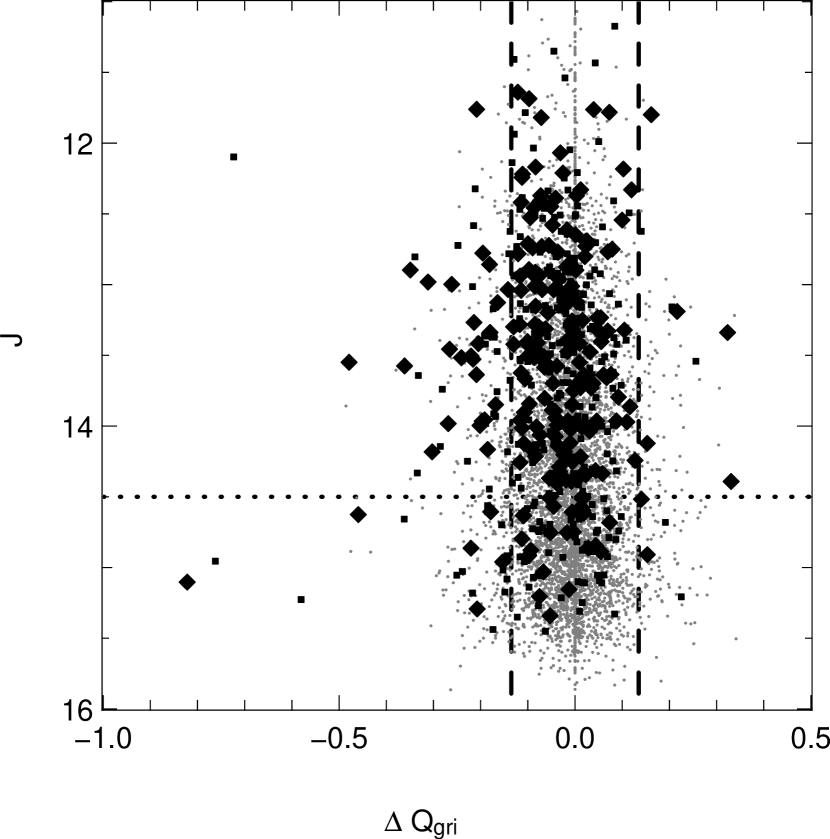
In Figure 10 we show the reddening-invariant color shift between the faint and the bright states defined by the band brightness against the 2MASS magnitude. The observed trend is for to decrease when the star is brighter in which is consistent with the presence of veiling in the band. In this figure the horizontal dotted line marks the substellar boundary based on the BCAH98 2 Myr isochrone placed at m-M = 8.22. We convert the BCAH98 magnitudes from the CIT to the 2MASS system following Carpenter (2001). The derived effective temperature from changes by approximately 100 K for every 0.1 change in the color (see Figure 2). Due to this uncertainty in determination of the photospheric color we will present all color and variability trends against the 2MASS magnitude which should be relatively unaffected by both shock emission and disk thermal emission.
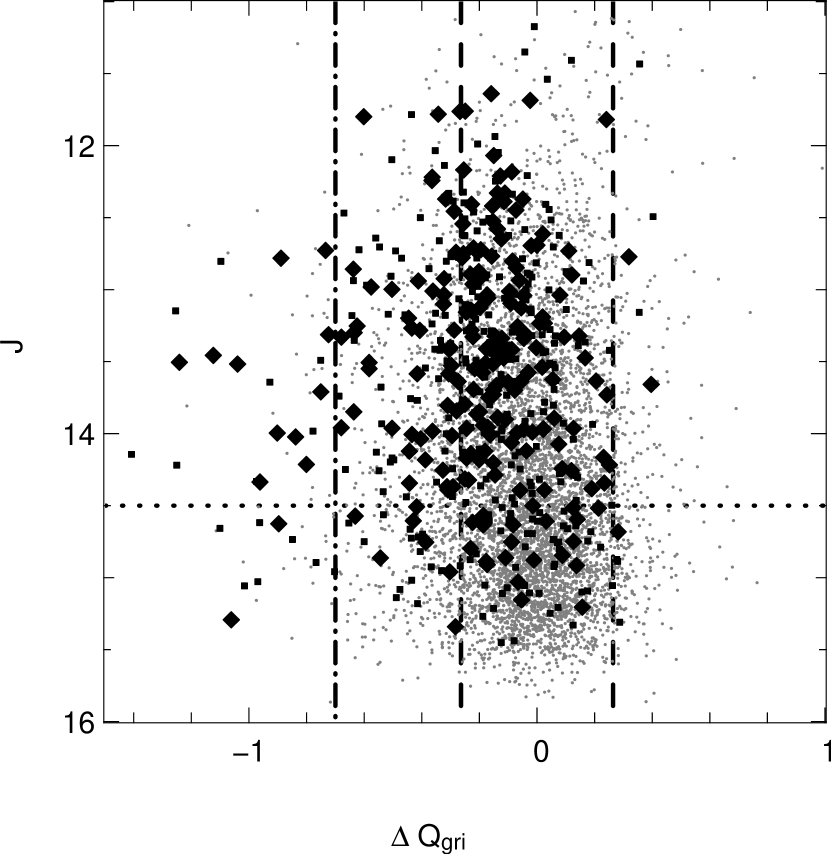
In Figure 11 we see that the bright state during both faint and bright states slightly decreases in the less massive (fainter) objects. However, when the observed are compared against those predicted from the cooler ( 2700 K) low surface gravity models (dot-dash line) it is clear that the bulk of veiling signature is probably due to the shifts in photospheric colors. Thus, at the substellar boundary we only see evidence for weak band veiling which consistent with the results of Muzerolle et al. (2003) who find a deficit of continuum veiling at 5500 Å for accreting stars of spectral types M5 to M7.
5.2 Variability
If the veiling in a specific band ranges from to then the observed magnitude change is
| (9) |
This scales montonically, albeit non-linearly, with , if
| (10) |
which in the case where scales with , i.e. requires , which is implied by . In general we then expect the amplitude and RMS of the variability to be related to the veiling and hence with the shock flux in that band.
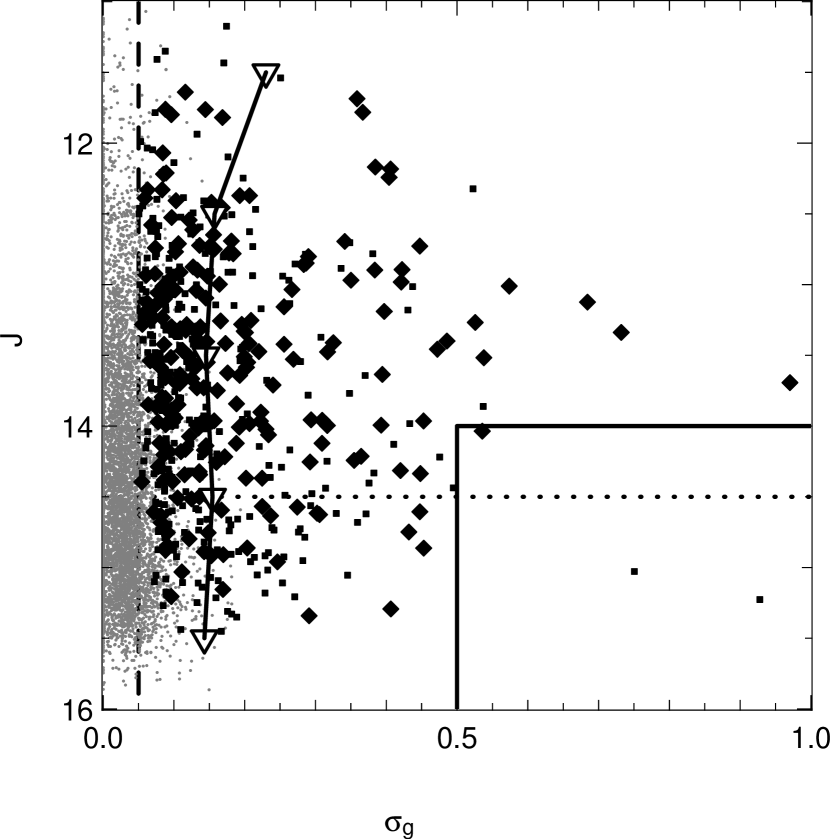
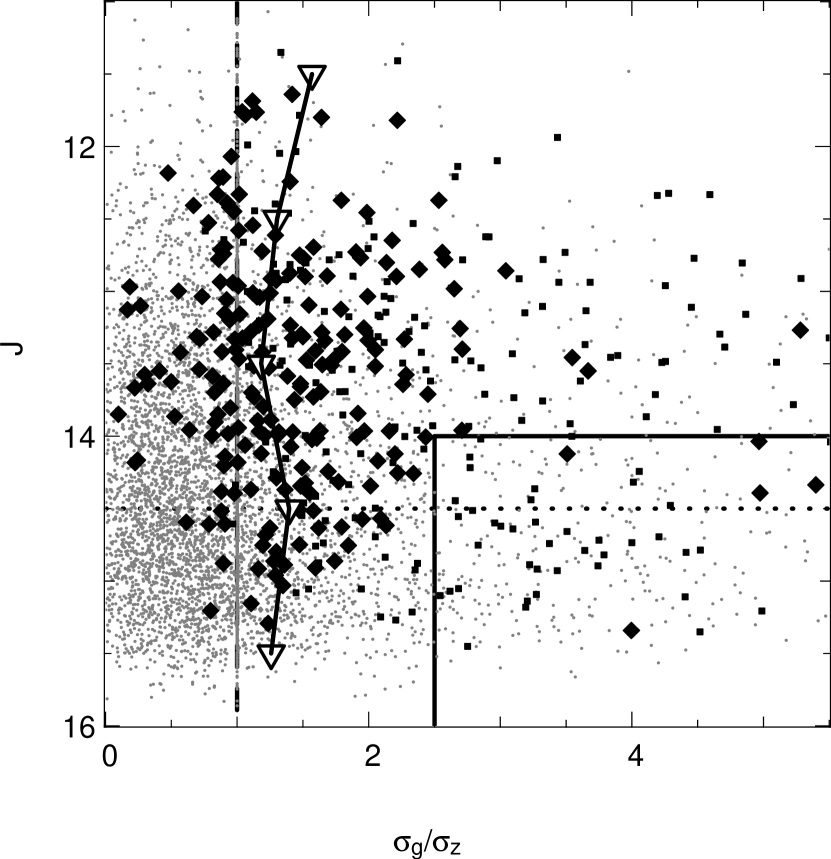
In Figure 12 we see that the maximum RMS of the band variations peaks at and that no high-amplitude ( variables are seen below . The triangles mark the median values computed in for one-magnitude bins spanning . We also see that the maximum ratio of the band to band RMS (/) peaks at the same magnitude and then decreases in the fainter stars (Figure 13). Only five faint () candidate accreting stars have . This trend is perhaps indicative of cooling of the accretion shock temperature with diminished mass.
For the intermediate mass Classical T Tauris studied by Gullbring et al. (1998), the Balmer jump diminishes as the veiling and shock bolometric luminosity increase. Conversely, for the weakly accreting systems expected in very low mass stars and young brown dwarfs the Balmer jump should be relatively large suggesting that the bulk of the shock emission will be in the near-ultraviolet rather than the optical bands. The shock models of Muzerolle et al. (2003) suggest that shocks with lower energy flux carried by the accreting column emit more at redder wavelengths due to quasi-blackbody emission from the heated photosphere. The trend we see is consistent with a decrease in the shock energy flux with decreasing mass.
5.3 Near-Infrared Excess
Near-Infrared () photometry has often been used to detect the presence of excess emission primarily in the band due to thermal emission from the inner circumstellar disk. Meyer, Calvet, & Hillenbrand (1997) find a Classical T Tauri locus in based on the dereddened colors of K7/M0 intermediate massed stars in Taurus. In Figure 14 we see that the excess indicating either a disk signatures or significant extinction drops for objects having . For the 2 Myr BCAH98 isochrone this corresponds to 0.11 M⊙ and = 3000 K ( M5.5). This lack of signature in is expected for substellar objects since they are less luminous and so the inner circumstellar disk will be cooler. As discussed by Liu, Najita, & Tokunaga (2003) this contrast problem between the disk and the stellar photosphere motivates searching for young brown dwarf disks in the and longer wavelength bands.
6 Summary
Analysis of 2MASS and multi-epoch SDSS photometry of low mass pre-main sequence objects stars within the Orion OB1 assocation shows that:
1. band variations having a standard deviation greater than 0.05 magnitudes persist for objects having reddening-invariant colors redder than, and magnitudes fainter than, that expected for the stellar/substellar boundary.
2. While identification of band veiling for spectral types later than M4 is hindered by our uncertain knowledge of surface gravity effects on photospheric colors, we see evidence for accretion signatures even in these very low mass objects. The general trend is for the veiling signature to diminish with decreasing temperature (and mass).
3. No disk signatures based on color excess are seen for spectral types later than M4. We infer based on variability and weak veiling that the accretion process and hence the disks are present, and that relative contribution to the band flux is weak. This is consistent with earlier work on young brown dwarf disks.
We have demonstrated that multi-epoch and multi-band imaging surveys enable identification and classification of pre-main sequence objects based on variability and reddening-invariant colors. While use of the SDSS band was mandated by the sensitivity issues and the red-leak in the imager’s filter system, inclusion of a broad-band filter that is shortward of the Balmer jump such the SDSS in the next generation of surveys, i.e. the Large Synoptic Survey Telescope or LSST, will increase the sensitivity to the veiling emission from the accretion shock for the later and less massive objects.
We are supplementing this imaging survey with an SDSS spectroscopic program targeting low mass stars in Orion and the Taurus-Auriga star formation region. Results from this study in addition to analysis of the veiling trends presented here and their constraints on shock luminosities and mass accretion rates will be discussed in subsequent work.
References
- Abazajian et al. (2003) Abazajian, K., et al. 2003, AJ, 126, 2081 (DR-1)
- Abazajian et al. (2005) Abazajian, K., et al. 2005, AJ, 129, 1755 (DR-3)
- Alcalá et al. (1996) Alcalá, J. M. et al. 1996, A&AS, 119, 7
- Allard, Hauschildt, & Schwenke (2000) Allard, F., Hauschildt, P.H., & Schwenke, D. 2000, ApJ, 540, 1005
- Armitage & Clarke (1997) Armitage, P.J. & Clarke, C.J. 1997, MNRAS, 285, 540
- Baraffe et al. (1998) Baraffe, I. et al. 1998, A&A, 337, 403 (BCAH98)
- Baraffe et al. (2002) Baraffe, I. et al. 2002, A&A, 382, 563
- Barrado y Navascues et al. (2004) Barrado y Navascues, D. et al. 2004, ApJ, 610, 1054
- Barrado y Navascues, Mohanty, & Jayawardhana (2004) Barrado y Navascues, D., Mohanty, S., & Jayawardhana, R. 2004, ApJ, 604, 284
- Bouvier (2003) Bouvier, J. et al. 2003, A&A, 409, 169
- Briceño (2003) Briceño, C. et al. 2003, Mem.S.A.It., 74, 870
- Briceño (2004) Briceño, C. et al. 2005, AJ, 129, 907
- Brown, de Geus, & de Zeeuw (1994) Brown, A.G.A., de Geus, E.J, & de Zeeuw, P.T. 1994, A&A, 289, 101
- Caballero et al. (2004) Caballero, J.A. et al. 2004, A&A, 424, 857
- Cardelli, Clayton, & Mathis (1989) Cardelli, J. A., Clayton, G .C. & Mathis. J. S. 1989, ApJ, 345, 245
- Carpenter (2001) Carpenter, J.M. 2001, AJ, 121, 2851
- Chabrier & Baraffe (2000) Chabier, G & Baraffe, I. 2000, ARA&A, 38, 337
- Cohen, Herbst, & Williams (2004) Cohen, R.E., Herbst, W. & Williams, E.C. 2004, AJ, 127, 1602
- de Geus, de Zeeuw, & Lub (1989) de Geus, E.J., de Zeeuw, P.T. & Lub, J. 1989, A&A, 216, 44
- Finkbeiner et al. (2004) Finkbeiner, D. et al. 2004, AJ, 128, 2577
- Fukugita et al. (1996) Fukugita, M. et al. 1996, AJ, 111, 1748
- Girardi et al. (2004) Girardi, L. et al. 2004, A&A, 422, 205
- Guillout et al. (1998) Guillout, P. et al. 1998, A&A, 337, 113
- Gullbring et al. (1998) Gullbring, E. et al. 1998, ApJ, 492, 323
- Gullbring et al. (2000) Gullbring, E. et al. 2000, ApJ, 544, 927
- Gunn et al. (1998) Gunn, J. E. et al. 1998, AJ, 116, 3040
- Herbst et al. (1994) Herbst, W. et al. 1994, AJ, 108, 1906
- Herbst et al. (2002) Herbst, W. et al. 2002, A&A, 396, 513
- Hogg et al. (2001) Hogg, D.W., Finkbeiner, D.P., Schlegel, D.J., & Gunn, J.E. 2001, AJ, 122, 2129
- Ivezić et al. (2004) Ivezić, Ž, Lupton, R.H., Schlegel, D. et al. 2004, AN, 325, No. 6-8, 583-9.
- Jayawardhana, Mohanty, & Basri (2002) Jayawardhana, R., Mohanty, S.& Basri, G. 2002, ApJ, 578, L141
- Jayawardhana, Mohanty, & Basri (2002) Jayawardhana, R., Mohanty, S.& Basri, G. 2003, ApJ, 592, 282
- Joergens et al. (2003) Joergens, V. et al. 2003, ApJ, 594, 971
- Johnson & Morgan (1953) Johnson, H.L. & Morgan, W.W. 1953, ApJ, 117, 313
- Joy (1945) Joy, A. H. 1945, ApJ, 102, 168
- Kenyon & Hartmann (1995) Kenyon, S. J. & Hartmann, L. 1995, ApJS, 101, 117
- Königl (1991) Königl, A. 1991, ApJ, 370, L39
- Kroupa et al. (2003) Kroupa, P. et al. 2003, MNRAS, 346, 354
- Kurucz (1979) Kurucz, R.L. 1979, ApJS, 40, 1
- Küker, Henning, & Rüdiger (2003) Küker, M., Henning, T. & Rüdiger, G. 2003, ApJ, 589, 397
- Larson & Reed (2003) Larson, K.A. & Reed, C.M. 2003, Astrophysics of Dust, Estes Park, Colorado
- Leggett (1992) Leggett, S.K. 1992, ApJS, 82, 351
- Liu, Najita, & Tokunaga (2003) Liu, M., Najita, J, & Tokunaga, A. 2003, ApJ, 585, 372
- Luhman (1999) Luhman, K.L. 1999, ApJ, 525, 466
- Luhman (2003) Luhman, K.L. et al. 2003, ApJ, 593, 1093
- Meyer, Calvet, & Hillenbrand (1997) Meyer, M. R., Calvet, N., & Hillenbrand, L. A. 1997, AJ, 114, 288
- Mohanty et al. (2004) Mohanty, S. et al. 2004, ApJ, 609, L33
- Mohanty, Jayawardhana, & Basri (2005) Mohanty, S., Jayawardhana, R. & Basri, G. 2005, ApJ, 626, 498
- Muzerolle et al. (2000) Muzerolle, J. et al. 2000, ApJ, 545, L141
- Muzerolle et al. (2003) Muzerolle, J. et al. 2003, ApJ, 592, 26
- Muzerolle et al. (2005) Muzerolle, J. et al. 2005, ApJ, 625, 906
- Natta et al. (2004) Natta, A. et al. 2004, A&A, 424, 602
- Neuhaüser (1997) Neuhaüser, R. et al. 1997, A&A, 325, 647
- Padoan et al. (2005) Padoan, P. et al. 2005, ApJ, 622, L61
- Pier et al. (2003) Pier, J.R., Munn, J.A., Hindsley, R.B., Hennessy, G.S., Kent, S.M., Lupton, R.H., & Ivezić, Ž. 2003, AJ, 125, 1559
- Rebull et al. (2000) Rebull, L. M. et al. 2000, AJ, 119, 3026
- Rebull et al. (2002) Rebull, L. M. et al. 2002, AJ, 123, 1528
- Reid & Hawley (2000) Reid, I. N. & Hawley, S. L. 2000, New Light on Dark Stars (Springer-Praxis)
- Reipurth & Clarke (2001) Reipurth, B. & Clarke, C. 2001, AJ, 122, 432
- Romanova (2002) Romanova, M. M. et al. 2002, ApJ, 578, 420
- Schlegel, Finkbeiner, & Davis (1998) Schlegel, D. J., Finkbeiner, D. P., & Davis, M. 1998, ApJ, 500, 525
- Scholz & Eislöffel (2004a) Scholz, A. & Eislöffel, J. 2004, A&A, 419, 240
- Scholz & Eislöffel (2005) Scholz, A. & Eislöffel, J. 2005, A&A, 429, 1007
- Sherry (2003) Sherry, W. H. 2003, PhD Thesis, SUNY/Stony Brook
- Skrutskie et al. (1997) Skrutskie, M. F, et al., 1997, The Impact of Large-Scale Near-IR Sky Surveys, F. Garzon et al., eds (Dordrecht:Kluwer)
- Smith et al. (2002) Smith, J.A., et al. 2002, AJ, 123, 2121
- Stoughton et al. (2002) Stoughton, C., et al. 2002, AJ, 123, 485 (EDR)
- Trümpler (1983) Trümpler, J. 19832, Adv. Space Res., 2, 241
- von Rekowski & Brandenburg (2003) von Rekowski, B. & Bradenburg, A. 2004, A&A,420, 17
- Walter, Wolk, & Sherry (1998) Walter, F.M., Wolk, S.J., & Sherry, W. 1998, ASP Conf. Ser. 154, eds. R. Donahue and J.Bookbinder, p. 1793
- Warren & Hesser (1978) Warren, W.H., Jr. & Hesser, J.E. 1978, ApJS, 36, 497
- West et al. (2004) West, A. et al. 2004, AJ, 128, 426
- White & Basri (2003) White, R. J. & Basri, G. 2003, ApJ, 582, 1109
- Wiramihardja et al. (1989) Wiramihardja, S. D. et al. 1989, PASJ, 41, 1551
- Wolk (1996) Wolk, S. 1996, PhD Thesis, SUNY/Stony Brook
- York et al. (2000) York, D. G. et al. 2000, AJ, 120, 1579
- Zapatero Osorio et al. (2003) Zapatero Osorio, M.R. et al. 2003, A&A, 408, 663


| Region | Distance in pc (m-M) | Age (Myr) |
|---|---|---|
| Orion OB1a | 330 (7.59) | 11.4 1.9 |
| Orion OB1b | 440 (8.22) | 1.7 1.1 |
| Orion OB1c | 460 (8.31) | 4.6 |
| Orion OB1daaThe Orion Nebula Cluster is not included in this study. | 450 (8.27) | 1 |
| Run | Date (MJD) | Interval (Days) | Elapsed (Days) |
|---|---|---|---|
| 0211 | 51115 | … | … |
| 0259 | 51134 | 19 | 19 |
| 0273 | 51136 | 2 | 21 |
| 0297 | 51139 | 3 | 24 |
| 0307 | 51140 | 1 | 25 |
| 2955 | 52312 | 1172 | 1197 |
| 2960 | 52313 | 1 | 1198 |
| 2968 | 52314 | 1 | 1199 |
| 4158 | 52912 | 598 | 1787 |
| Band | Survey | Faint Limit | Maximum Error |
|---|---|---|---|
| SDSS | 21.5 | 0.05 | |
| SDSS | 20.0 | 0.03 | |
| SDSS | 18.0 | 0.02 | |
| SDSS | 17.0 | 0.02 | |
| 2MASS | 15.5 | 0.05 | |
| 2MASS | 14.5 | 0.05 | |
| 2MASS | 14.5 | 0.10 |
| N Epoch | Factor (99%) |
|---|---|
| 2 | 1.748 |
| 3 | 1.344 |
| 4 | 1.226 |
| 5 | 1.155 |
| 10 | 1.072 |
| 15 | 1.040 |
| 20 | 1.033 |
| 25 | 1.026 |
| 30 | 1.021 |