Probing the inner 200 AU of low-mass protostars with the Submillimeter Array: Dust and organic molecules in NGC 1333-IRAS2A
Abstract
The Submillimeter Array has opened a new window to study the innermost warm and dense regions of the envelopes and disks around deeply embedded protostars. This paper presents high-angular resolution (′′) submillimeter observations of the class 0 young stellar object NGC 1333-IRAS2A. Dust continuum emission and lines of complex organic molecules such as CH3OCH3 and CH3OCHO, high excitation CH3OH transitions, deuterated methanol CH3OD as well as lines of CO, HCN, HC13CN, SO and SO2 are detected on AU scales. The observations are interpreted using detailed radiative transfer models of the physical and chemical structure, consistent with both single-dish and interferometer data. The continuum emission is explained by an extended envelope and a compact but resolved component, presumably a circumstellar disk with a diameter of 200–300 AU and a mass of a few . If related to the rotation of the envelope, then the size of this disk suggests a centrifugal barrier of 200–300 AU, which implies that the temperature in the envelope does not increase above 100 K. Its large size also suggests that the build-up of disks proceeds rapidly throughout the early protostellar stages. The smaller ( AU) disks found around other deeply embedded protostars may be a result of tidal truncation. The high-resolution observations of SO can be explained with a simple constant abundance, , constrained through single-dish observations, whereas those of H13CN and the organic species require high abundances, increased by one to two orders of magnitude, or an additional compact source of emission at small scales. The compact molecular emission could originate in a hot core region of the inner envelope, but a more likely reservoir is the circumstellar disk.
1 Introduction
Understanding the physical and chemical structure of the inner hundred AU of the envelopes around protostellar objects is important because part of this material will be included in circumstellar disks from which planets may form eventually. The innermost envelopes are characterized by high temperatures ( 100 K) and densities ( cm-3), making them eminently suited for observations at submillimeter wavelengths. These regions are, however, heavily diluted in single-dish beams ( size compared to typical single-dish beam sizes of 10–20′′) and interpretation of their line and continuum emission relies on extrapolation of the density and temperature distribution from observations on larger scales. Furthermore, studies based on observations of lower excitation lines are complicated by the fact that a large fraction of their emission may arise in the outer cold regions of the envelopes, where the lines can also become optically thick. Interferometry with the Submillimeter Array (SMA) avoids most of these complications and thus provides a unique possibility to probe the warm and dense material in the innermost regions of protostellar systems. In this paper we present SMA observations for the low-mass protostar NGC 1333-IRAS2A. This study will serve as an illustration of the type of data and analysis techniques that are possible for these objects and will be applied in the future to a much larger sample of low-mass protostars currently being observed at the SMA.
The first goal of this project is to constrain the physical structure on scales of a few hundred AU from the continuum data. The larger ( AU) scale temperature and density distribution is well determined from analysis of single-dish submillimeter continuum images (e.g. Shirley et al., 2002; Schöier et al., 2002; Jørgensen et al., 2002) but holes, cavities and departures from spherical symmetry are likely at smaller radii. In addition, any disk will start to contribute significantly to the emission on scales of a few hundred AU. Since the dust continuum flux scales with frequency as or steeper, submillimeter interferometry is particularly well suited to probe the disks and distinguish them from the envelope. Very little is known about the physical properties such as mass and sizes of disks in these deeply embedded stages, parameters which the SMA data can constrain.
A second goal of this project is to study the chemistry in the innermost region, where large changes in abundances are expected due to evaporation of icy grain mantles that inject species such as H2O and CH3OH into the gas-phase. Reactions between evaporated molecules result in a distinct “hot core chemistry” containing even more complex organic molecules. In recent years the existence of such hot cores has been suggested in a number of low-mass young stellar objects (e.g., Maret et al., 2004), most strongly in the protostellar binary IRAS 16293–2422 where warm gas and high abundances of a number of species are thought to be present in the innermost ( AU) regions (van Dishoeck et al., 1995; Ceccarelli et al., 2000; Schöier et al., 2002). Detections of various complex organic molecules, e.g., HCOOH, CH3OCH3, CH3CHO, CH3CN, and C2H5CN have been reported from single-dish observations toward IRAS 16293–2422 (Cazaux et al., 2003) and another low-mass protostar NGC 1333-IRAS4A (Bottinelli et al., 2004a). Still, it is not clear how many low-mass protostars show complex organic molecules and whether these reflect the heating of ices or other processes such as the action of the outflows (see, e.g., discussion in Jørgensen et al., 2005b). Yet another fascinating question is whether any of the organic molecules reside in the circumstellar disks. High angular resolution interferometer observations of IRAS 16293-2422 for example (Kuan et al., 2004; Bottinelli et al., 2004b) show that line emission of the organic molecules peaks close to the position of two compact dust continuum sources thought to mark the location of circumstellar disks around each of the binary components.
This paper presents high angular resolution submillimeter observations of dust continuum emission and high excitation transitions of organic and other molecules toward the class 0 protostar NGC 1333-IRAS2A using the SMA. The data are interpreted in the context of physical and chemical models previously constrained from single-dish observations and coupled with detailed radiative transfer calculations. The paper is laid out as follows: §2 describes the details of the observations and §3 shows the qualitative results in terms of the detected continuum and line emission - including the detections of high excitation lines of, e.g., CH3OH. §4 presents a detailed analysis based on the available continuum and line radiative transfer models and §5 discusses the origin of the observed emission.
2 Observations
NGC 1333-IRAS2A111In this paper we adopt a distance of 220 pc toward NGC 1333 (Černis, 1990). (, ) (Looney et al., 2000) was observed on 2004 October 17 with the Submillimeter Array222The Submillimeter Array is a joint project between the Smithsonian Astrophysical Observatory and the Academia Sinica Institute of Astronomy and Astrophysics, and is funded by the Smithsonian Institution and the Academia Sinica. (Ho et al., 2004) at 350 GHz. The array had 7 antennae in the “Compact-North” configuration covering projected baselines from 18 to 164 k corresponding to a beam size of 1.8″1.0″ (P.A. 83∘) with natural weighting. The weather conditions were excellent with typical 225 GHz zenith sky opacities of 0.025–0.03. The 2 GHz bandwidth in each sideband of the SMA digital correlator was configured with 1 chunk of 512 channels (345.853–345.957 GHz and 354.453–354.557 GHz) and 3 chunks of 256 channels (345.765–345.869, 345.279–345.383, 344.295–344.399 GHz and 354.541–354.645, 355.027–355.131, 356.011-356.115 GHz). With the width of each chunk of 104 MHz, the resulting spectral resolutions are 0.2–0.4 MHz (0.15–0.30 km s-1). The remaining bandwidth was covered by 20 chunks each of 32 channels with a resulting resolution of 3.25 MHz (2.8 km s-1); no bright lines are expected in these chunks, which are used to determine the continuum. The separation between the upper and lower sideband is 10 GHz. The complex gains were calibrated through observations of the two nearby quasars, 3C84 and 0359+509, the flux through observations of Uranus and the passband through observations of Uranus and Venus. The initial reduction was performed in the “MIR” package (Qi, 2005) and subsequently maps created and cleaned in Miriad (Sault et al., 1995). The resulting RMS sensitivity was 15 mJy beam-1 over the 2 GHz bandwidth (continuum) and 0.2-0.35 Jy beam-1 per channel in the narrow band setups.
3 Results
3.1 Continuum
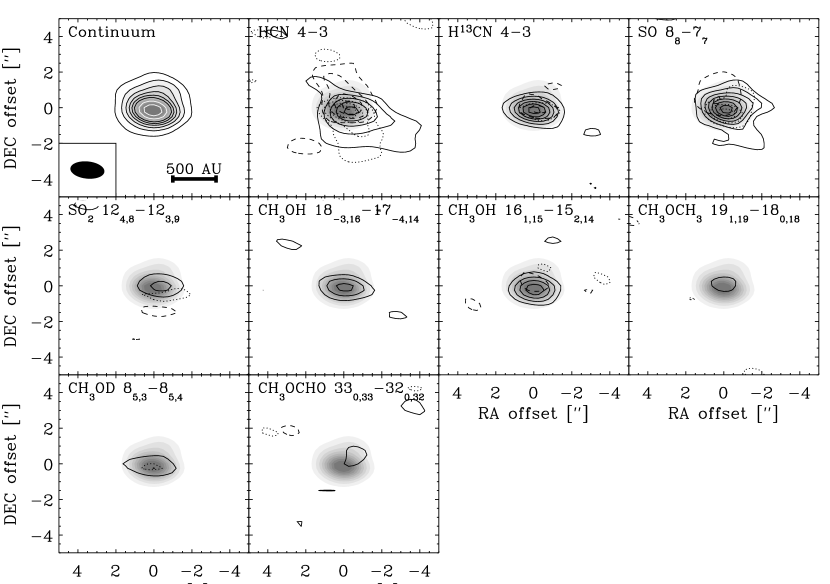
Continuum emission was clearly detected toward IRAS2A. The nearby companion IRAS2B (Looney et al., 2000; Jørgensen et al., 2004a) is located about 30″ away, i.e., outside the primary beam of the SMA 350 GHz observations (half power beam width of 35″) and is not picked up by the observations presented in this paper. A map of the continuum emission is shown in Fig. 1. For IRAS2A Gaussian fits to the slightly extended emission (2.3′′1.6′′ FWHM) give a total integrated flux of approximately 1 Jy (a peak flux of 0.46 Jy beam-1). For comparison, Chandler & Richer (2000) report a flux of 4.790.39 Jy at 850 m in an aperture with a radius of 45′′ from the JCMT/SCUBA whereas Brown et al. (2000) report a “disk” flux of Jy from interferometer observations with the JCMT and CSO interferometer covering baselines of 70–190 k. These differences illustrate that a large fraction of the emission is resolved out due to the interferometer’s lack of short spacings. In order to make any (qualitative or quantitative) statements about the origin and properties of the compact, emitting component, the extended envelope therefore needs to be subtracted, and the interpretation of the interferometric data requires a model.
3.2 Lines
In total 10 lines were detected at the 3 level in this single track including the optically thick CO 3–2 and HCN 4–3 lines, optically thin lines of H13CN, SO, and SO2 and high excitation lines of organic molecules including CH3OH, CH3OD and CH3OCH3 with a tentative detection of CH3OCHO. The lines detected are listed in Table 1 and their spectra in the central beam shown in Fig. 2.

Results of Gaussian fits to the lines observed in the central beam toward the continuum position are given in Table 1. Besides the CO 3–2 and HCN 4–3 lines that clearly show structure due to resolved out extended emission at the systemic velocity, and possible self-absorption, the lines are all well represented by Gaussian profiles with line widths of 3–4 km s-1 (FWHM). SO2 is the only exception with a narrower line width of 2 km s-1.
| Line | Freq. | aaPeak brightness and line width (FWHM) from Gaussian fits to the detected lines. The number in parenthesis indicates the estimated error from the fit. | aaPeak brightness and line width (FWHM) from Gaussian fits to the detected lines. The number in parenthesis indicates the estimated error from the fit. |
|---|---|---|---|
| [GHz] | [Jy beam-1] | [km s-1] | |
| CO 3–2 | 345.7960 | bbThese transitions show strong self-absorption and peak brightness and line width are not significant. Total emission integrated from 1 to 13 km s-1 is 5.8 Jy beam-1 km s-1 and 10.1 Jy beam-1 km s-1 for the CO 3–2 and HCN 4–3 lines, respectively. | |
| HCN 4–3 | 354.5055 | bbThese transitions show strong self-absorption and peak brightness and line width are not significant. Total emission integrated from 1 to 13 km s-1 is 5.8 Jy beam-1 km s-1 and 10.1 Jy beam-1 km s-1 for the CO 3–2 and HCN 4–3 lines, respectively. | |
| H13CN 4–3 | 345.3398 | 1.4 (0.06) | 4.2 (0.2) |
| SO | 344.3108 | 1.9 (0.07) | 3.9 (0.2) |
| SO2 | 354.0455 | 0.54 (0.07) | 2.4 (0.4) |
| CH3OH (A-type) | 345.9040 | 0.99 (0.07) | 3.6 (0.3) |
| CH3OH (E-type) | 345.9192 | 0.79 (0.08) | 3.4 (0.4) |
| CH3OD (A-type) | 345.3196 | 0.58 (0.13) | 3.1 (0.8) |
| CH3OCH3 | 344.3579 | 0.32 (0.15) | 3.5 (2.1) |
| CH3OCHO | 354.6078 | 0.27 (0.08) | 2.8 (1.0) |
Maps of the observed line emission for selected species are shown in Fig. 1. Most of the species (except CO 3–2) show compact emission around the continuum position and only CO, HCN, H13CN and SO are clearly resolved and show velocity gradients associated with the outflow. The widths of the Gaussian fits to these lines are not significantly larger than those of the remaining species. The organic species and the SO2 are largely unresolved with the observing resolution corresponding to scales of AU. This suggests that the observed emission either probes the innermost region of the protostellar envelope (where the temperatures are 50–60 K or higher) or is associated with the compact component observed in the continuum data, possibly the circumstellar disk.
4 Detailed analysis
4.1 General considerations
The development of detailed radiative transfer models has made it possible to place constraints on the radial distribution of molecular abundances throughout protostellar envelopes. In short, these models use dust continuum observations to constrain the physical conditions in the envelopes (e.g. temperature and density), which subsequently can be used for non-LTE molecular excitation and line radiative transfer calculations for comparison to both multi-line single-dish and interferometer data. Interferometer observations of continuum emission can be used to constrain the properties of the envelope on small ( AU) scales and infer the presence of circumstellar disks (e.g, Harvey et al., 2003; Looney et al., 2003) if emission from the envelope is taken into account. Images of the continuum and line emission from the protostar can be computed and then Fourier transformed for direct comparison to the interferometer observations. This comparison in the Fourier plane has two direct advantages: i) no image deconvolution and restoration of the interferometer data is necessary and ii) the comparisons between the models and interferometer data implicitly take the problem of missing short spacings into account (Jørgensen et al., 2004a). The short spacings are included through the single-dish observations used to constrain the physical and chemical structure of the envelope in the first place.
As basis for a more detailed analysis we adopt the structure of the NGC 1333-IRAS2 envelope derived from detailed dust and line radiative transfer modeling (Jørgensen et al., 2002, 2004b, 2005b). This model assumes a spherically symmetric envelope heated by a central source and the temperature profile is calculated self-consistently through the dust radiative transfer. The single-dish observations are well-fitted by a power-law density distribution, , with . The mass of the envelope is 1.7 within a radius of 12,000 AU. This model has previously been compared to 3 mm interferometer data from BIMA and OVRO and was found to explain well the envelope structure down to scales of about 600-1000 AU (3′′-5′′), the smallest scales probed (Jørgensen et al., 2004a).
4.2 Continuum emission: envelope and disk structure
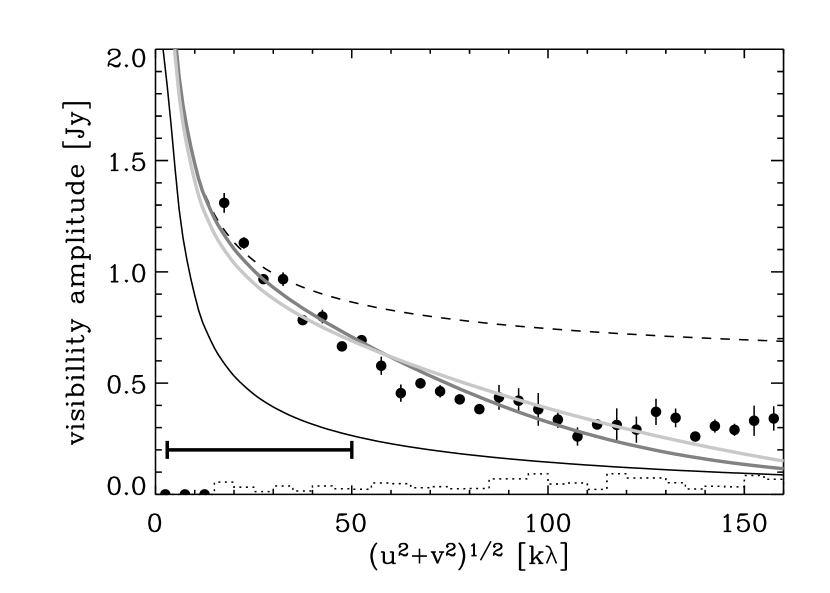
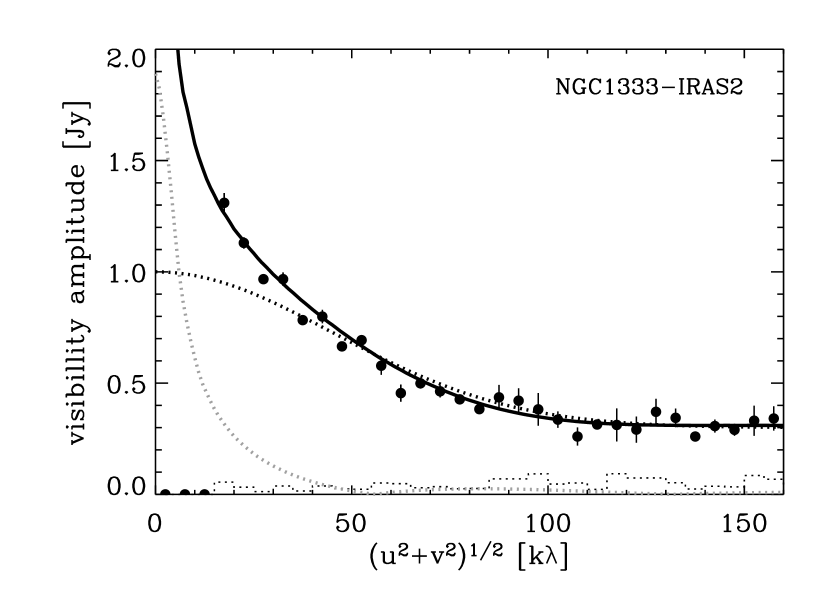
Fig. 3 compares the observed visibilities from the SMA observations with the envelope models (Jørgensen et al., 2002). Consistent with the 3 mm interferometer observations (Jørgensen et al., 2004a) a compact continuum source is required to explain the observed emission in addition to the extended envelope picked up at the shorter baselines. In the 3 mm observations continuum emission was seen out to baselines of k which did not resolve the central source. At the longer baselines observed with the SMA the visibility amplitudes continue to decline indicating that the compact component is resolved at scales of about 1′′ ( AU). This is consistent with the result of Brown et al. (2000) who suggested that the JCMT-CSO observations with baselines of 70–190 k resolved the disk around IRAS2A.
To constrain the properties of this central component, the data were fitted with the prediction from the envelope model explaining the larger scale emission but adding a Gaussian brightness distribution simulating the disk. The Gaussian brightness distribution was taken to be spherically symmetric and its best fit flux and width constrained through estimates of the statistics. For an inner radius of the envelope of 23 AU (corresponding to a temperature of 250 K), a Gaussian distribution with a FWHM of 1.1′′ (a diameter of AU) and a total flux of 0.6 Jy provides the best fit. This is somewhat larger than the size inferred by Brown et al. (2000) of AU (scaled to a distance of 220 pc). This difference reflects i) the shorter baselines included in the observations in this paper constraining the disk contribution on larger scales and ii) the fact that Brown et al. did not include the contribution from the envelope in their estimates. If an inner cavity exists in the envelope such as suggested for IRAS 16293–2422 (Schöier et al., 2004, Jørgensen et al., in prep.) the flux of the compact component would be higher. For example, for a cavity with a radius of 285 AU (corresponding to an inner temperature of 75 K) the flux of the central component increases to 0.8 Jy and its diameter decreases to 0.9′′ ( AU). Note that this is just an example: the interferometer does not place exact constraints on the cavity size and therefore some degeneracy exists between the envelope and disk parameters. Observations of the mid-infrared source with the Spitzer Space Telescope would place exact constraints on the dust column density toward the source center and could thereby resolve this degeneracy.
No matter which inner radius is assumed for the model (23 AU or 285 AU), the flux at the longest baselines is underestimated. Varying the slope of the density profile within the uncertainties allowed by the SCUBA maps does not improve the best fit at the longer baselines as the emission there is dominated by the Gaussian disk component. Naturally the Gaussian profile is probably an oversimplification of the disk structure on the smallest scales. This point is illustrated by the solid line in the rightmost panel of Fig. 3 which includes an envelope (with an inner cavity of radius 285 AU), a disk with Gaussian brightness distribution (flux of 0.5 Jy and diameter of 300 AU) and an unresolved 0.3 Jy point source component. This two component model improves the fit statistically – even taking the extra degree of freedom, introduced with the unknown point source flux, into account. Mundy et al. (1996) reached a similar conclusion for the disk around the T Tauri star HL Tau: 2.7 mm and 0.87 mm continuum emission toward this source was found to be more centrally peaked than a single Gaussian. Mundy et al. attributed this central condensation in emission to temperature and density gradients in a simple power-law disk model.
What this discussion emphasizes is the need for good constraints on the continuum emission on a wide variety of interferometer baselines and from single-dish observations coupled with reliable models for both the envelope and disk components. Thereby it becomes possible to simultaneously constrain the flux of both the extended envelope, and of the disk on intermediate (few hundred AU) and small scales ( AU) but naturally these estimates rely on our assumptions about the disk and envelope structure.
4.3 Line emission: abundance structure
The line observations are compared to the predictions based on models of the envelope constrained by the single-dish observations of Jørgensen et al. (2004b, 2005b). In those papers abundances of H13CN, SO and CH3OH were determined and an upper limit of the SO2 line reported. In this paper, we focus on the chemistry of the optically thin species – and defer the discussion of CO and HCN to a future paper. The aim is to constrain the abundance profiles in the innermost regions which were difficult to probe with single-dish telescopes or low-frequency interferometers. For H13CN, SO and SO2 collisional rate coefficients from the Leiden Atomic and Molecular Database (Schöier et al., 2005) were used to calculate the NLTE molecular excitation. For the remaining species no data exist for the observed high excitation transitions and LTE was assumed. For CH3OH one of the observed transitions probes A-type and the other E-type (the distinction reflecting the rotation of the OH group with respect to the CH3 group), and the abundance of CH3OH quoted in this paper refers to the sum of the abundance of these two species. The abundance structures for all species are summarized in Table 2. Each model is consistent with both single-dish and interferometer observations with - except for CH3OH for which the single-dish data indicate a hot core abundance an order of magnitude lower.
4.3.1 SO and SO2
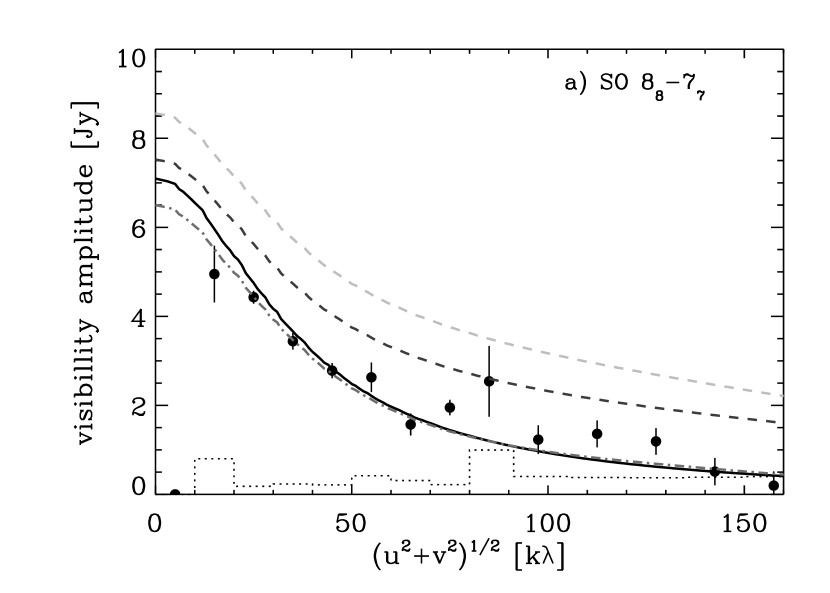
Fig. 4a compares the model prediction for the SO from Jørgensen et al. (2004b) with the SMA results. A good fit is obtained with a constant abundance of 2.5–3 in agreement with the results of Jørgensen et al. (2004b). It is noteworthy how well the SMA data are described by this constant abundance model. The single-dish observations of Jørgensen et al. (2004b) are not sensitive to the abundance in the innermost ( K) region. In IRAS 16293–2422 (Schöier et al., 2002) an enhancement by two orders of magnitude in the innermost, K, region was inferred on the basis of single-dish observations. In the case of IRAS2A, such enhancements appear to be ruled out by the interferometer observations presented in this paper.
In contrast to SO, SO2 only shows unresolved emission close to the central protostar. Jørgensen et al. (2004b) did not detect SO2 in the NGC 1333-IRAS2 envelope and the detection in this paper suggests a compact origin of the emission from this species with a jump in abundance of at least two orders of magnitude. The absence of a clear SO abundance enhancement at small scales is interesting in this context. Simply comparing our observed [SO2]/[SO] ratio to the models of the sulphur chemistry by Wakelam et al. (2004) would indicate that NGC 1333-IRAS2 is more evolved than IRAS 16293–2422. In terms of absolute abundances, however, the upper limit of of SO is in contradiction with any of the hot core models that predict SO abundances (e.g. Charnley, 1997; Wakelam et al., 2004). These results therefore suggest that SO does not probe a hot core around IRAS2A - or that its chemistry is significantly different from other known hot cores.
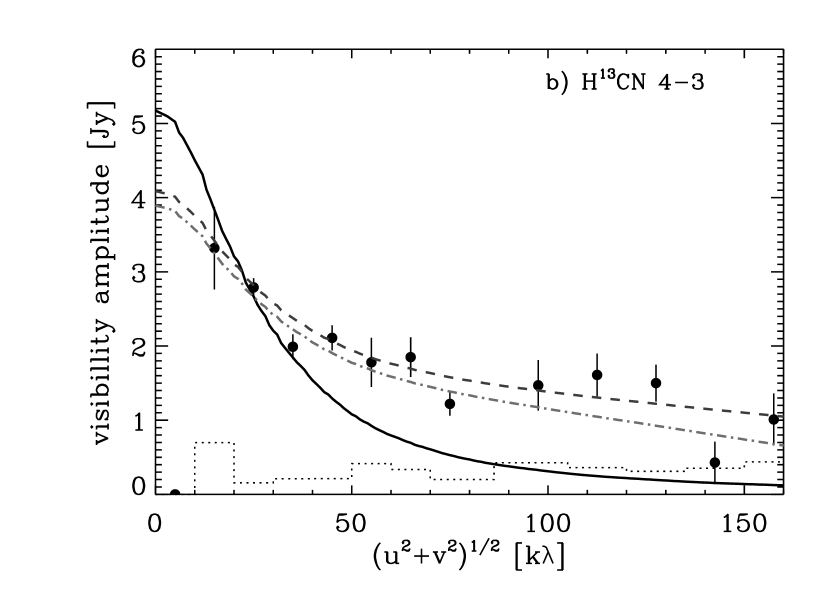
4.3.2 H13CN
For H13CN no good fit to the single-dish observations is obtained with a constant abundance model. This is similar to the case for CO and HCO+ where constant abundance models underestimate the intensity of the lowest excitation 1–0 transitions. Jørgensen et al. (2005a) suggested that the abundances vary radially with a so-called “drop” profile: in these models freeze-out occurs in the region of the envelope where the temperature is low enough to prevent immediate desorption, but where the density is high enough that the freeze-out timescales are shorter than the lifetime of the core. Similar type abundance profiles have been confirmed by high angular resolution observations of H2CO and CO toward other protostars (Schöier et al., 2004; Jørgensen, 2004) and found in detailed chemical-dynamical models (Lee et al., 2004). For the H13CN 4–3 observations in this paper (Fig. 4b) and the single-dish observations (Jørgensen et al., 2004b) a combined best fit is obtained with an abundance profile where depletion occurs at the same radius as it does for CO and HCO+ at a density of cm-3 and evaporation at small radii unresolved by the interferometer observations where the temperatures exceeds 70–90 K (radii smaller than 100 AU). This is expected if HCN comes off dust grains at roughly the same temperatures as H2O ice mantles (Doty et al., 2004). In terms of tracing the dense gas in the envelope, HCN and H13CN appear to be most useful probes of the inner envelope and/or disk with high abundances, strong transitions and only weakly affected by outflows (as it is also the case for the lower excitation lines (e.g., Jørgensen et al., 2004a)).
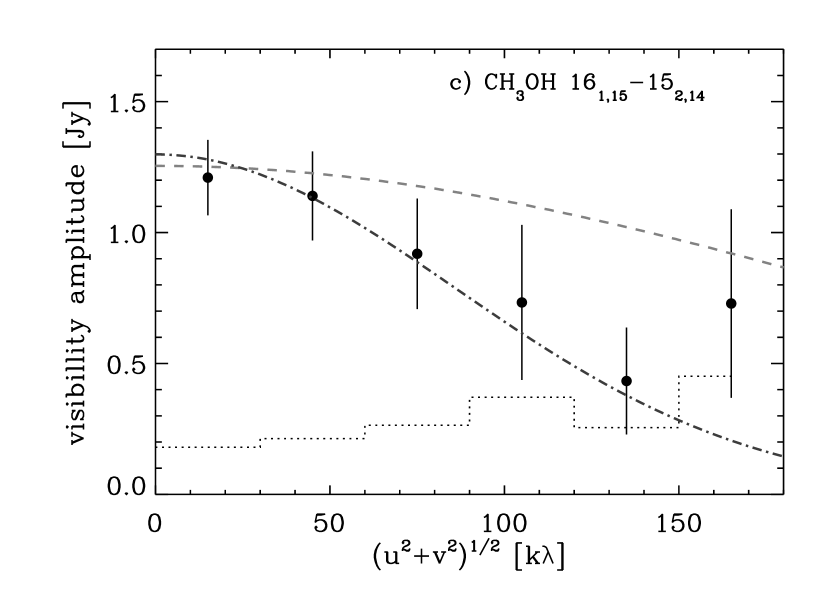
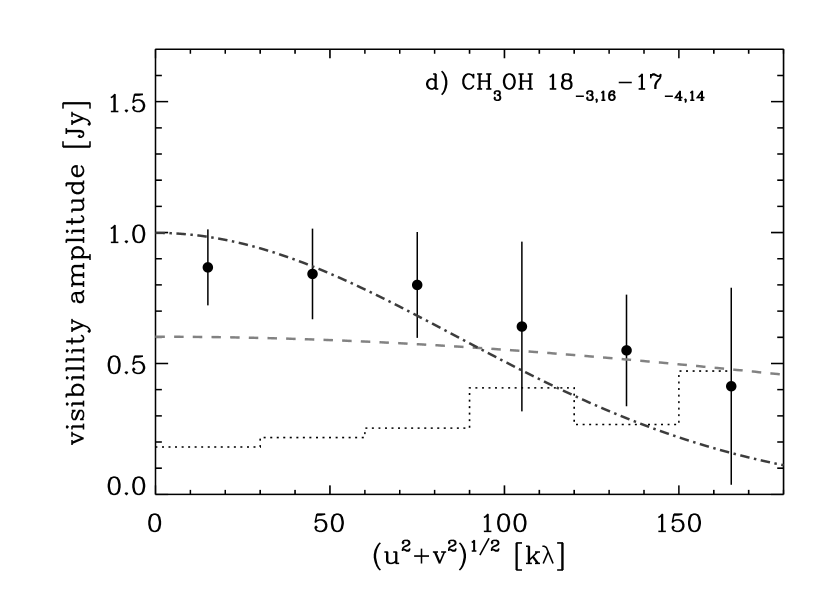
4.3.3 CH3OH and CH3OCH3
For the organic molecules the emission appears compact and mostly unresolved. For these species the abundances in the region where K (diameter AU or scales of 0.6′′; 300 k) are constrained by the observed high excitation lines, whereas their line intensities are largely independent of the abundance in the region outside this radius. For CH3OH the abundance in the inner envelope derived from the interferometer data is an order of magnitude higher than that derived on the basis of multi-transition single-dish observations (Jørgensen et al., 2005b). The CH3OH observations shown in Figs. 4c and 4d do show a slowly decreasing visibility amplitude with increasing baseline lengths, but the data are consistent with an unresolved component at the 2 level (dashed lines in Fig. 4c and d). An even better fit is obtained with a slightly extended (150-200 AU) Gaussian component (dashed-dotted lines).
5 Discussion
5.1 Origin of the compact structure
As explained above and seen for other low-mass protostars an additional source of continuum emission has to be present in addition to the envelope to explain the interferometer data. The SMA observes the brightness distribution of this source and can thereby constrain its physical parameters.
Taking the compact flux from the continuum data and adopting a dust opacity of 1.82 cm2 g-1 at 850 m (Ossenkopf & Henning, 1994, used in the envelope models), the mass (gas+dust) of a disk with a temperature of 150 K is 0.02 . This in turn corresponds to an average H2 column density of 1.6 cm-2 for a circular disk filling the beam with a diameter of 200 AU. Even in models where the envelope does not have an inner cavity, a disk column density of cm-2 is non-negligible compared to the hot core column density (i.e., pencil beam column density of the material in the envelope with a temperature higher than 90 K) of 3 cm-2.
These estimates of the disk column densities are simplistic and most likely a lower limit to the dust mass. First, the temperature of the dust may not be coupled to that of the gas. Lowering the dust temperature, however, increases the dust mass required to produce the same flux at the given wavelength. For example, adopting a disk temperature of 30 K increases the dust mass by a factor 5 to 0.1 . Second, Fig. 5 illustrates that the flux is consistent with a spectral index () from cm (Rodríguez et al., 1999; Reipurth et al., 2002) through mm (Jørgensen et al., 2004a) and submm wavelengths (this paper). The data in Fig. 5 are all from interferometer observations and cover an unprecendented range up to 350 GHz. The power-law exponent of 2 suggests that the compact source is caused by optically thick thermal dust emission from dust with opacity . It would therefore be more appropriate to estimate the dust mass on the basis of the longer wavelength points. Taking the 3.6 cm measurements of Reipurth et al. (2002), rather than the 850 m measurements from this paper, results in a dust mass of 0.1–0.5 (for temperatures of 150–30 K). Of course at the longer wavelengths it is less clear whether the dust opacity law is valid and if sources other than dust could be contributing to the observed compact emission.

As discussed in Sect. 4.2, the continuum interferometer data resolve the compact structure into at least two components, which we have modeled as an extended Gaussian structure (diameter of 300 AU) and an unresolved component. The size of the Gaussian component is similar to that of disks around more evolved T Tauri stars (e.g., Kitamura et al., 2002). Similarly-sized disks are found around other deeply embedded protostars (e.g., L1157; Gueth et al., 1997) but smaller disks are found around other protostars (e.g., IRAS 16293-2422B; Rodríguez et al., 2005). An interesting question is whether the smaller disks result from truncation in binary systems (e.g., Artymowicz & Lubow, 1994) or whether there is an evolution of disk size from the earliest stages and whether the smaller disks simply reflect the youngest systems (e.g., Terebey et al., 1984). The fairly extended Gaussian component in NGC 1333-IRAS2A would argue in favor of the first suggestion, i.e., that a circumstellar disk quickly builds up around low-mass protostars unless truncated in a binary system. Reipurth et al. (2002) did not resolve the compact continuum source seen at 3.6 cm with a beam size of about 0.3′′ (66 AU). If the 3.6 cm source is related to the submillimeter/millimeter source as the SED suggests, this would imply that the centimeter observations only pick up the peak, unresolved component of the submillimeter structure. The sensitivity of the centimeter observations by Reipurth et al. suggests that they would not detect an extended (300 AU), lower surface brightness component such as seen in the submillimeter observations.
In fact NGC 1333-IRAS2A may be a close ( AU) binary itself such as suggested by its quadrupolar outflow probed down to small scales (e.g. Jørgensen et al., 2004a). It is possible that the compact component seen in these data traces the disks around each of these binary components with the resolved Gaussian component reflecting an extended circumbinary disk. The unresolved source is responsible for about 30% of the total flux of the compact component suggesting that it contains a similar fraction of the mass.
5.2 Molecular emission from the circumstellar disk?
In the discussion of the hot core scenario in §4.3 we assumed that the envelope extends to small radii (23 AU; 0.1′′) where the temperature increases to 250 K. The analysis of the continuum emission indicates that a disk is present around NGC 1333-IRAS2, however, and an open question remains how much, if any, of the observed line emission can be attributed to such a disk. In particular, this is relevant if an inner cavity exists in the envelope around NGC 1333-IRAS2: as shown in Fig. 3 the continuum data are also consistent with an envelope where the temperature never exceeds 75 K. Such an inner cavity might be expected if the extended Gaussian component discussed above reflects the disk formed as a result of the rotation of the core. The size of the cavity (radius of 285 AU for the example with an envelope with an inner temperature of 75 K) would then be the centrifugal radius of the envelope within which the disk is formed (e.g., Terebey et al., 1984; Stahler et al., 1994; Basu, 1998).
In this scenario the disk would also have to be warm as indicated by the observed high excitation lines. Observations of compact CH3OH emission around another class 0 object, L1157, have suggested that the CH3OH emission is related to an accretion shock close to the central disk (Goldsmith et al., 1999; Velusamy et al., 2002). Ceccarelli et al. (2002) suggest that a disk with a heated accretion layer with a temperature of 170–250 K exists around the class I young stellar object Elias 29 from high FIR/sub millimeter CO observations.
| Molecule | Outer envelope | Envelope w. AU | Envelope w. AU | |
|---|---|---|---|---|
| a | b | Hot core abundance, c | Disk abundance, d | |
| HCNe | 2 | 2 | 7 | 2 |
| SO | 3 | 8 | 5 | |
| SO2 | 2.5 | 2 | 9 | |
| CH3OH | 1.0 | 2 | 3 | |
| CH3OCH3 | 3 | 2 | ||
aEnvelope abundance where K (for HCN: where
furthermore cm-3). SO2 and
CH3OH abundances from single-dish observations by
Jørgensen et al. (2004b, 2005b).
bEnvelope abundance where cm-3 and K.
cEnvelope abundance where K in model extending to K (inner radius of 23.4 AU).
dDisk abundance in model where envelope extends to K (inner radius of 285 AU).
eCalculated from H13CN abundance adopting 12C:13C isotope ratio of 70.
Assuming that the compact line emission comes from a homogeneous medium with a density of cm-3 (constant density in a 100 AU thick disk given the estimated column density) and a temperature of 150 K (see above), an estimate of the column density of each molecular species can be made using the non-LTE escape probability code Radex333An online version of the code can be found at http://www.strw.leidenuniv.nl/moldata (Jansen et al., 1994; Schöier et al., 2005). These can then be compared to the column densities inferred from the dust emission above. With these assumptions, the SO and SO2 abundances would be 5 and 9, respectively, and the H13CN abundance 310-11 (corresponding to an HCN abundance of 2 assuming standard isotopic ratios). Table 2 summarizes the derived abundance structures. The value for the SO abundance is consistent with the upper limit by Thi et al. (2004) toward the pre-main sequence disks around LkCa15. The disk column densities should be considered as lower limits (see Sect. 5.1) and therefore any abundances derived using the dust column densities are upper limits. A more detailed treatment of the disk physical structure (including its temperature and density variations) together with more observations of the emission from a larger number of molecules is needed for a complete picture of the disk chemistry in these early deeply embedded stages.
Possibly the best proof for either the “hot core” or “disk” scenario can come from resolving the molecular emission and addressing their intrinsic velocity fields. Bottinelli et al. (2004b) suggested that the discovery of organic molecules was evidence for hot cores due to the alignment with the dust emission. This is, however, not the case – as their dust emission observed at smaller scales more likely arises in the disks around the two binary components in IRAS 16293–2422. In fact, if the reservoirs of organic molecules observed in IRAS 16293–2422 are related to the larger scale envelopes seen for example by single-dish continuum observations, molecular species should be seen on intermediate scales between the “compact disk sources” and the “larger scale envelope”. Observations of more complex, asymmetric sources such as IRAS 16293–2422 might therefore be the best way to distinguish between the “accretion disk” and “hot core envelope” scenarios.
6 Summary
We have presented a detailed analysis of the physical and chemical structure of the low-mass protostar, NGC 1333-IRAS2A based on high angular resolution (1-2′′; 200-400 AU) observations with the Submillimeter Array. The data are compared to detailed continuum and line radiative transfer models to zoom in on the inner few hundred AU unhindered by emission from the lower density outer envelope. The conclusions are as follows:
-
•
Compact continuum emission is detected at 850m: the SMA observations resolve the compact continuum component, which can be fitted by two structures in addition to the large scale envelope constrained by single-dish observations: A resolved, 300 AU sized, Gaussian brightness distribution and an unresolved ( AU) structure, the latter contributing about 30% of the flux of the compact continuum component.
-
•
The spectrum of the compact continuum component follows a power-law, , from centimeter through submillimeter wavelengths. The favored explanation is that its origin is optically thick thermal dust emission from a circumstellar disk. The size of the disk around this young object suggests that the build-up of circumstellar disks proceeds rapidly in the protostellar stages. Smaller disks inferred around other protostars may be a consequence of tidal truncation by nearby binary companions.
-
•
Compact emission from lines of complex organic molecules including CH3OCH3 and CH3OCHO, high excitation CH3OH transitions, deuterated methanol CH3OD as well as lines of CO, HCN, H13CN, SO and SO2 are detected. The line data are interpreted in the context of previously published single-dish studies of the chemical structure of the protostellar envelope. The SO data are consistent with a low constant abundance throughout the envelope - an SO abundance enhancement at small scales is ruled out by the current observations. The complex organic species and SO2 in contrast are enhanced on small scales. H13CN follows the drop abundance structure also traced by CO and HCO+ with a high abundance in the outer region where the density is low and no depletion has occurred, an intermediate region with low temperatures and higher densities where depletion can occur and an inner region where HCN either evaporates off dust grains due to high temperatures or resides in the circumstellar disk.
-
•
A disk of the size suggested by the continuum emission cannot be neglected in the interpretation of line data. If this disk has a warm (100 K) layer, this could be the origin of the high excitation tracers and complex organic species on the smallest scales.
This paper illustrates the potential of the SMA for studying the detailed variations in the physical and chemical structure of low-mass protostellar envelopes, probing their innermost regions and constraining the properties of circumstellar disks. The SMA data and presented analysis will form a template for a large survey of deeply embedded low-mass protostars currently ongoing at the SMA.
References
- Artymowicz & Lubow (1994) Artymowicz, P., & Lubow, S. H. 1994, ApJ, 421, 651
- Basu (1998) Basu, S. 1998, ApJ, 509, 229
- Bottinelli et al. (2004a) Bottinelli, S., et al. 2004a, ApJ, 615, 354
- Bottinelli et al. (2004b) Bottinelli, S., et al. 2004b, ApJ, 617, L69
- Brown et al. (2000) Brown, D. W., Chandler, C. J., Carlstrom, J. E., Hills, R. E., Lay, O. P., Matthews, B. C., Richer, J. S., & Wilson, C. D. 2000, MNRAS, 319, 154
- Cazaux et al. (2003) Cazaux, S., Tielens, A. G. G. M., Ceccarelli, C., Castets, A., Wakelam, V., Caux, E., Parise, B., & Teyssier, D. 2003, ApJ, 593, L51
- Ceccarelli et al. (2002) Ceccarelli, C., Boogert, A. C. A., Tielens, A. G. G. M., Caux, E., Hogerheijde, M. R., & Parise, B. 2002, A&A, 395, 863
- Ceccarelli et al. (2000) Ceccarelli, C., Loinard, L., Castets, A., Tielens, A. G. G. M., & Caux, E. 2000, A&A, 357, L9
- Černis (1990) Černis, K. 1990, Ap&SS, 166, 315
- Chandler & Richer (2000) Chandler, C. J., & Richer, J. S. 2000, ApJ, 530, 851
- Charnley (1997) Charnley, S. B. 1997, ApJ, 481, 396
- Doty et al. (2004) Doty, S. D., Schöier, F. L., & van Dishoeck, E. F. 2004, A&A, 418, 1021
- Goldsmith et al. (1999) Goldsmith, P. F., Langer, W. D., & Velusamy, T. 1999, ApJ, 519, L173
- Gueth et al. (1997) Gueth, F., Guilloteau, S., Dutrey, A., & Bachiller, R. 1997, A&A, 323, 943
- Harvey et al. (2003) Harvey, D. W. A., Wilner, D. J., Myers, P. C., Tafalla, M., & Mardones, D. 2003, ApJ, 583, 809
- Ho et al. (2004) Ho, P. T. P., Moran, J. M., & Lo, K. Y. 2004, ApJ, 616, L1
- Jansen et al. (1994) Jansen, D. J., van Dishoeck, E. F., & Black, J. H. 1994, A&A, 282, 605
- Jørgensen (2004) Jørgensen, J. K. 2004, A&A, 424, 589
- Jørgensen et al. (2004a) Jørgensen, J. K., Hogerheijde, M. R., van Dishoeck, E. F., Blake, G. A., & Schöier, F. L. 2004a, A&A, 413, 993
- Jørgensen et al. (2002) Jørgensen, J. K., Schöier, F. L., & van Dishoeck, E. F. 2002, A&A, 389, 908
- Jørgensen et al. (2004b) Jørgensen, J. K., Schöier, F. L., & van Dishoeck, E. F. 2004b, A&A, 416, 603
- Jørgensen et al. (2005a) Jørgensen, J. K., Schöier, F. L., & van Dishoeck, E. F. 2005a, A&A, 435, 177
- Jørgensen et al. (2005b) Jørgensen, J. K., Schöier, F. L., & van Dishoeck, E. F. 2005b, A&A, 437, 501
- Kitamura et al. (2002) Kitamura, Y., Momose, M., Yokogawa, S., Kawabe, R., Tamura, M., & Ida, S. 2002, ApJ, 581, 357
- Kuan et al. (2004) Kuan, Y., et al. 2004, ApJ, 616, L27
- Lee et al. (2004) Lee, J.-E., Bergin, E. A., & Evans, N. J. 2004, ApJ, 617, 360
- Looney et al. (2000) Looney, L. W., Mundy, L. G., & Welch, W. J. 2000, ApJ, 529, 477
- Looney et al. (2003) Looney, L. W., Mundy, L. G., & Welch, W. J. 2003, ApJ, 592, 255
- Maret et al. (2004) Maret, S., et al. 2004, A&A, 416, 577
- Mundy et al. (1996) Mundy, L. G., et al. 1996, ApJ, 464, L169
- Ossenkopf & Henning (1994) Ossenkopf, V., & Henning, T. 1994, A&A, 291, 943
- Qi (2005) Qi, C. 2005, The MIR Cookbook, The Submillimeter Array / Harvard-Smithsonian Center for Astrophysics (http://cfa-www.harvard.edu/cqi/mircook.html)
- Reipurth et al. (2002) Reipurth, B., Rodríguez, L. F., Anglada, G., & Bally, J. 2002, AJ, 124, 1045
- Rodríguez et al. (1999) Rodríguez, L. F., Anglada, G., & Curiel, S. 1999, ApJS, 125, 427
- Rodríguez et al. (2005) Rodríguez, L. F., Loinard, L., D’Alessio, P., Wilner, D. J., & Ho, P. T. P. 2005, ApJ, 621, L133
- Sault et al. (1995) Sault, R. J., Teuben, P. J., & Wright, M. C. H. 1995, in Astronomical Data Analysis Software and Systems IV, ed. R.A. Shaw, H.E. Payne and J.J.E. Hayes, PASP Conf Series 77, 433
- Schöier et al. (2002) Schöier, F. L., Jørgensen, J. K., van Dishoeck, E. F., & Blake, G. A. 2002, A&A, 390, 1001
- Schöier et al. (2004) Schöier, F. L., Jørgensen, J. K., van Dishoeck, E. F., & Blake, G. A. 2004, A&A, 418, 185
- Schöier et al. (2005) Schöier, F. L., van der Tak, F. F. S., van Dishoeck, E. F., & Black, J. H. 2005, A&A, 432, 369
- Shirley et al. (2002) Shirley, Y. L., Evans, N. J., & Rawlings, J. M. C. 2002, ApJ, 575, 337
- Stahler et al. (1994) Stahler, S. W., Korycansky, D. G., Brothers, M. J., & Touma, J. 1994, ApJ, 431, 341
- Terebey et al. (1984) Terebey, S., Shu, F. H., & Cassen, P. 1984, ApJ, 286, 529
- Thi et al. (2004) Thi, W.-F., van Zadelhoff, G.-J., & van Dishoeck, E. F. 2004, A&A, 425, 955
- van Dishoeck et al. (1995) van Dishoeck, E. F., Blake, G. A., Jansen, D. J., & Groesbeck, T. D. 1995, ApJ, 447, 760
- Velusamy et al. (2002) Velusamy, T., Langer, W. D., & Goldsmith, P. F. 2002, ApJ, 565, L43
- Wakelam et al. (2004) Wakelam, V., Caselli, P., Ceccarelli, C., Herbst, E., & Castets, A. 2004, A&A, 422, 159