The infrared Hourglass cluster in M8††thanks: Based in part on observations with NASA/ESA Hubble Space Telescope obtained from the archive at the Space Telescope Science Institute, which is operated by the Association of Universities for Research in Astronomy, Inc., under NASA contract NAS 5-26555. ††thanks: Based in part on observations obtained at European Southern Observatory, La Silla, Chile.
Abstract
A detailed study of the Hourglass Nebula in the M8 star forming region is presented. The study is mainly based on recent subarcsec-resolution images taken at Las Campanas Observatory and complemented with archival HST images and longslit spectroscopy retrieved from the ESO Archive Facility. Using the new numerical code CHORIZOS, we estimate the distance to the earliest stars in the region to be 1.25 kpc. Infrared photometry of all the sources detected in the field is given. From analysis of the colour-colour diagrams, we find that an important fraction of these sources exhibit significant infrared excess. These objects are candidates to be low- and intermediate-mass pre-main sequence stars. Based on HST observations, the spatial distribution of gas, dust and stars in the region is analyzed. The morphological analysis of these images also reveals a rich variety of structures related to star formation (proplyds, jets, bow shocks), similar to those observed in M16 and M42, along with the detection of the first four Herbig-Haro objects in the region. Furthermore, a longslit spectrum obtained with NTT confirms the identification of one of them (HH 870) in the core of the Hourglass nebula, providing the first direct evidence of active star formation by accretion in M8.
keywords:
1 Introduction
The Lagoon Nebula (Messier 8 = NGC 6523-NGC 6530) is an extended H ii region mainly ionized by two O-type stars, 9 Sagitarii [O4 V((f))] and HD 165052 (O6.5 V + O7.5 V). It is embedded within a molecular cloud which extends to the star cluster NGC 6530. This very young open cluster is believed to be the starting point for a sequential star formation process (Lightfoot et al. 1984) which is still active in the region. Within M8’s core lies a distinctive bipolar nebula called the Hourglass, a blister-type H ii region which has been produced by the O7.5 V star Herschel 36 (Her 36). The Hourglass, which is about 15” EW 30” NS in size, is believed to be an ionized cavity in an inhomogeneous clumpy molecular cloud. The Hourglass region also harbours the ultracompact H ii region G5.97-1.17 as well as a number of infrared sources, first observed by Allen (1986), which may form a cluster of very young hot stars, analogous to the Orion Trapezium (Allen 1986). Narrow band optical imaging with HST reveals that G5.97-1.17 could be a young star surrounded by a circumstellar disk that is being photoevaporated by Her 36, similar to the so-called proplyds seen in the Orion Nebula (Stecklum et al. 1998). Furthermore, strong H2 line emission is produced from around the Hourglass, showing a morphology very similar to that of the CO J=3-2 distribution in the region (White et al. 1997; Burton 2002). This fact and the detection of a jet-like feature extending from Her 36 in HST images (Stecklum et al. 1995) suggest there might be a molecular outflow in the core of M8 (Burton 2002). Recently, Rauw et al. (2002) reported X-ray emission from Her 36 as well as probably diffuse X-ray emission from the Hourglass region that might reveal a bubble of hot gas produced by the interaction of the stellar wind of Her 36 with the denser part of the molecular cloud.
In this paper, new high-resolution near-infrared images and photometry of the field surrounding the Hourglass are presented and compared with archival HST emission-line images. All these data provide strong evidence that the core of M8 is an important region of active star formation and pre-main sequence stellar evolution.
2 Observations and Data Reduction
2.1 Infrared Images
, and () images of the Hourglass region were obtained on September 26 1999, using the near-infrared camera IRCAM, attached to the 2.5-m Du Pont Telescope at Las Campanas Observatory (LCO), Chile. IRCAM was equipped with a NICMOS III array (Persson et al. 1992) and has a pixel scale of 035 . The seeing during the observations was typically of 08-09 giving an optimum sampling. In each band, five partially overlapping frames were taken, covering a total area of 135”139” centered approximately at the position of Her 36. The total on-source times were 360 s in , 500 s in and 600 s in . The frames were combined (median-averaged) after being linearised, dark- and sky-substracted, flat-fielded and cleaned of bad pixels, using SQIID processing routines layered in IRAF111IRAF is distributed by NOAO, operated by AURA, Inc., under agreement with NSF.. Several standard stars selected from Persson et al. (1998) were observed during the night; these fields were reduced following a similar procedure. The combined (final) images of the Hourglass were then shifted to align stars in each frame.
2.2 HST/WFPC2 Imaging
A partial HST/WFPC2 coverage of the Hourglass Nebula is available from the public database. These images include the brightest part of the nebula and the star Her 36, both centred in the Planetary Camera chip. The orientation of the images (P.A.= 560919) allow to cover the west part of the nebula and they correspond to about of the field observed in our infrared images. The WFPC2 data set (Proposal ID. 6227) was obtained in 1995 July 13, 14, and September 16, using several narrow band and broad band filters. These observations were retrieved from the HST Archive and processed using the “on-the-fly” pipeline. In this work, we use images obtained in F487N (H), F656N (H), F658N ([N ii]), F673N ([S ii]) narrow band filters, and F547M (), F814W (Johnson ) broad band filters. The filter characteristics are described in the WFPC2 Instrument Handbook. The first steps of data reduction were straightforward, using IRAF and STSDAS tasks to do cosmic ray cleaning, and integrating the four individual WFPC2 CCD images into a single mosaic. In order to obtain flux calibrated ”pure nebular” H and H images, we followed the procedure given by O’Dell & Doi (1999). A ”pure” H calibrated image was derived from the F487N image, using the F547M images as continuum. A ”pure” H calibrated image was obtained from F656N ”line” image, considering the contamination of [N ii] emission lines through the F658N filter, and again using the F547M as continuum image. In the case of F673N filter used to derive ”pure” [S ii] calibrated emission line image, the continuum was interpolated between the F547M and F814W images and the zero-points determined by synphot (STScI 1999).
2.3 Long-slit Echelle Spectroscopy
Two long-slit spectra obtained with ESO Multi-Mode Instrument (EMMI) on NTT were retrieved from the ESO Archive Facility. The spectra were obtained on July 31st 2000 in the REMD (red medium dispersion) configuration with echelle (#10) grating. The order containing H and [N ii] emission lines was isolated using the filter Ha#596. The detector was a Tek CCD with 24-m pixels, given a pixel scale of 0265 0.041 Å and a spatial extent along the slit of . The spectra were obtained with a . The total exposure time was 1800 s.
3 Results
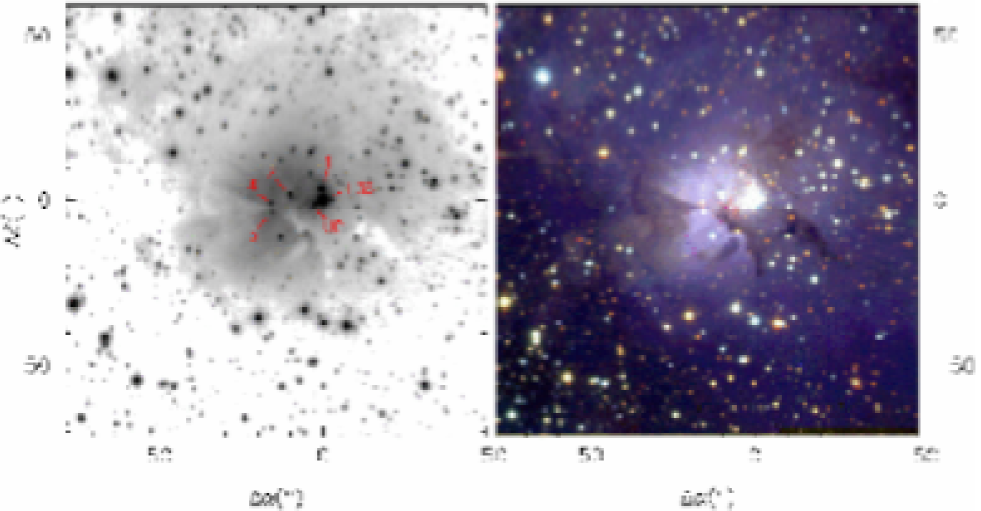
Figure 1 (left-hand panel) shows the frame of the field surrounding the Hourglass Nebula. Figure 1 (right-hand panel) is a colour composite image, produced combining the (1.25 ), (1.65 ) and (2.2 ) images as blue, green, and red channels, respectively. This false-colour picture shows the effects of extinction, the differences in colour of the stars mainly being due to differences in reddening. This figures confirm the existence of an infrared star cluster around Her 36, as was recently reported by Bica et al. (2003).
3.1 Distance
Most previous investigators estimated the distance to NGC 6530 as 1.8 Kpc ()(van Altena & Jones 1972; Sagar & Joshi 1978; van den Ancker et al. 1997). A smaller value was however obtained by Kilambi (1977) (). More recently, Sung et al. (2000) calculated the distance modulus of several individual stars, finding that some of them gave values near to , while other early-type stars gave somewhat smaller values (). A more robust determination by Prisinzano et al. (2005), considering a sample that reaches down to , lead to the value of , which means a significantly lower cluster distance of 1.25 Kpc. This distance determination is based on more complete colour-magnitude diagrams, for which it is possible to define the blue envelope of the star distribution with because of the obscuration effect of the giant molecular cloud which strongly reduces the detection of background stars at optical wavelengths.
Although this indetermination in the distance to M8 does not change the main conclusions of this work, we explore the possibility of deriving our own estimate by considering a group of stars around Her 36 with known spectral types. We gathered optical photometry from Sung et al. (2000) and from the Galactic O Star Catalog (Maíz-Apellániz et al. 2004a), as well as near-infrared photometry from this work or from the 2MASS All-Sky Point Source Catalog (PSC) (Second Incremental Data Release, Cutri et al. 2000) for Her 36, 9 Sgr (HD 164794), W 9 (HD 164816), SCB 182, SCB 325 and SCB 354 (hereafter we use “SCB number” to refer to the sources from Sung et al. 2000). For the O-type stars, the adopted spectral types were either obtained from Maíz-Apellániz et al. (2004a) (Her 36, 9 Sgr) or derived from our spectroscopic data (W 9). The stars 9 Sgr and W 9 are both suspected to be spectroscopic binaries (cf. Mason et al. 1998). Arias et al. (2005) have detected both components in W 9, resulting a spectral classification of O 9.5V + B0 V, and have also confirmed the binary nature of 9 Sgr and Her 36. For B-type stars (SCB 182, SCB 325, SCB 354) we adopted the spectral types from van den Ancker et al. (1997).

| Name | Spectral type | |||||||
| Her 36 | O7.5 V(n) | 10.297 | 2.32 | |||||
| 9 Sgr | O4 V((f)) | 5.966 | 1.00 | |||||
| W9 | O9.5 V+B0 V | 7.089 | 2.34 | |||||
| SCB 182 | B2 V | 9.953 | 0.90 | |||||
| SCB 325 | B7 V | 11.552 | 2.75 | |||||
| SCB 354 | B7 V | 11.922 | 2.11 | |||||
| ∗ Values from Walborn (1972, 1973). | ||||||||
| † and are the monochromatic equivalents to and , see Maíz-Apellániz (2004). | ||||||||
We used the code CHORIZOS developed by Maíz-Apellániz (2004) to derive the individual distance modulii of these stars. CHORIZOS is a code that uses minimization to find all models compatible with the observed data set in the model (-dimensional) parameter space, in our case, broadband photometry and spectral types. For a complete description of how this method works see Maíz-Apellániz (2004). We considered TLUSTY (Lanz & Hubeny 2003) atmosphere models and Kurucz (Kurucz 2004) models for the spectral energy distribution (SED) of O-type and B-type stars, respectively. Figure 2 shows the SED corresponding to the best CHORIZOS fit (spectrum) and the synthetic photometry associated with the best SED (stars) for Her 36. The photometric data used for the CHORIZOS fit are also shown in the figure. and filters were not considered due to the infrared excess of Her 36, which is readily apparent in the plot. Table 1 lists all the compiled quantities and the derived parameters, i.e., the colour excess and the ratio of total to selective absorption , which are the monocromatic equivalents to the usual and , respectively (for a detailed explanation see Maíz-Apellániz 2004), and the distance modulus. The values corresponding to the best fit in each case have also been included in the last column. The main source of error comes from the adopted values of the absolute magnitudes. The value is close to the canonical one of 3.1 only for W9; for the rest of the stars it shows ”anomalous” values. In particular, the value of derived for Her 36, which represent one of the highest values known (cf. Cardelli, Clayton, & Mathis 1989), is in excellent agreement with earlier estimations. Besides, as mentioned before, the analysis of its SED using CHORIZOS shows that this star presents an evident infrared excess, which is also apparent in the near-infrared colour-colour diagram (see Section 3.3).
As also shown in Table 1, the four earliest stars lead to an average distance modulus of nearly 10.5 (1.25 Kpc), clearly lower than the previously adopted by other authors and similar to the value derived by Kilambi et al. (1977). On the other hand, the distance modulii derived for the two B7-type stars is somewhat larger (). Such problem is illustrated in the Hertzprung-Russell diagram compiled from the CHORIZOS output which is shown in Figure 3. Ellipses indicate the 68% likelihood contour for each star. The main sequence for has been marked with a solid line. As seen in the plot, such a distance is compatible with the CHORIZOS output for the four earliest stars but not for the latest two.
We note here that the association of 9 Sgr, located to the NE of Her 36, with the Hourglass region is based not only in a common distance but also in the observed morphology of the gas and dust in the region. Besides a dust “finger-shape” structure that will be discussed later, the northern part of the nebula seems to be illuminated by this massive star. This is especially evident in the photodissociation regions (PDRs) facing to 9 Sgr observed in HST images (see Figures 11 and 12 in Section 3.8).
Based on the values derived for the earliest stars, which are systematically smaller than the previously published, we adopt a distance modulus of for the Hourglass region. A posible explanation for the disagreement with the values derived by other authors is considered here.

As pointed out by van den Ancker et al. (1997), the study of a very young open cluster like NGC 6530 can not be performed using average extinction laws, since each star has its own individual extinction characteristics. In fact, anomalous extinction laws have been found for several stars embedded in the cluster. This may be a serious obstacle when deriving distance modulii from the observed optical colours, as done in most previous studies. In the infrared however, the greatly reduced extinction and the independence of the extinction law with the ratio of total to selective absorption (Jones & Hyland 1980; Cardelli et al. 1989; Martin & Whittet 1990; Whittet et al. 1993), make distance determinations more reliable.
An alternative interpretation for the disagreement between the distance values derived by different authors may be that, when looking at the direction of NGC 6530, we are actually seeing distinct groups of stars placed at different depths. Figure 10 in van den Ancker et al (1997) shows the distribution of the distances of individual stars in the cluster, from which they estimated an average distance of 1.8 kpc. However, the distribution has a remarkable secondary peak around 1.5 kpc. In this way, the two B7-type stars analyzed with CHORIZOS (SCB 325 and SCB 354) lead to distance modulii of 11.04 and 11.55, respectively. Both stars are located to the east of the Hourglass Nebula, in a region with lower reddening, as inferred from their colour excesses . So they presumably locate deeper in the spiral arm but are being observed through a window relatively free of dust. Finally, as mentioned above, Sung et al. (2000) also obtained two values for the distance modulus, but they left out the shorter distance estimate with the argument that many of the B-type stars were probably binaries.
Distance estimations to such very young open clusters are extremely complicated since they require the knowledge of the extinction, which is really due to circumstellar rather than intracluster material (van den Ancker et al. 1997). Each star have its own extinction law, and hence a very detailed study is needed. We conclude that a definitive distance to the Hourglass Nebula is not yet established, but the CHORIZOS analysis of the earliest stars in the region is in favour of a distance modulus of 10.5 (1.25 kpc).
3.2 Photometry of infrared sources
Point-spread function (PSF) photometry was performed using IRAF/DAOPHOT-II software running in a Linux workstation. Stellar-like sources with fluxes significantly above the mean background were extracted using a threshold flux of . A set of PSF star candidates was selected in each image avoiding nebular and crowded regions. The PSF was calculated using a lorentz function and one look-up table. The final PSF photometry was performed on all the extracted sources using an aperture 3 pixels in radius. This corresponds to an aperture diameter which is roughly that of the measured full width at half-power of a typical stellar image. Aperture corrections were computed between apertures of 3 and 15 pixels in radius using the same PSF stars. The final number of detected sources was 762 in , 748 in and 653 in with sensitivity limits of 17.5, 18.5 and 19.2, respectively. The photometric limits were assumed to be the magnitude corresponding to the peak of the star distribution. This maximum occurred at about 1.5 mag brighter than the magnitude where the distribution fell to zero, i.e., 16.0 in , 17.0 in and 17.7 in . The average photometric errors in all colours are 0.03 for sources with mag brighter than these limits and up to 0.2 for the faintest sources. Table 4 (in separated file) gives the position and photometry of all the infrared sources detected in the field. Running number sources are in column 1, column 2 and 3 are right ascension and declination (J2000), columns 4, 5, 6, 7, 8, 9 are , , magnitudes and their errors, columns 10 and 11 are and colours, and column 12 contains comments related to the identification of optical counterparts.
In order to detect systematic photometric errors produced by aperture corrections and standard zero-points, we compared the magnitudes derived from our photometry for some relatively bright stars with those from the 2MASS All-Sky Point Source Catalog (PSC) (Second Incremental Data Release, Cutri et al. 2000). Considering only the sources in 2MASS with quality “”, we found an average difference in , and magnitudes of , and , respectively, so no further correction was performed.
Positions in equatorial coordinates for the individual sources were established based on the 2MASS Point Source Catalogue (All-Sky 2003). The rms residuals between the positional tables from this work and from 2MASS database are found to be 011 and 012, in and respectively.
3.3 Colour-Colour and Colour-Magnitude Diagrams
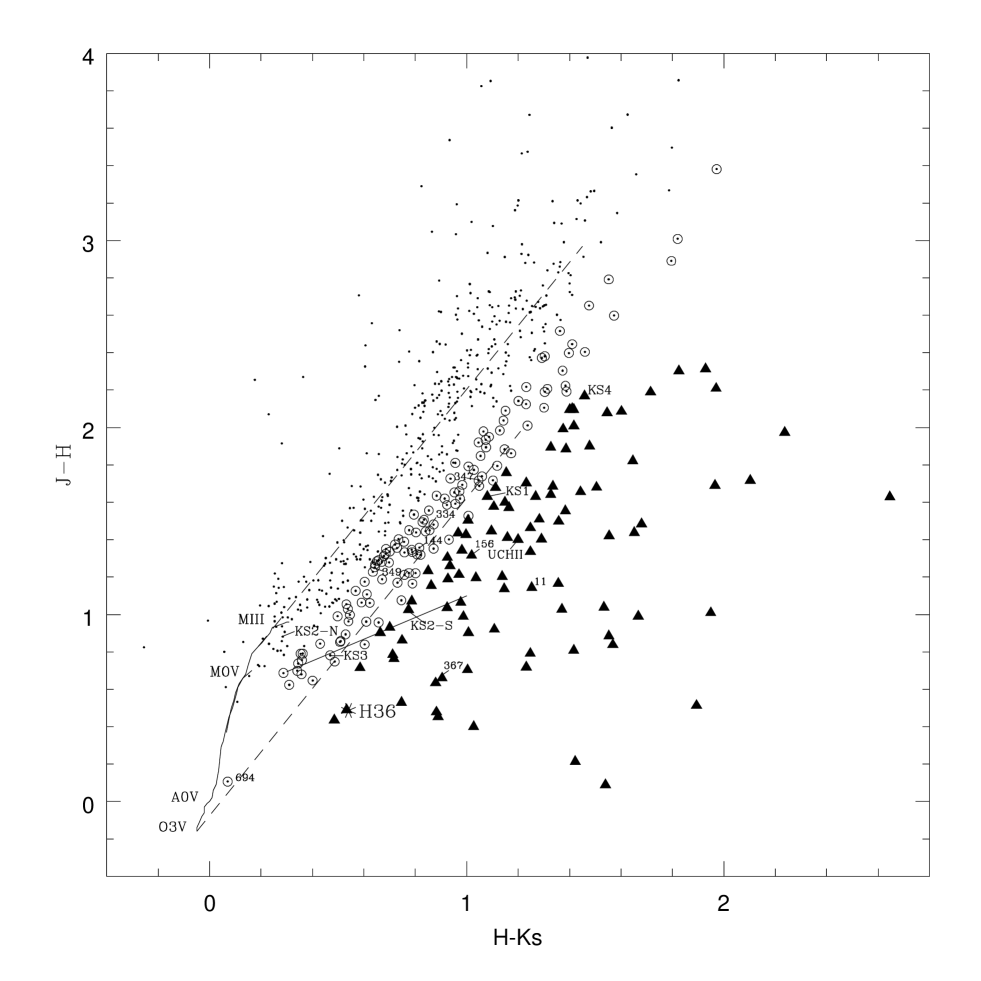
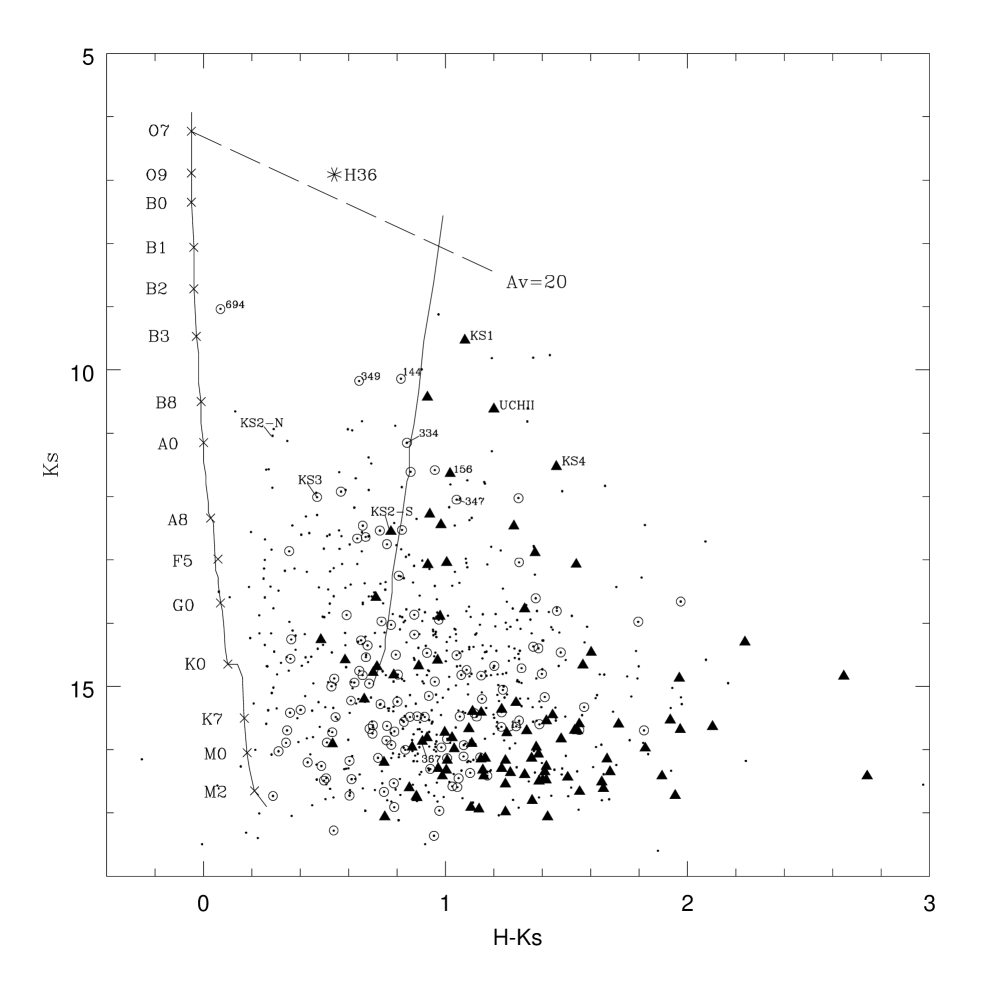
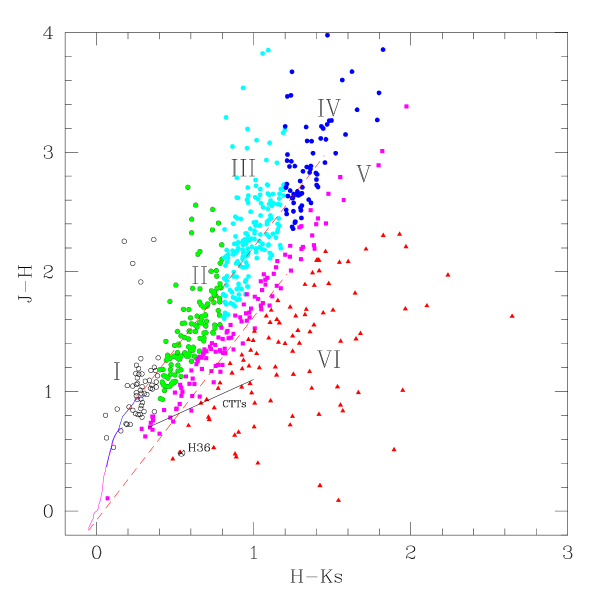
A near-infrared colour-colour (CC) diagram of the Hourglass region is illustrated in Figure 4 for the 647 sources in the field detected in all three wavelength bands. Also plotted in Figure 4 is the locus of points corresponding to the position of the unreddened main sequence and the position of the red giants. The two parallel dashed lines represent the reddening vectors for early- (O3 V) and late-type (M0 III) stars, determined using the values of extinction from Rieke & Lebofsky (1985); their length corresponds to mag. Figure 5 shows the , colour-magnitude (CM) diagram for the same stars. The position of the main sequence has been plotted, corrected to an apparent distance modulus of 10.5, which, as was previously discussed, is appropiated for the Hourglass region. The reddening vector for an O7 V is also plotted for a visual extinction of 20 mag. The vertical solid line denotes the location of giant stars (Koornneef 1983; Zombeck 1990) for the distance of the Galactic Bulge (8 kpc) and reddened by due to the interstellar component. The position of Her 36, using near-infrared data from 2MASS, has been marked for reference. We note here that, if we compare the data with the zero-age main sequence (ZAMS) instead of the main sequence, both Her 36 and SCB 182 (source #694) fall about 1 mag above the expected location according to their spectral types (O7.5 V and B2.5 V, respectively). This shift is even larger ( 2 mag) considering the distance modulus of 11.3 suggested by other authors.
As M8 is located not far from the direction to the Galactic Centre, many field interlopers can be expected. In particular, it is very probable to be intercepting part of the giant population of the galactic inner disk and Bulge. In this way, the CC and CM diagrams show a superposition of well-distinguished stellar components. Unfortunately, no control fields were taken for these observations, but in order to account for the distribution of the foreground/background field stars, photometry corresponding to a 5 arcmin radius circular field located off the nebula at and ( 18’ in at the same ) was retrieved from the 2MASS catalog. We considered only the sources with photometric errors lower than 0.1 mag. This field was chosen to be free of significant interstellar material by examination of IRAS surveys in the region. Based on these data we studied the distribution of the field stars, which shows a significant concentration of sources around , probably indicating the average colour of the Bulge red giants which must be highly affected by interestellar reddening (see Figure 6). A similar analysis for the sources with of the Hourglass field revealed a peak around , with a considerable spread to larger values, due to the differential extincion originated in the molecular cloud. In addition, both histograms show a secondary peak around , probably associated with main sequence stars moderately affected by reddening. We note here that the number of infrared sources detected in the Hourglass field almost doubles the number expected from the ratio of the areas of the on and off field observations. Two facts can account for this: the existence of an infrared cluster around Her 36 and the much higher resolution of our observations.

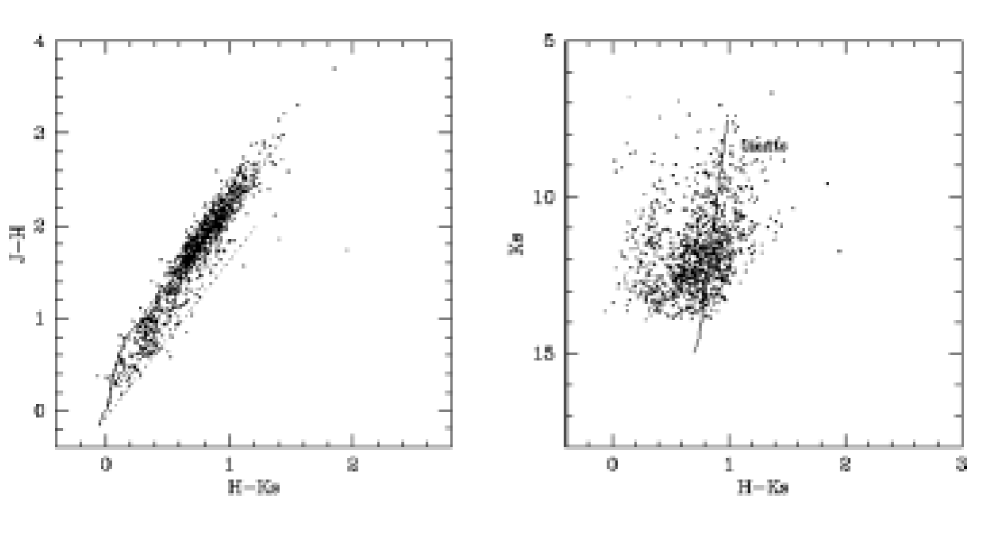
Using 2MASS data we also constructed the CC and CM diagrams for the control field (Figure 7). The CC diagrams for the control field and the Hourglass region clearly differ. The stars in the control field appear confined in two regions: a very crowded region corresponding to the highly reddened giants of the Bulge and disk, and a less populated region associated with field main sequence stars with little reddening. On the other hand, the stars in the Hourglass region spread over a much larger area of the CC diagram. Besides the two components observed in the control field, which confirm that a significant fraction of the stars are background field stars unrelated to the cloud, there is a significant number of sources located along and to the right of the reddening vector of an O dwarf star. These stars with intrinsic colours indicative of near-infrared excess emission must be associated with young stellar objects (YSOs), such as Class I “protostars”, Herbig Ae/Be objects and T Tauri stars.
In Figure 4 two kinds of symbols have been used in order to discriminate between objects of different nature. In this way, filled triangles represent sources with evident infrared excess, which are prime candidates to be included among the YSOs previously mentioned. On the other hand, open circles may denote either classical T Tauri stars affected by moderate to large amounts of reddening, or extremely reddened early-type main-sequence stars. For example, according to its position in the CC and CM diagrams, source #349 could be either a classical T Tauri star with mag, or an early B-type star affected by more than 11 mag of extinction. Spectroscopic observations are needed for a definitive conclusion.
Also evident from Figure 4 is the lack of stars within the lower part of the reddening band , reflecting a threshold in the extinction caused by the presence of the molecular cloud. Just beside this gap, there is a group of sources vertically distributed around , which presumably represents the main sequence at the Hourglass distance. This idea is supported by the presence of a similar distribution to the right and parallel to the main sequence of the CM diagram. If so, the mean extinction toward the region can be estimated from a simple approximation (Rieke & Lebobfky 1985), , adopting for the main sequence stars an average intrinsic colour excess of 0.2 mag. This leads to mag ( mag).
The CM diagrams for the control and the Hourglass fields are also clearly different. The bulk of the stars in the control field distribute in a band around (which approximately coincides with the vertical line that represents the location of red giants for the distance of the Galactic Bulge), in contrast with the Hourglass field, where the sources appear in a wider range of and a great number of them show large values of this colour. The large colour for these sources is likely intrinsic and due to excess infrared emission, as deduced from their locations in the infrared excess region of the CC diagram.
Before concluding this section, we want to stress that the comparison of the infrared photometric diagrams suggests that an important fraction of the stars observed toward the Hourglass Nebula are background field stars unrelated to the cloud, presumably red giants of the galactic inner disk and Bulge. These objects are significantly reddened as a result of interestellar extinction through the line-of-sight, plus a diferential contribution of an inhomogeneus molecular cloud, which, as will be discussed in next section, posseses clumps dense enough to block background radiation.
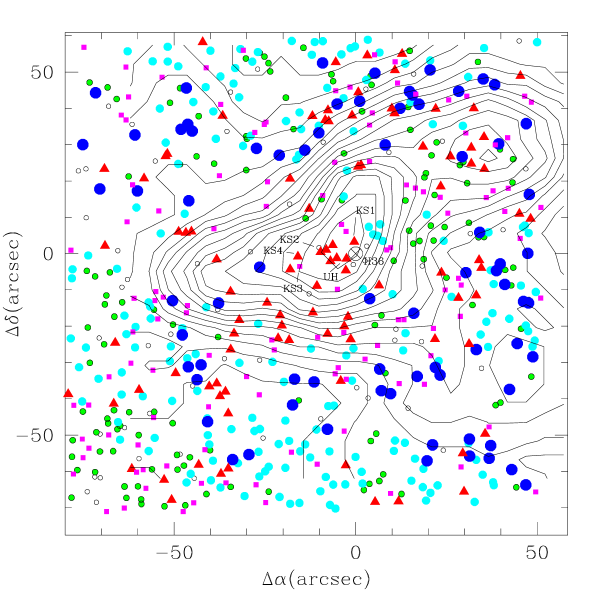
As previously mentioned, when we observe in the direction of M8 we are actually seeing a superposition of distinct stellar populations placed at different distances from us, which significantly complicates the interpretation of the results. Trying to clarify this situation, we divided the infrared sources observed toward the Hourglass in six groups according to their infrared colours. Groups I, II, III and IV include sources located above the track (), with , , and , respectively. This track has been chosen as the straight line parallel to the reddening vectors, passing approximately through the blue end of the classical T Tauri loci of Meyer et al. (1997). In some way it may be considered as a dividing line between early- and late-type stars, as it coincides with the reddening track of a mid-F type dwarf. Since these sources are expected to be members of the stellar population of the inner disk and Bulge, we call them “giants”, even though group I may have a contribution of late-type main sequence dwarfs with lower reddening. Groups V and VI include sources below the former track. Whereas group V is expected to contain both classical T Tauri stars with lower reddening and/or highly reddened early-type dwarfs, group VI will include only objects with genuine infrared excess. In Figure 8 we plotted the spatial distribution of each stellar group using different symbols and colours. A colour CC diagram has been included for reference.
Furthermore, in order to quantify the complex distribution of sources in the region, we subdivided the observed field in nine areas of about 45”45” (which we call from upper left to lower right, NE, N, NW, E, C, W, SE, S and SW, respectively), and counted the number of stars of each group in every subregion. The resulting star counts are presented in Table 2. The interpretation of Figure 8 and Table 2 will be discussed in the following subsections.
| Subregion | NE | N | NW | E | C | W | SE | S | SW | sum |
|---|---|---|---|---|---|---|---|---|---|---|
| Group | ||||||||||
| I | 6 | 5 | 5 | 9 | 7 | 6 | 12 | 5 | 3 | 58 |
| II | 10 | 17 | 15 | 12 | 5 | 19 | 33 | 9 | 7 | 127 |
| III | 14 | 29 | 8 | 20 | 9 | 23 | 22 | 38 | 17 | 180 |
| IV | 9 | 8 | 13 | 4 | 2 | 11 | 4 | 8 | 14 | 73 |
| V (ms) | 10 | 13 | 15 | 12 | 10 | 16 | 25 | 11 | 7 | 119 |
| VI (ex) | 6 | 11 | 14 | 6 | 27 | 9 | 13 | 5 | 4 | 95 |
| sum | 55 | 83 | 70 | 63 | 60 | 84 | 109 | 76 | 52 | 652 |
| “giants” | 39 | 59 | 41 | 45 | 23 | 59 | 71 | 60 | 41 | 438 |
| (I+II+III+IV) | ||||||||||
| ms+ex | 16 | 24 | 29 | 18 | 37 | 25 | 38 | 16 | 11 | 214 |
| (V+VI) | ||||||||||
| ratio ex/giants | 0.15 | 0.19 | 0.34 | 0.13 | 1.17 | 0.15 | 0.18 | 0.08 | 0.10 | 0.22 |
| ratio (ms+ex)/giants | 0.41 | 0.41 | 0.71 | 0.40 | 1.61 | 0.42 | 0.54 | 0.27 | 0.27 | 0.49 |
| ratio ex/ms | 0.60 | 0.85 | 0.93 | 0.50 | 2.70 | 0.56 | 0.52 | 0.45 | 0.57 | 0.80 |
3.4 The extinction map
We note here that, in contrast to other studies of dust extinction in molecular clouds (for example: Lada et al. 1994), it is not easy to infer the mean intrinsic colour of background stars from the control field stars, since these objects themselves suffer significant random extinction due to a large depth in the line-of-sight. Anyway, we choose as a representative value, which is equivalent to the colour of an early K star, and follow the procedure described in Lada et al. (1994), in order to map the distribution of colour excesses (and hence, extinctions) through the cloud. We derived the mean colour excess for all the sources located along the reddenning vector of a giant star in the Hourglass CC diagram, i.e. all the candidate late-type stars of the galactic inner disk and Bulge. In a rough approximation, these can be considered as the objects in the groups I, II, III and IV introduced in section 3.3. These measurements were then converted to a mean extinction in the band, , using the reddening law from Rieke & Lebosfky (1985):
We consider instead of the visual extinction , since the latter expression is valid only to the extent that the reddening law in this cloud is a normal one. Disregarding the objects in groups V and VI (plotted with magenta and red, respectively), which can be roughly adopted as belonging to the M8 region itself, Figure 8 (bottom) represents a randomly sampled map of the distribution of extinctions across the Hourglass nebula, obtained by plotting the position of each field star with a circle whose size and colour depend on the total extinction derived from its infrared colours (from the largest to the smallest extinction, we have big blue, cyan, green and open circles). In spite of the depth of our infrared observations, the centre of the cloud remains devoid of stars, indicating the presence of extremely high extinctions. Also evident is the existence of an extinction gradient extending from the position of Her 36. In Figure 8 we overlay a contour map of the integrated CO emission from White et al. (1997). The correspondence between our extinction map and the distribution of molecular material is impressive, demostrating that the extinctions derived for the individual candidates for background giants are good tracers of the molecular cloud.
3.5 The infrared cluster around Herschel 36
By photometry, 763 sources have been extracted from a 135”139” area around the massive star Her 36, the vast majority of which had not been detected by previous observations. 652 of these sources have been detected in all three wavelength bands and are plotted in the CC and CM diagrams in Figures 4, 5 and 8. The analysis of these infrared diagrams lead us to suggest that an important fraction of the stars observed toward the Hourglass are background field stars, probably red giants of the inner disk and Bulge. Adjusting for this background contamination is however extremely difficult. Although somewhat rough, a direct alternative is to consider the extreme case in which all the sources in groups I, II, III and IV are foreground/background field stars, while all the sources in groups V and VI belong to the cluster (see section 3.3 and Figure 8 for the definition of the stellar groups). Then the number of infrared sources expected to be related to the region may be about 214. 95 of them show genuine moderate and large infrared excesses, yielding a fraction of near-infrared excess sources of about 45 per cent. We should keep in mind that we have presumably overestimated the number of objects associated to the molecular cloud, and therefore the resulting fraction of infrared excess sources may be only a lower limit. Anyway, the estimated value is close to the fraction found within the Taurus (50 %) (Kenyon & Hartmann 1995), NGC 1333 (60 %) (Lada et al. 1996) and S87E (40 %) (Chen et al. 2003) star forming regions. A strikingly important fact is what happens in the central part of the field (subregion C in Table 2), where the infrared excess objects reach a total of 27 or over 70 % of all the point sources assumed to belong to the cluster. From the analysis of molecular hydrogen and CO emission, Burton (2002) suggested the existence of a molecular outflow from Her 36. This fact, along with the relative large fraction of infrared excess sources and the morphological evidence of jets from some of them (see section 3.8), indicate the cluster population is extremely young. From the comparison with similar star forming regions for which ages have been estimated (see Section 5 in Lada et al. 1996), one could say that this cluster is probably between years, if not younger.
CO line emission toward the Hourglass Nebula was studied by White et al. (1997), who detected an elongated molecular core, 30” 20” in size and orientated SE-NW. The superposition of CO contours on the spatial distribution of sources in the field is shown in Figure 8. The CO emission peaks at Her 36 and 40” to the NW. Note that the first peak is the second most intense CO source observed with a single dish antenna.
As clearly seen in Figure 8, the infrared excess sources do not distribute uniformly in the region. Instead, they extend along the molecular core. While Her 36 and the infrared sources KS 1 to K S4 designated by Woodward et al. (1990) lie close to the most intense peak, another group of candidate YSOs coincides with the secondary peak. Additionally, a number of sources with infrared excess appear grouped to the South of the Hourglass, within the cavity open by the strong wind of Her 36. It is remarkable that almost no source is detected to the NE of Her 36, either with or whitout infrared excess, indicating an extremely high densiy of the molecular cloud.
The infrared excess sources distribution can be quantitatively described using the star counts in Table 2. Three representative ratios between distinct stellar populations have been computed. The ratio of genuine infrared excess sources to candidate late-type objects, ex/”giants”, has a very low value ( 0.15 in average) in 7 of the 9 regions in which the Hourglass field was subdivided (see section 3.3). Nevertheless, it greatly exceeds its average value in the NW region and reaches 1.17 in the central (C) region. These two areas aproximately coincide with the secondary and primary CO emission peaks respectively, confirming that the youngest objects locate along the molecular core.
3.6 Individual stars
Among the most peculiar objects in the field we find the infrared sources designated by Woodward et al. (1990) as KS 1 to KS 4, as well as the ultracompact H ii region G5.97-1.17 studied by Stecklum et al. (1998). What follows is a brief description of the infrared properties of these objects.
a) KS 1 : This source (#312) is 33 north and 03 east of Her 36. Allen (1986) suggested that this star and Her 36 may be part of a Trapezium-like stellar cluster, based on the similar separation distances. KS 1 is actually a binary star with a very red northern component, as pointed out first by Stecklum et al. (1995). The binarity of this object compelled us to perform aperture photometry on it. According to its near-infrared colours (, , ), it is very probably a Herbig Ae/Be object affected by a few magnitudes of visual extinction.
b) KS 2: Located 15 north and 111 east of Her 36, this star is also a binary system. In our PSF photometry we identified two well-separated (angular separation 13) sources: #385 (north) and #382 (south). While source #385 (KS 2-N) is presumably a late B-type dwarf attenuated by 5 mag of visual extinction, the infrared colours of source #382 (KS 2-S) are typical of a classical T Tauri star (, , ).
c) KS 3 and KS 4: These two sources are located 168 east of Her 36, very near the apex of the optical bicone (the “waist”) of the Hourglass. The observed infrared colours of KS 3 (#410) can be replicated either by a relatively hot B9/A0 dwarf affected by 8 mag of visual extinction, or by a cooler T Tauri star (, , ). On the other hand, KS 4 (#414) is much redder than KS 3 and shows significant near-infrared excess emission. Its position on the CC diagram is typical of very young stellar objects such as Class I protostars (, , ).
d) UC H ii region G5.97-1.17: High resolution optical, infrared and radio observations revealed that this object, 27 distant from Her 36, may be a proplyd, i.e., a young star surrounded by a circumstellar disk that is being photoevaporated by the nearby hot star (Stecklum et al. 1998). Because of its close proximity to Her 36, we had to perform aperture photometry on this source (#330). The near-infrared colours obtained indicate that G5.97-1.17 likely belong to the class of Herbig Ae/Be objects (, , ).
3.7 Distribution of dust and gas
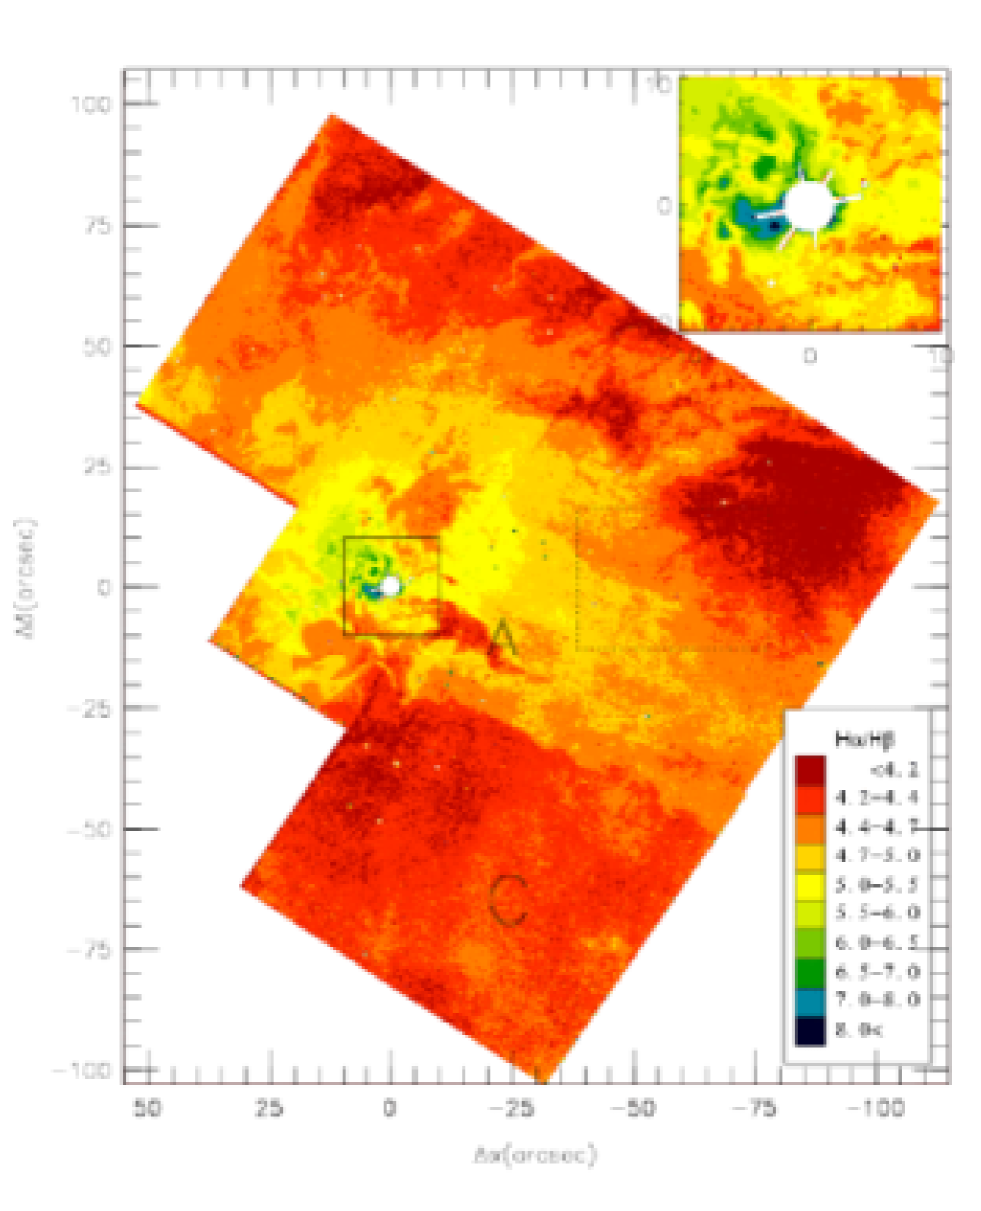
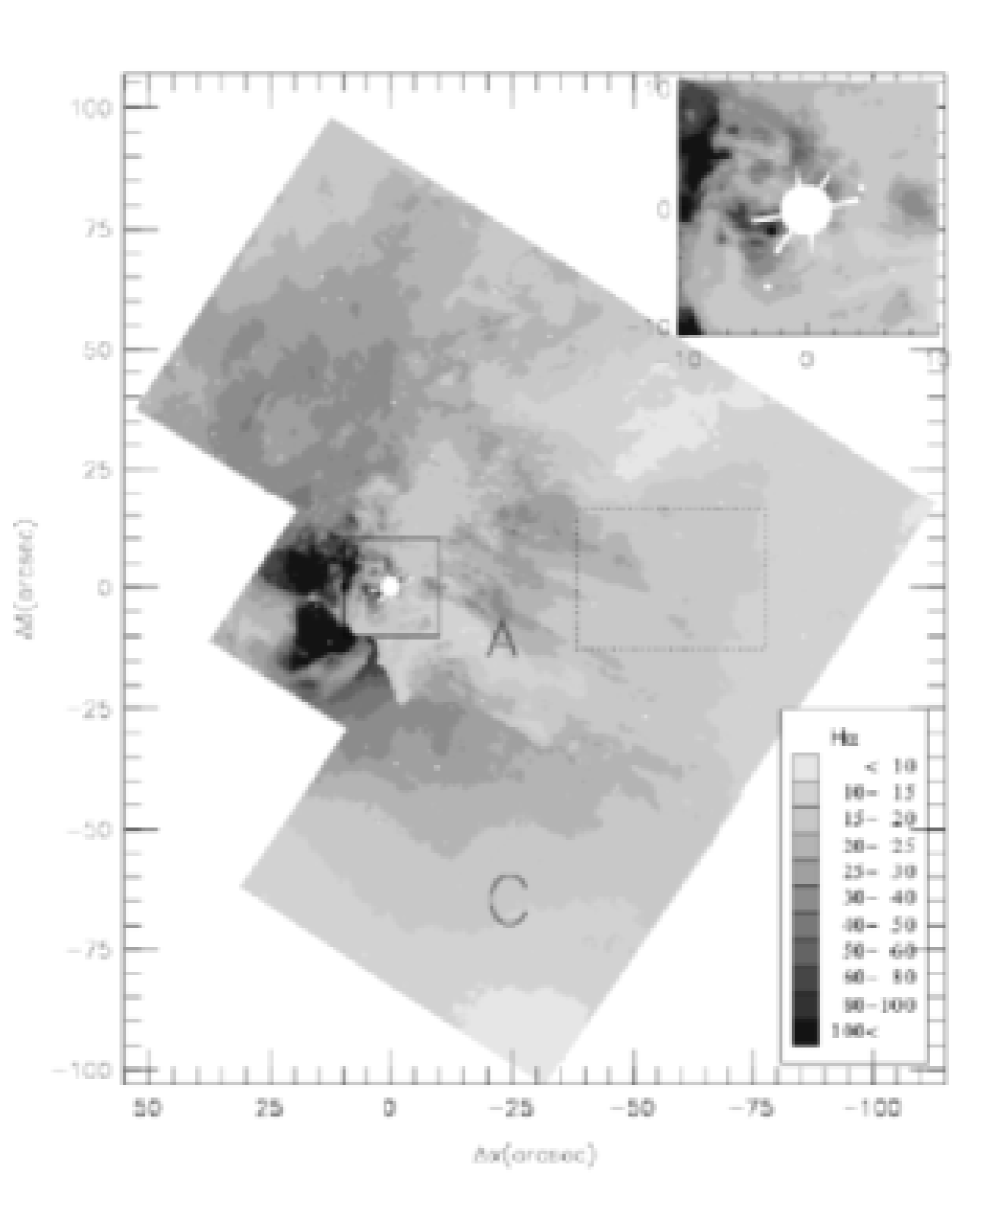
Using images, we have produced the maps of the following line ratios: H/H (Balmer ratio) and ([S ii]6717+[S ii]6731)/H (S2H ratio). Figure 9 shows the Balmer ratio map. The H map has been included in Figure 10 for reference. The Balmer ratio can be used as a tracer of extinction by dust. For temperatures of 104 K and electron densities of 100 cm-3, the theoretical H/H value is 2.86 (Osterbrock 1989). The presence of extinction increase the observed ratio, since it affects H wavelenghts more than H wavelengths. The measured ratio will depend on the geometry of the dust and gas clouds, as well as on the extinction law.
As seen in Figure 9, the Balmer ratio goes clearly above the expected value of 2.86 over the whole region of the Hourglass. In fact, it has a minimum value close to 4.0. We interpret this effect as consequence of the interstellar extinction toward the Hourglass Nebula. A colour excess can be associated to a measured ratio (H)/(H) according to the expression:
,
where is a constant which depends on the reddening law. If we adopt the extinction law parametrized by Cardelli et al. (1989), = 2.307, and then = 0.34 when = 4.0. This is in excellent agreement with the mean value of the reddening derived from the optical colours of the stars in NGC 6530 ( = 0.35; Sung et al. 2000).
The distribution of dust in the central part of the Nebula is quite complex, showing strong variations in a scale of arcseconds, which is clearly appreciable in the enlargement shown at the upper right corner of the panel. The whole central area seems to be highly reddened and the maximum values of are found around Her 36 ( and ). The region immediately to the E of Her 36 shows an interesting spatial correlation between (Fig. 7) and H (Fig. 8): brighter (in H) regions present higher values of , rather than the opposite, which is what would be expected if optically-thin clouds where partially occulting the ionized gas behind. Furthermore, the correlation is also apparent when comparing the spatial distribution of H and the S2H ratio in the sense that low values of the S2H ratio correspond to bright areas. Similar correlations have been detected in NGC 604 (Maíz-Apellániz et al. 2004b) and in 30 Doradus (Walborn et al. 2002, Maíz Apellániz et al. 2005 in preparation) and can be explained if the variations in extinction are caused by optically-thick clouds instead of by optically-thin ones. In such a model, a strong variable foreground screen is present and located between the main part of the H ii region and the observer. In those areas where the screen is thinner, we can see into the bright part of the H ii region but at the cost of measuring large values of (note that values of larger than about 4.0 imply that dust and gas cannot be uniformly mixed but rather that the dust is located in a foreground screen, Maíz-Apellániz et al. 2004b). There, the gas we are seeing is directly exposed to the ionizing radiation of Her 36, located a short distance away, and therefore shows a high excitation, implying low values of the S2H ratio. In those areas where the screen is thicker, dust completely blocks the bright areas of the H ii region and all we can see is the backside (as seen from Her 36) of the cloud, which only receives low-intensity ionizing-radiation (scattered from Her 36 or originating from other ionizing sources at large distances, see Fig. 8 of Maíz-Apellániz 2005), thus producing H ii gas with a low ionization parameter. There, the S2H ratio is much higher, as expected, and is lower because there is little dust between the source and the observer since the cloud is located at larger distances than the source.
Extinction seems to be fairly uniform over the rest of the field. The cavity toward the South open by the winds of Her 36 (marked with a letter C in Figure 9) suffers almost no obscuration, thus showing the lowest values of , i.e., , or equivalently, . A kind of thin flap of dust seems to cover all the region toward the West of Her 36. This fact implies that we are not actually penetrating the molecular cloud but only detecting the front gas H emission, which can explain the relatively low extinction measured ( and ).
By comparing the Balmer ratio and the H emission, we find a number of dark regions with very low H intensity (I(H)) which also show small values of (). An example of such region has been marked with a letter A in Figure 9. Here, a low does not mean low extinction. On the contrary the optical depth is so high that in case of existing gas emission hidden by dust, it can not be detected only with optical data. Such possible emitting regions should be unveiled using near-infrared Br imaging.
To conclude we want to stress that extinctions derived from the Balmer emission lines are only representative of the outer “shell” of the nebula, up to about mag. Optical observations do not probe the gas and dust distribution more deeply into the cloud, and thus estimating ionizing fluxes and other properties only from optical data will lead to uncertain results. Near-infrared imaging are inevitably needed to analyze what processes are really taking place behind the dust.
3.8 Signatures of ongoing star formation in HST images
Archival HST emission-line images in H, [O iii] and [S ii] were searched for proplyds, jets and other features that might be associated with the newly detected candidate YSOs. The HST observations reveal a rich variety of structures related to star formation, similar to those observed in M16 and M42.
Herbig-Haro (HH) objects are shock-excited nebulae powered from YSOs (see Reipurth & Bally 2001). The morphological analysis of [S ii] images is a commonly used technique for surveying star forming regions for the location of excited gas arising from HH flows (e.g. Wang et al. 2003). This is helped by the analysis of [S ii]/H ratio maps in which regions with high values indicative of shock-excited gas are searched.
Figures 11 and 12 show the HST [S ii] continuum-subtracted emission map and the corresponding [S ii]/H (S2H) ratio map of the Hourglass Nebula, respectively. The strongest line emission arises from the inner part of the Hourglass and is mainly concentrated on the east wall of the cavity. Both, the [S ii] and the H emissions, have a clumpy structure close to Her 36. When compared to H emission, the [S ii] emission shows a more complex and filamentary pattern to the north and west of the nebula. On the other hand, both images look smoothed in the southern part of the nebula, where the H ii cavity is an opened blister. These differences in the emission appears as large fluctuations in the S2H map, in a scale of few tenths of arcsecond, especially close to Her 36 and to the west part of the image.
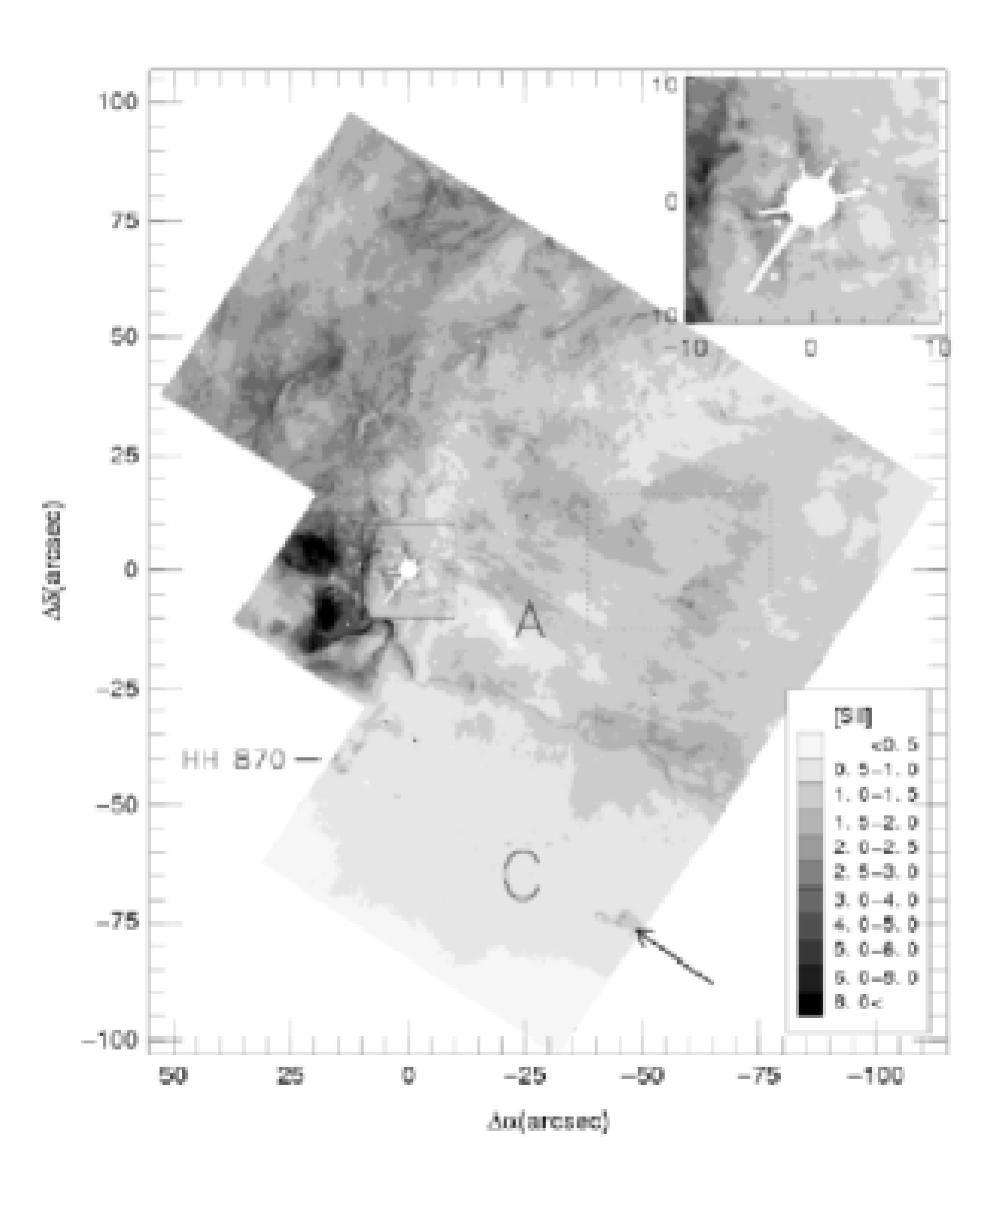
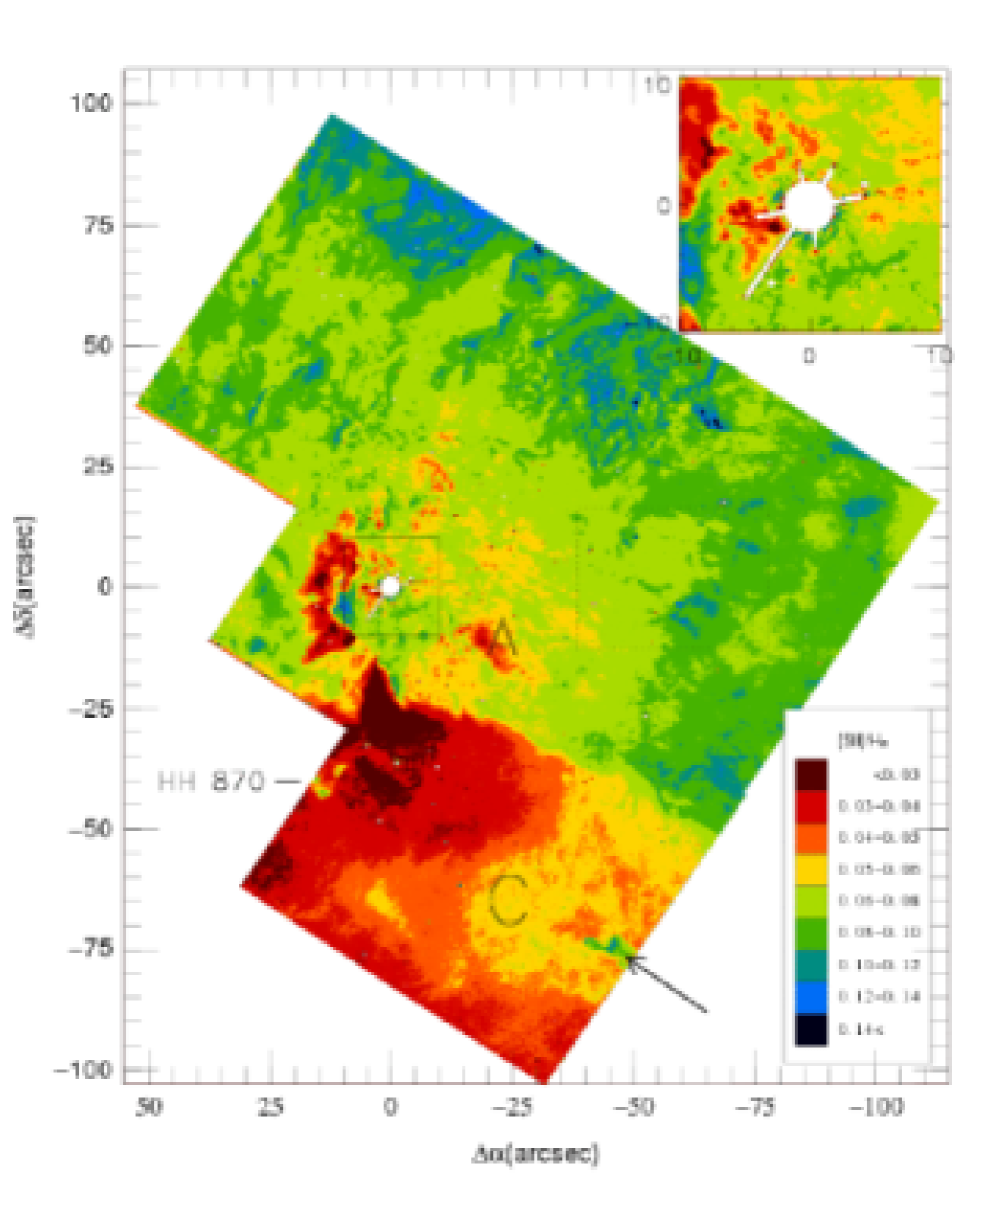
It is very interesting to note that the S2H flux ratio goes below 0.10 over almost the whole region of the Hourglass, as expected for a photoionized plasma. We are particularly interested in detecting emission features produced in shock-excited gas, for which the expected S2H flux ratio values are typically of 0.3–0.5. Nevertheless, the highest S2H flux ratio hardly reaches 0.2 (over an arc located at 75” to the NW of Her 36). This could be explained by considering normal photoionized gas filling the volume in front of the nebula. This gas shows a S2H flux ratio close to 0.05, and then reduces the contrast between the shock-excited features with higher values and the molecular cloud. As mentioned in Section 3.7, the dust associated with this foreground material could be responsible for most of the foreground extinction in the nebula.
Perhaps the most stricking features in the [S ii] and S2H images are three nebular knots located 40” to the SE of Her 36 that appear to form one large structured bow shock for which the HH number HH 870 has been assigned in the HH catalogue222HH catalogue numbers are assigned by B. Reipurth in order to correspond with the list of Herbig-Haro objects that he maintains.. Equatorial positions for this and the other new HH objects discovered in the Hourglass region are shown in Table 3. The morphological appearance of HH 870 is pretty similar to the HH 203 and HH 204 objects in the Orion Nebula (O’Dell et al. 1997). Its three flow components have been labelled as A, B and C in Figure 13. The right-hand panel of this figure shows a long-slit spectrum in the [N ii] 6584 Å emission line obtained across the Hourglass Nebula with NTT. The placement of the long-slit aperture has been plotted on the [S ii] WFPC2 mosaic in the left-hand panel of the same figure. Two noticeable kinematic structures (labeled as ”1” and ”2”) are clearly observed. These velocity components are associated with nebular structures located at 25” (0.15 pc) and 37” (0.22 pc) from the middle point of the slit. Their receding velocities respect to the H ii region reach 80 km s-1 for feature “1” and 45 km s-1 for feature “2”. Feature ”1” seems to origin in the gas located inmediately to the south of a dusty finger-like structure whose head points directly to Her 36. Feature ”2” is clearly associated with the flow component A of HH 870. It must be taken in mind that the long-slit images were originally obtained with other scientific purposes, and so the position on the sky was chosen. It was a fortunate coincidence that the slit aperture crossed the western bow shock feature, but it is presumably not aligned along the jet axis. This could explain the undetection of the northern counterjet, although it also might be due to the fact that the driven source is buried in the molecular cloud core. Both infrared sources #414 (KS 4) and #410 (KS 3) are located along the simmetry axis of the main bow shock component B of HH 870. As was remarked in Section 3.6, KS 4 is probably a Class I protostar and therefore a good candidate to be the driving source of this structure.
| Object | (J2000.0) | (J2000.0) | Comments |
|---|---|---|---|
| HH 867 | 18:03:36.77 | -24:22:33.0 | ring, strong in [S ii] |
| HH 868 | 18:03:36.00 | -24:22:49.0 | Three emission arcs, 6” in size |
| HH 869 | 18:03:35.69 | -24:22:30.3 | Strong [S ii] knot |
| HH 870 | 18:03:41.44 | -24:23:25.0 | Three strong emission knots, 10” in size |
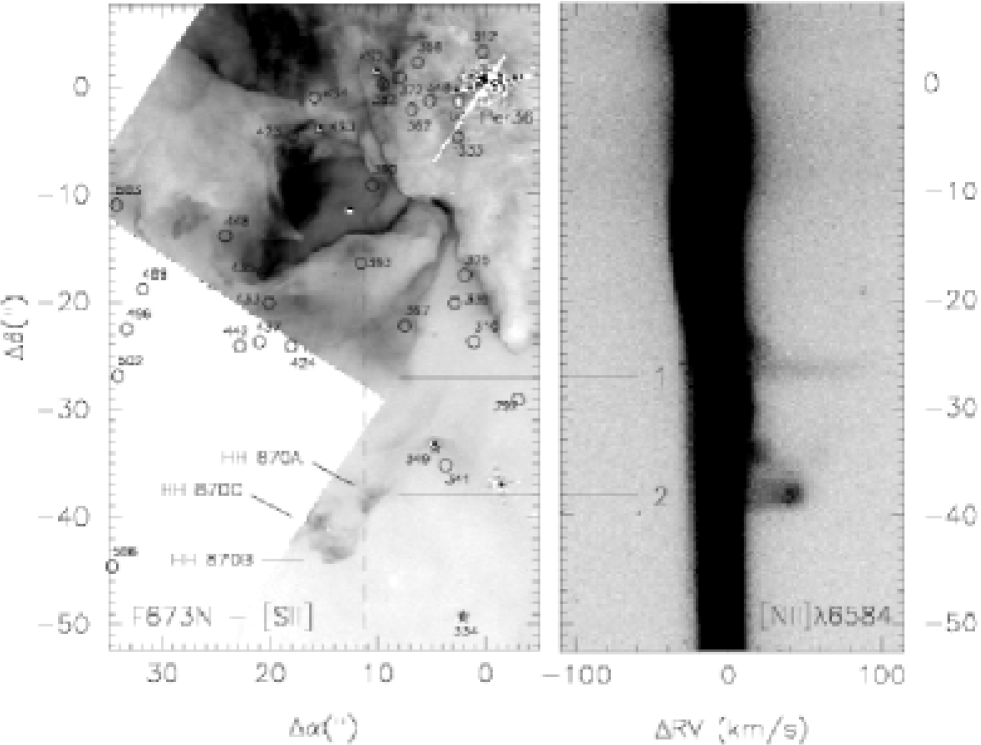
One-sided outflows are commonly observed emerging from dense cores in the photoionized medium (cf. HH 616 and HH 617 in S140, Bally et al. 2002; HH 777 in IC 1396N, Reipurth et al. 2003). Additional evidence in favour that kinematic feature “2” (spatially associated with the feature HH 870 A) is a bona fide bow shock is found in the very high [N ii]/H (N2H) ratio derived from the long-slit spectra. Figure 14 shows the superposition of the H and [N ii] 6584 Å (scaled by 2) profiles along the position of feature ”2”. The N2H ratio value is about 0.15 for the main emission component, but increases to about 0.7 for the radial velocity component at +45 km s-1 , reinforcing the idea that this feature is in fact shock-excited.

About 50” (0.3 pc) to the West of Her 36, we find another set of nebular structures which are also identified as new HH objects. Figure 15 shows a portion of the WFPC2 H and [S ii] mosaics and the S2H ratio map, where these interesting features have been labelled as HH 867, HH 868 and HH 869 according to the numbers assigned in the HH catalogue.
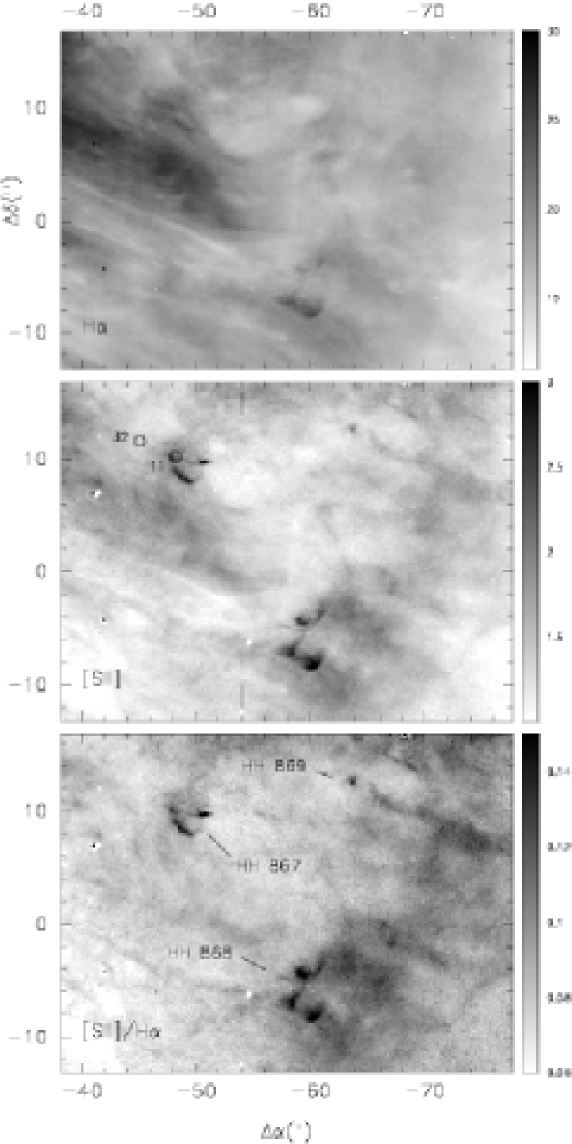
The object HH 867 is a very intriguing elliptical ring, approximately in size ( AU). The ring is uncomplete and presents strong emission in [S ii] and much weaker emission in H, leading to a S2H ratio of about 0.11. A jet-like feature seems to cross axially the center of the ring with a certain inclination angle respect to the ring plane. This candidate jet shows two main condensations with high S2H ratio: the first one (S2H0.18) is placed toward the west of the ring, whereas the other (S2H0.11) locates on its eastern border. Furthermore, the jet seems to extend beyond the west end of the ring in a diffuse path of about 28” (0.17 pc), which can be mainly seen in the S2H ratio map. Near the apparent jet axis, there are two infrared excess sources, #32 (, , ) and #11 (, ,), which seem to be connected by a thin H filament. Source #449 coincides with the eastern jet condensation. Since both of these sources are candidates to be embedded YSOs, any of them might be the driving source of the jet feature.
HH 868, located about 20” to the SE of HH 867, is an ever larger structure (6” in size = 7500 AU) composed by three nebular emission arcs. These bow shock features show high S2H ratio values () and they are undetectable in the H/H map, which means that the extinction has foreground origin. The northern arc shows a bright [S ii] condensation inside the bow show, suggesting a reverse shock (”Mach disk”), indicative of the action of a faster jet overtaking cooled gas behind the preceding bow shock. Note that it seems very likely based on the morphology of the flow components that HH 867 and HH 868 form independent bow shocks in a single large flow coming from the upper left of the image.
A third HH object is found in Fig. 15. HH 869 is a bright [S ii] condensation located 15” (19000 AU) to the west of the HH 867, almost perpendicularly to the previously mentioned ring plane. This condensation is not appreciable in H emission, showing a S2H ratio value of . Our infrared survey does not reach this peculiar emission feature and the 2MASS catalog does not show any infrared source close to this location. A diffuse filament seems to develop from HH 869, grow in the southwest direction and intersect the filament coming from HH 867. Bally et al. (2002) describe the breakout in an ionized medium of a jet arised inside the molecular cloud. They found that the wall of the molecular cloud shows arcs with enhanced [S ii] emission where the jet appears. In this way, we should also take in mind the hypothesis that the ring of HH 867 represents the point in the molecular cloud where a jet arised in (or around) Her 36 emerges, since the normal direction to the ring points directly to that star. Furthermore, the HH 869 feature is placed along the line joining the ring and Her 36.
Chakraborty & Anandarao (1997, 1999) performed Fabry-Perot observations of the Hourglass region in the [N ii] 6583Å and [O iii] 5007Å emission lines. They found high expansion velocities up to 50 km s-1, which they interpreted as indicative of Champagne flows. Unfortunately, the area observed by these authors does not reach the location of the outflow HH 870. Nevertheless a careful inspection of their plots suggests the possibility that some of the high velocity features observed in their spectral line profiles may represent the contribution of collimated outflows to the general turbulent motion. For example, among the line profiles shown in Figure 2 of Chakraborty & Anandarao (1997), there is a high velocity component of -50 km s-1, which appears very prominent at P.A. 190∘, 20” from Her 36 (Fig. 2h) but it is not observed at P.A. 175∘, 12” from this star (Fig. 2f). This kind of small-scale variations in the structure of the velocity field may be indicating the existence of collimated outflows.
Located 30” (0.18 pc) to the NW of Her 36, source #156 (SCB 1040) is a remarkable object which has already been suggested as pre-main sequence candidate from its optical colours in HST data by Sung et al. (2000). Its H image shows extended emission ( in size) and reveals a chain of nebular emission features extending 10” to the south, which clearly resembles the one-sided jets detected in the Orion Nebula (Bally et al. 2000).
About (9400 AU) to the South of source #156 is source #144, which shows an intense and very elongated H emission. This star has infrared colours similar to T Tauri stars (, ). Additionally, its magnitude of 10.14 corresponds to the same brightness as T Tauri itself (, and , according to 2MASS Second Incremental Data Release, Cutri et al. 2000), if moved from its location in the Taurus T association (140 pc) to the distance of M8 (1300 pc).
A rich clustering of faint infrared sources (#369, 374, 497, 320, 370) is found 35” (0.2 pc) to the North of Her 36, close to bright filaments facing 9 Sgr. These filaments are part of the PDR of the molecular core detected in CO (see Figure 8).
The central part of the Hourglass Nebula shows an incredible complex structure which will be better described in a subsequent paper. We remark here a large dust pillar orientated to Her 36 in the SE-NW direction, which is observed as an extinction feature against the nebular background. Its very bright rimmed head indicates that it is presumably illuminated on its far side, and so is somewhat in front of Her 36. The projected distance between the head of the pillar and the star is 11” (0.07 pc). Our -band image reveals a bright stellar infrared source (#347) located in the tip of this finger, resembling those found in the dense knots of 30 Doradus by Walborn et al. (1999). Source #347 has no optical counterpart and its near-infrared colours are typical of a highly reddened early-type star (, ).
In the southern region of the field, the WFPC2 images reveal another interesting dust structure, which might probably be an externally-ionized molecular globule similar to that found in the core of the Carina Nebula by Smith et al. (2004). This molecular globule, located to the SW of the Hourglass, has also a shape resembling a human finger that points toward its likely source of ionizing photons. Curiously, the finger does not point to Her 36 but to the O4 V((f))-type star 9 Sgr. While the finger is seen only as a silhouette against a brighter background in H, its surface is very bright in [S ii], which is especially clear from the S2H ratio map in Figure 12. Although most of this structure is out of the FOV of our infrared images, a very bright infrared stellar source is noticeable in the summit of the pillar. 2MASS archive data reveal the presence of a highly reddened object at this location (, , ).
Finally we have identified two large bow shocks surrounding young stars whose near-infrared colours are typical of reddened T Tauri stars (sources #349, , , and #334, , ; see Fig. 13). These objects are marked with stars in Figure 13. It is interesting to note that, while source #334 is a single star in HST images, it is observed as a double star with components separated by 05 in our infrared images. The eastern component is not detected in the optical images, but it is brighter than its companion in the infrared. This object seems to be a resolved binary with components affected by a different degree of extinction.
The bow shocks detected in sources #349 and #334 are seen as arcs consisting in bright H emission and facing Her 36. In both cases, they are concave toward the corresponding infrared source and convex toward Her 36. The bow shock around star #349 is brighter than the one around star #334. Their morphologies resemble strongly the hyperbolic bow shock around the T Tauri star LL Ori (Bally et al. 2000, Bally & Reipurth 2001). Thus, these bow shocks are candidates to be wind-wind collition fronts.
In summary, the morphological analysis of the HST images of the Hourglass region reveals that the nebula has a complex structure, showing dozens of features that closely resemble those observed in other star forming regions (for example, M42, M16, NGC 3372). However, almost nothing is known yet about the proper motion and radial velocity of these objects, so it is premature to draw any conclusions about these objects here. In a forthcoming paper, we will discuss optical spectroscopy recently obtained using the Boller and Chivens Spectrograph on the 6.5 m Magellan I telescope at Las Campanas Observatory, which will undoubtedly contribute to unveil their true nature.
4 Summary and Conclusions
We have obtained near-infrared images of the Hourglass Nebula in M8. These data were complemented with HST images and longslit spectroscopy retrieved from on-line databases. The main results can be summarized as follows:
We used the recently developed numerical code CHORIZOS to obtain a new estimate for the distance to the Hourglass region. Using optical and infrared photometry from this work and from literature for a group of early-type stars around Herschel 36 (including this star), we derived a distance modulus of 10.5 (1.25 kpc). This value is sensibly smaller than the 11.25 previously accepted for the region, but it is in excellent agreement with the last determination for NGC 6530 by Prisinzano et al. (2005).
Our infrared images confirm the existence of a very young stellar cluster around the massive O-type star Herschel 36. We have detected almost 100 sources with colours indicative of intrinsic infrared excess emission, which appear as prime candidates to be T Tauri and Herbig Ae/Be stars. These objects are not uniformly distributed in the region, but they extend along the molecular core, mostly concetrated near the two most intense peaks of the CO distribution (White et al. 1997). The large fraction of infrared excess sources (over 70 % in the central part of the field) along with the evidence of outflow activity from Her 36 (Burton 2002), suggest the stellar population within the cluster must be extremely young ( years).
By comparing the photometric diagrams of the Hourglass and a 2MASS control field, we have found that a significant fraction of the stars observed toward M8 may be red giants belonging to the galactic inner disk and Bulge. Based on the method described by Lada et al. (1994), we have used the positions and near-infrared colour excess estimates of over 400 background field giants to directly measure the extinction through the molecular cloud, finding a strong correlation with the distribution of molecular material.
Archival HST emission-line images reveal a variety of ongoing star formation features in the core of M8. Several of the candidate YSOs detected here seem to be associated to structures similar to those observed in other star forming regions like M16 and M42, namely, proplyds, jets, dense knots, molecular globules and bow shocks. Furthermore, four Herbig-Haro objects have been detected for the first time in the region (HH 867, HH 868, HH 869 and HH 870). A longslit spectrum in the [N ii] 6584 Å emission line obtained across the Hourglass Nebula with NTT and retrieved from the ESO Archive Facility confirmed the identification of HH 870, providing the first direct evidence of active star formation by accretion in M8. In order to understand better the nature of some of the rest of the objects we have obtained optical spectroscopy with the 6.5 m Magellan Telescope, which will be analyzed in a future paper.
acknowledgements
This publication makes use of data products from the Two Micron All Sky Survey, which is a joint project of the University of Massachusetts and the Infrared Processing and Analysis Center/California Institute of Technology, funded by the National Aeronautics and Space Administration and the National Science Foundation. This research has made use of Aladin and the Simbad Database, operated at CDS, Strasbourg, France.
Financial support from “Fondo de Publicaciones de la Dirección de Investigación de la Universidad de La Serena (Chile)” and from the Center for Astrophysics (FONDAP No. 1501003, Chile) are acknowledged by RHB and MR, respectively. JIA thanks the Departamento de Física of Universidad de La Serena for the use of their facilities and the warmest hospitality. Also, the authors gratefully thank the staff at LCO for kind hospitality during the observing run.
References
- (1) Allen, D.A. 1986, MNRAS, 219, 35
- (2) Arias, J.I., Morrell, N.I., & Barbá, R.H. 2005, in preparation
- (3) Bally, J., O’Dell, C.R., & McCaughrean, M.J. 2000, AJ, 119, 2919
- (4) Bally, J., & Reipurth, B. 2001, ApJ, 546, 299
- (5) Bally, J., Reipurth, B., Walawender, J., & Armond, T. 2002, AJ, 124, 2152
- (6) Bica, E., Dutra, C.M., Soares, J., & Barbuy, B. 2003, A&A, 404, 223
- (7) Burton, M.G. 2002, PASA, 19, 260
- (8) Cardelli, J.A., Clayton, G.C., & Mathis, J.S. 1989, ApJ, 345, 245
- (9) Chakraborty, A., & Anandarao, B.G. 1997, AJ, 114, 1576
- (10) Chakraborty, A., & Anandarao, B.G. 1999, A&A, 346, 947
- (11) Cutri, R.M., et al. 2000, Explanatory Supplement to the 2MASS Second Incremental Data Release (Pasadena: IPAC)
- (12) Jones, T.J., & Hyland, A.R. 1980, MNRAS, 192, 359
- (13) Kilambi, G.C. 1977, MNRAS, 178, 423
- (14) Koornneef 1983, A&A, 128, 84
- (15) Kurucz, R.L. 2004, http://kurucz.harvard.edu
- (16) Lada, C.J., Lada, E.A., Clemens, D.P., & Bally, J. 1994, ApJ, 429, 694
- (17) Lada, C.J., Alves, J., & Lada, E.A., J. 1996, AJ, 111, 1964
- (18) Lanz, T., & Hubeny, I. 2003, ApJS, 146, 417
- (19) Maíz-Apellániz, J. 2004, PASP, 116, 859
- (20) Maíz-Apellániz, J., Walborn, N.R., Galué, H.A., Wei, L.H. 2004a, ApJS, 151, 103
- (21) Maíz-Apellániz, J., Pérez, E., Mas-Hesse, J.M. 2004b, AJ, 128, 1196
- (22) Maíz-Apellániz, J. 2005, to appear in the in the proceedings of the 2003 May STScI Symposium, ”The Local Group as an Astrophysical Laboratory”
- (23) Mathis, J.S., 1990, ARA&A, 28, 37
- (24) Martin, P.G., & Whittet, D.C.B. 1990, ApJ, 357, 113
- (25) Mason B.D., Gies, D.R., Hartkopf, W.I., Bagnuolo, W.G., Jr., Brummelaar, T.T., McAlister, H.A. 1998, AJ, 115, 821
- (26) McCall, M.L., Richer, M.G., & Visvanathan, N. 1990, ApJ, 357, 502
- (27) Meyer, M.R., Calvet, N., & Hillenbrand, L.A. 1997, AJ, 114, 288
- (28) O’Dell, C.R., Hartigan, P., Lane, W.M., Wong, S.K., Burton, M.G., Raymond, J. & Axon, D.J. 1997, AJ, 114, 730
- (29) O’Dell, C.R., & Doi, T. 1999, PASP, 111, 1316
- (30) Osterbrock, D.E. 1989, Astrophysics of Gaseous Nebulae and Active Galactic Nuclei, University Science Books
- (31) Prisinzano, L., Damiani, F., Micela, G., & Sciortino, S. 2005, A&A, 430, 941
- (32) Rauw, G., Nazé, Y., Gosset, E., Stevens, I.R., Blomme, R., Corcoran, M.F., Pittard, J.M., & Runacres, M.C. 2002, A&A, 395, 499
- (33) Reipurth, B., Armond, T., Raga, A., & Bally, J. 2003, ApJ, 593, L47
- (34) Reipurth, B. & Bally, 2001, ARA&A, 39, 403
- (35) Rieke, G.H., & Lebofsky, M.J. 1985, ApJ, 288, 618
- (36) Sagar, R., & Joshi, U.C. 1978, MNRAS, 184, 467
- (37) Schmidt-Kaler, Th. 1982, “Landolt-Bornstein, NS”, 2, 455
- (38) Smith, N., Barbá, R.H., & Walborn, N.R. 2004, MNRAS, 351, 1457
- (39) Stecklum, B., Henning, T., Eckart, A., Howell, R.R., &Hoare, M.G. 1995, ApJ, 445, 153
- (40) Stecklum, B., Henning, T., Feldt, M., Hayward, T.L., Hoare, M.G., Hofner, P., & Richter, S. 1998, AJ, 115, 767
- (41) Sung, H., Chun, M., & Bessell, M. 2000, AJ, 120, 333
- (42) van den Ancker, M.E., Thé, P.S., Feinstein, A., Vázquez, R.A., de Winter, D., & Pérez, M.R. 1997, AAS, 123, 63
- (43) van Altena, W.F., & Jones, B.F. 1972, A&A, 20, 425
- (44) Vacca, W.D., Garmany, C.D., & Shull, J.M. 1996, ApJ, 460, 914
- (45) Walborn, N.R., Barbá, R.H., Brandner, W., Rubio, M., Grebel, E.K., Probst, R.G. 1999, AJ, 117, 225
- (46) Walborn, N.R. 1972, AJ, 77, 312
- (47) Walborn, N.R. 1973, AJ, 78, 1067
- (48) Walborn, N.R., Maíz-Apellániz, J., & Barbá, R.H. 2002, AJ, 124, 1601
- (49) Walker, M.F. 1957, ApJ, 125, 636
- (50) Wang, H., Yang, J., Wang, M. & Yan, J. 2003, AJ, 125, 842
- (51) Whittet, D.C.B., Martin, P.G., Fitzpatrick, E.L., & Massa, D. 1993, ApJ, 408, 573
- (52) White, G.J., Tothill, N.F.H., Matthews, H.E., McCutcheon, W.H., Huldtgren, M., & McCaughrean, M.J. 1997, A&A, 323, 529
- (53) Woodward, C.E., Pipher, J.L., Helfer, H.L., & Forrest, W.J. 1990, ApJ, 365, 252
- (54) Zombeck, M.V. 1990, Handbook of Space Astronomy and Astrophysics, Second Edition (Cambridge, UK: Cambridge University Press)