Detection of a massive dust shell around the Type II supernova SN 2002hh
Abstract
Dust emission from the Type II supernova SN 2002hh in NGC 6946 has been detected at mid-infrared wavelengths by the Spitzer Space Telescope from 590 to 758 days after outburst and confirmed by higher angular resolution Gemini-N mid-IR observations. The day-600 -m emission can be fit by a 290-K blackbody having a luminosity of 1.6 L⊙. The minimum emitting radius of 1.1 cm is too large for the emitting dust to have been formed in the supernova ejecta. Using radiative transfer models and realistic dust grain parameters, fits to the observed flux distribution could be obtained with an optically thick dust shell having a mass of 0.10-0.15 M⊙, corresponding to a total dust+gas mass in excess of 10 M⊙, suggesting a massive M supergiant or luminous blue variable precursor to this self-obscured object.
1 Introduction
During their giant phase of evolution, low and intermediate mass stars are known to be important contributors to the interstellar dust budget. However, massive stars, in particular their supernovae (SNe), could make the dominant contribution to the dust budget of galaxies (Clayton 1979; Dwek & Scalo 1980; Todini & Ferrara 2001). Evidence for dust formation by at least some SNe comes from precise isotopic abundance ratio studies of grain inclusions found in meteorites (e.g. Clayton, Amari & Zinner 1997; Travaglio et al. 1999). A determination of the dust contribution from core-collapse SNe (Types II, Ib and Ic) could have widespread consequences, in particular for our understanding of the origin and evolution of galaxies in the early universe. Many of the earliest-formed galaxies are extremely dusty, as evidenced by the detection of their highly-redshifted infrared (IR) emission at submillimeter wavelengths (e.g. Ivison et al. 2000). Massive stars in the starbursts that power these young galaxies are the most plausible sources of this dust.
Model studies have shown that the mid-IR spectral region (5-30 m) is particularly suitable to trace the onset of dust formation in SN ejecta and to determine the amount of dust formed (e.g. Dwek 1988; Kozasa, Hasegawa & Nomoto 1989; Todini & Ferrara 2001; Clayton, Deneault & Meyer 2001). These dust formation models predict that emission from ejecta condensates should become detectable at mid-IR wavelengths within 1-2 years of outburst. SN 1987A, in the Large Magellanic Cloud, was estimated to have formed a modest amount of dust in its ejecta (Dwek et al. 1992; Wooden et al. 1993), with the dust believed to have first condensed about 530 days after outburst (Danziger et al. 1991). In contrast, the level of submm emission from the 300-year old SN remnant Cas A has been interpreted as indicating the presence of at least two solar masses of cold dust within the remnant (Dunne et al. 2003). However, amongst the grounds given by Dwek (2004) for disputing this dust mass estimate was that it would exceed the mass of refractory elements in the ejecta of the likely progenitor star, while Krause et al. (2004) argued that the submm emission detected towards Cas A could originate from a foreground molecular cloud complex, leaving still uncertain the observational case for SNe as major dust contributors to galaxies. Here we report the detection by our SEEDS collaboration (Survey for Evolution of Emission from Dust in Supernovae) of thermal dust emission from the Type II SN 2002hh some 600 days after its discovery, based on mid-infrared observations made by the Spitzer Space Telescope (SST), together with follow-up mid-IR observations obtained with the 8-m Gemini-North telescope.
2 Observations
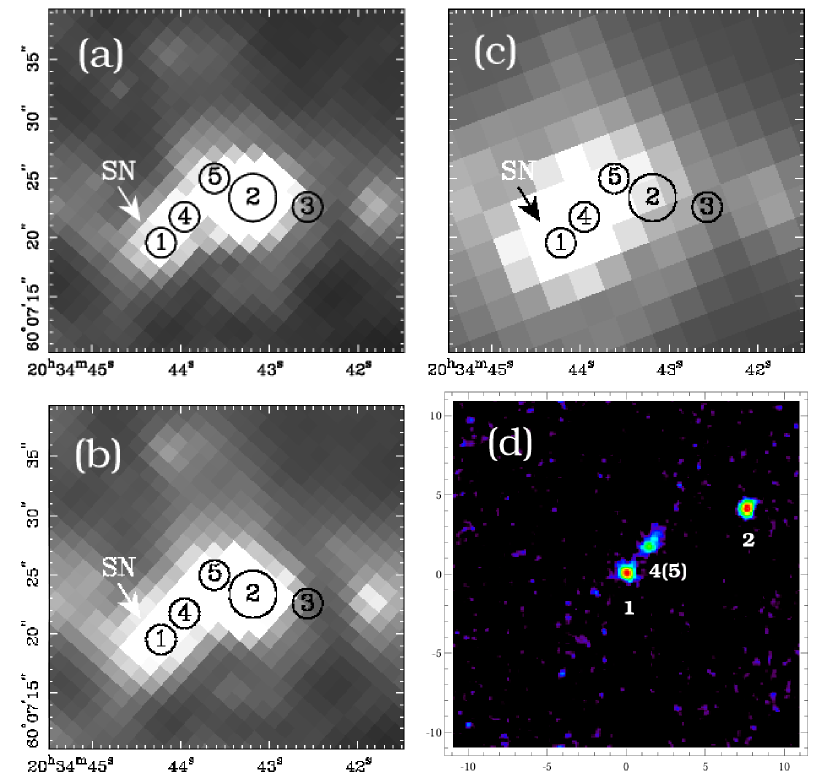
The Type II supernova SN 2002hh is located in the spiral galaxy NGC 6946, at a distance of 5.90.4 Mpc (Karachentsev, Sharina & Huchtmeier 2000). NGC 6946 was observed by the SINGS Legacy program (Kennicutt et al. 2003) with the SST’s InfraRed Array Camera (IRAC) at 3.6, 4.5, 5.8 and 8.0 m, on June 10th 2004 and again on November 25th 2004, 590 days and 758 days, respectively, after the October 27th 2002 discovery of SN 2002hh (Li 2002). Both IRAC observation sequences took 35 minutes, yielding the effective exposure times per pixel that are listed in Table 1. The galaxy was also observed at 24, 70 and 160 m, for 55.2 minutes on both July 9th and 11th 2004, with the Multiband Imaging Photometer for Spitzer (MIPS). Pipeline-calibrated images of NGC 6946 were obtained from the SST public archive. Figs. 1(a) and (b) show IRAC 5.8-m and 8.0-m images of a 30′′ by 29′′ region around SN 2002hh, obtained with a pixel size of 11, from the June 10th 2004 SINGS observation of NGC 6946. They clearly show the SN (marked as Star 1) and a bright adjacent field star (Star 2). Using crowded-field PSF subtraction, we removed these two sources, revealing three additional sources, which we named Stars 3, 4 and 5. These sources were identified in all four IRAC bands, with the fluxes listed in Table 1. The error estimates listed there include allowances for flat-field errors, profile errors in fitting the PSF, readnoise and poisson noise. Astrometry for Stars 1-5 from these IRAC images was reported by Barlow et al. (2004). The J2000 coordinates measured for SN 2002hh are R.A. = 20.23, Decl. = +60 ( in each coordinate). These agree well with the J2000 radio position of SN 2002hh measured by Stockdale et al. (2002), R.A. = 20.25, Decl. = +60 ( in each coordinate).
From its 2MASS and IRAC colours, Star 2 (= 2MASS 20344320+6007234) is likely to be a foreground cool giant in the Milky Way. Stars 4 and 5 were suspected to be a single extended source, possibly an H ii region; for a distance of 6 Mpc to NGC 6946, Star 4 has a projected separation of 90 pc from SN 2002hh. Fig. 1(c) shows the MIPS 24-m image of the same region, obtained with a pixel size of . The supernova (Star 1) and Stars 4-5 are clearly detected at 24 m, with the fluxes listed in Table 1. The IRAC and MIPS fluxes listed in Table 1 have not been corrected to take account of intrinsic source colours; such corrections are estimated to be small. The listed flux uncertainties correspond to the photometric statistical errors; the absolute calibration uncertainties for IRAC and MIPS are estimated to be 5-6%. It is noteworthy that the 8-m flux from from the supernova (Star 1) showed a 25% drop between the IRAC observations of June and November 2004.
The supernova is only marginally resolved from its neighbouring sources in the IRAC and MIPS images, due to the relatively low angular resolution of the 85-cm SST ( at 8 m). To address the issue of source confusion, we used the Michelle mid-IR imager/spectrometer on the 8-m Gemini-North telescope to obtain an 11.2-m image of 2002hh on September 26th 2004, with an on-source observation time of 900 s. Fig. 1(d) shows the region around SN 2002hh in the Michelle image. With times the spatial resolution of the IRAC observations, the Michelle image completely resolves SN 2002hh from its neighbors and confirms that mid-IR emission originates from the location of the supernova. Both the SN and Star 2 are easily detected in this image, while Star 4/5 is confirmed to be an extended source, which peaks in brightness to the south-east.
3 The IR spectral energy distribution and the mass of emitting dust
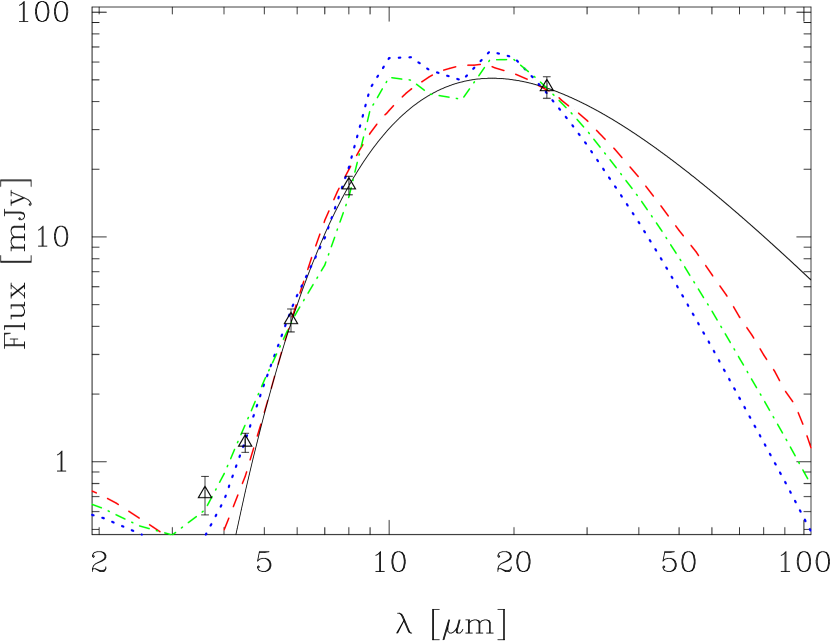
The observed June/July 2004 MIPS/IRAC spectral energy distribution of SN 2002hh is shown in Fig. 2. The longer wavelength SST data can be fitted by a 290 K blackbody, which for a distance of 6 Mpc corresponds to a luminosity of 1.6 L⊙ and an emitting radius of 1.1 cm. More realistic dust particles have emissivities in the IR, with typically between 1–2. For an = 1 emissivity law, a fit to the June/July 2004 8- and 24-m fluxes gives a grain temperature of 225 K and a characteristic emitting radius of 5 cm, too large for the emitting dust to have been formed in the main SN ejecta, since material traveling at a bulk velocity of 6000 km s-1 would take 26 years to reach this radius. Light from the supernova would take 6 months to reach this radius; the light crossing time of one year for a shell of the same radius appears consistent with the observed flux decrease at 8-m of 25% in 5.5 months (Table 1). We infer that the observed IR emission from SN 2002hh is from pre-existing circumstellar (CS) dust ejected by the supernova progenitor star. From day-20 near-IR spectra, an extinction of AV = 6.1 mags has been measured towards the SN by Meikle et al. (2002) of which 1.1 mags were estimated by them to be due to foreground dust in the Milky Way. At SN 2002hh’s angular separation of 129′′ from the nucleus, an internal extinction of A magnitudes to the midplane of NGC 6946 is predicted (Holwerda et al. 2005). Thus a large fraction of the 5 magnitudes of extinction within NGC 6946 towards SN 2002hh appears to be due to CS dust, which may have condensed within a stellar wind from an earlier M supergiant or Luminous Blue Variable (LBV) phase of evolution of the progenitor star.
We have constructed a number of dust shell models that match the observed June/July 2004 IR flux distribution from SN 2002hh. Fits were obtained for total dust masses of 0.10-0.15 M⊙, with visual optical depths, , in the range 3–4, illuminated by central sources with luminosities of (2.0–2.3) L⊙ and effective temperatures in the range 5000–7500 K. The dashed line in Fig. 2 corresponds to an amorphous carbon model for a dust shell with an r-2 density distribution, an inner shell radius = 4.0 cm, a ratio, Y, of outer to inner shell radii of 3.0, a radial optical depth (= A) of 4.0 and a total dust mass of 0.10 M⊙. The grains had a Mathis, Rumpl & Nordsieck (1977; MRN) size distribution, with minimum and maximum grain radii of m and m. The model was calculated using dusty-MOCASSIN (Ercolano, Barlow & Storey 2005), a 3-D Monte Carlo radiative transfer code, with the amorphous carbon optical constants taken from Hanner (1988). The central source used for the model had a luminosity of L⊙ and an effective temperature = 7500 K.The dotted line in Fig. 2 shows an r-2 density distribution dust shell model calculated using the 2-D radiative transfer code 2-Dust (Ueta & Meixner 2003) for a dust shell containing 25% amorphous carbon and 75% amorphous silicate grains by mass, with MRN size distributions and m and m. The amorphous carbon and amorphous silicate optical constants were taken from Zubko et al. (1996) and Draine & Lee (1984), respectively. The dust shell had = 3, a mass of 0.15 M⊙, Rin = 2.1 cm and Y = 1.5 and was powered by a central source with L⊙ and = 7000 K. The best-fitting model (dash-dotted line in Fig. 2; also calculated with 2-Dust) was an amorphous carbon and silicate model having the same central source luminosity and optical depth as above, but with a dust mass of 0.10 M⊙, = 1.0 cm, Y = 100 and an embedded constant density shell or “superwind” located between and 10, followed by a smooth transition to an r-2 density distribution having 1/25th of the density of the constant density shell at the 10 transition point.
For the best-fitting model (dash-dot line in Fig. 2), the adopted 25:75 ratio by mass for the carbon and silicate dust components is similar to that found necessary to match the light echoes observed from the CS dust closest to SN 1987A (Sugerman et al. 2005). Spectral features attributable to both O-rich and C-rich dust species have been found in the IR spectra of the CS dust shells around the candidate Galactic LBVs AFGL 2298 (Ueta et al. 2001) and HD 168625 (O’Hara et al. 2003). Other grain species that are relatively featureless in the mid-IR could be an alternative to carbon grains, e.g. iron or iron oxide particles, or else ‘dirty’ silicate grains (Jones & Merrill 1976), having larger optical and IR absorptivities outside the mid-IR features than used here, could provide a match to the observed flux distribution without the need for an additional grain species.
4 Discussion
The CS dust mass of 0.10–0.15 M⊙ around SN 2002hh is large, corresponding to an associated gas mass of 10–15 M⊙ if we assume a typical interstellar gas to dust mass ratio of 100. From a fit to its ISO IR spectrum, 0.17 M⊙ of dust has been estimated to be around the archetypal Luminous Blue Variable (LBV) Car (Morris et al. 1999). Another Galactic LBV, AG Car, has a CS dust shell extending from 0.37 to 0.81 pc radius, with a dust mass of 0.25 M⊙ and a gas to dust mass ratio of only 32 (Voors et al. 2000). A mass of 0.1 M⊙ has been derived for the dust shell around the galactic LBV-candidate AFGL 2298 (Ueta et al. 2001), while evidence has been found for at least two past superwind events in the dust shell around the self-obscured M supergiant NML Cyg, with total dust masses of 0.02 and 0.3 M⊙, respectively (Bloecker et al. 2001). It seems plausible that the dust shell observed around SN 2002hh may have originated from an episode of enhanced mass loss by the massive star progenitor of this Type II supernova.
The IR luminosity of 2 L⊙ derived for SN 2002hh at day-600 is much higher than the likely luminosity of the supernova ejecta at that epoch. However, given that the light travel timescale across the dust shell is in excess of a year for the models plotted in Fig. 2, this could be explainable in terms of the time lags associated with the emission from flash-heated circumstellar dust. A number of Type II SNe have previously been found to exhibit near-IR (m) excesses that could be attributed to emission from hot dust, often with post-300d luminosities comparable to or larger than that observed from SN 2002hh (see e.g. Gerardy et al. 2002). The high luminosities and the pattern of time evolution of these near-IR excesses has led to them usually being interpreted as arising from flash-heated pre-existing circumstellar dust shells (Dwek 1983; Graham & Meikle 1986; Gerady et al. 2002; Pozzo et al. 2004). The 2.2–3.5-m emission observed from SN 1979C between days 259 and 440, and from SN 1980K between days 215 and 357, was interpreted by Dwek (1983) as due to pre-existing dust, extending in both cases from cm, with visual optical depths of 0.3 and 0.03 and total dust masses of M⊙ and M⊙, respectively. Pozzo et al. (2004) estimated a dust mass of at least M⊙ around the Type IIn SN 1998S, though they suggested that both pre-existing and newly formed dust grains may have played a role in the evolution of its near-IR spectral energy distribution.
Our observations do not rule out the possibility that significant quantities of new dust may have formed in the ejecta of SN 2002hh itself, merely that the observed IR emission is dominated by dust located much further out than the SN ejecta. At the distance of NGC 6946, the day-615 8-m emission from the ejecta dust of SN 1987A (Wooden et al. 1993; Bouchet & Danziger 1993) would have been 35 times weaker than that observed from SN 2002hh. SN 1987A’s dust visual optical depth at day-600 was estimated to be 0.6 (Lucy et al. 1991), so even if it had been able to condense much more dust than the few M⊙ estimated (Dwek et al. 1992; Wooden et al. 1993), its mid-IR emission could only have increased by a further factor of two, still leaving it a factor of ten lower than observed from the CS shell surrounding SN 2002hh. One indication of new dust forming in SN ejecta, generally seen in the second year after outburst, is the development of asymmetric blue-shifted emission-line profiles, caused by dust preferentially extinguishing redshifted emission from material behind the supernova (Danziger et al. 1991). SN 2002hh has not so far shown any such line-profile evolution. A comparison of visible spectra taken in July 2003 (Mattila, Meikle & Greimel 2004) with those taken in August and September 2004 (Clayton & Welch 2004) indicates that the H profile shape did not undergo any significant change between 250d and 700d after outburst.
Our IR observations of SN 2002hh indicate that significant amounts of dust
can be produced around the immediate progenitors of some massive-star
supernovae. The question of whether such dust can survive the impact of
high-velocity ejecta from the subsequent supernova and thereby go on to
enrich the dust content of the host galaxy is an interesting one.
SN 2002hh is located in a relatively nearby face-on galaxy, which enabled
it to be discovered in the optical despite its high dust obscuration. For
many galaxies, however, SNe with similar or even greater self-obscuration
could easily escape detection by optical supernova searches, suggesting
that IR-based supernova searches may be required in order to determine the
ratio of dusty to non-dusty SNe and the contribution made by the former to
the overall dust enrichment rate of galaxies.
References
- Barlow et al. (2004) Barlow, M., Fabbri, J., Meixner, M. & Sugerman, B. 2004, IAU Circ. 8400
- Bloecker et al. (2001) Bloecker, T., Balega, Y., Hofmann, K.-H., & Weigelt, G. 2001, A&A, 369, 142
- Bouchet & Danziger (1993) Bouchet, P., & Danziger, I. J. 1993, A&A, 273, 451
- Clayton (1979) Clayton, D. D. 1979, Ap&SS, 65, 179
- Clayton, Amari & Zinner (1997) Clayton, D. D., Amari, S., & Zinner, E. 1997, Ap&SS, 251, 355
- Clayton, Deneault & Meyer (2001) Clayton, D. D., Deneault, E. A.-N., & Meyer, B. S. 2001, ApJ, 562, 480
- Clayton a& Welch (2004) Clayton, G.C., & Welch, D.L. 2004, AAS Meeting 205, 71.12
- Danziger et al. (1991) Danziger, I. J., Lucy, L. B., Bouchet, P., & Gouiffes, C. 1991, Supernovae, S. E. Woosley, Springer-Verlag: New York, 69
- Draine & Lee (1984) Draine, B. T., & Lee, H. M. 1984, 285, 89
- Dunne et al. (2003) Dunne, L., Eales, S., Ivison, R., Morgan, H., & Edmunds, M. 2003, Nature, 424, 285
- Dwek (1983) Dwek, E. 1988, ApJ, 274, 175
- Dwek (1988) Dwek, E. 1988, ApJ, 329, 814
- Dwek & Scalo (1980) Dwek, E., & Scalo, J. 1980, ApJ, 233, 193
- Dwek et al. (1992) Dwek, E. et al. 1992, ApJ, 389, L21
- Dwek (2004) Dwek, E. 2004, ApJ, 607, 848
- Ercolano et al. (2005) Ercolano, B., Barlow, M. J., & Storey, M. J. 2005, MNRAS, submitted
- Gerardy et al. (2002) Gerardy, C. L. et al. 2002, ApJ, 575, 1007
- Graham & Meikle (1986) Graham, J. R., Meikle W. P. S. 1986, 221, 789
- Hanner (1988) Hanner. M. 1988, Infrared Observations of Comets Halley and Wilson and Properties of the Grains, NASA: Washington D.C., 22
- Holwerda et al. (2005) Holwerda, B. W., Gonzalez, R. A., Allen, R. J., & van der Kruit, P. C. 2005, AJ, in press
- Ivison et al. (2000) Ivison, R. J. et al. 2000, MNRAS, 315, 209
- Karachentsev et al. (2000) Karachentsev I. D., Sharina M. E., Huchtmeier W. K. 2000, A&A, 362, 544
- Jones & Merrill (1976) Jones T. W., & Merrill, K. M. 1976, ApJ, 209, 509
- Kennicutt et al. (2003) Kennicutt, R. C. Jr. et al. 2003, PASP, 115, 928
- Krause et al. (2004) Krause, O., et al. 2004, Nature, 432, 596
- Li (2002) Li, W. 2002, IAU Circ. 8006
- Lucy et al. (2001) Lucy, L. B., Danziger, I. J., Gouiffes, C. & Bouchet, P. 1991, Supernovae, S. E. Woosley, Springer-Verlag: New York, 82
- Mathis, Rumpl & Nordsieck (1977) Mathis J. S., Rumpl, W., & Nordsieck, K. H. 1977, 217, 425
- Mattila et al. (2004) Mattila, S., Meikle W. P. A. & Greimel, R. 2004, New Astr. Revs., 48, 595
- Meikle et al. (2002) Meikle, P., Mattila, S., Smartt, S., MacDonald, E., Clewley, L., & Dalton, G. 2002, IAU Circ. 8024
- Morris et al. (1999) Morris, P. W., et al. 1999, Nature, 402, 502
- O’Hara et al. (2003) O’Hara, T. B., Meixner, M., Speck, A. K., Ueta, T., & Bobrowsky, M. 2003, ApJ, 598, 1255
- Pozzo et al. (2004) Pozzo, M. et al. 2004, MNRAS, 352, 457
- Stockdale et al. (2002) Stockdale C. J. et al. 2002, IAU Circ. 8018
- Sugerman et al. (2005) Sugerman, B. E. K., et al. 2005, ApJ, submitted
- Todina & Ferrara (2001) Todini, P., & Ferrara, A. 2001, MNRAS, 325, 726
- Travaglio et al. (1999) Travaglio, C., Gallino, R., Amari, S., Zinner, E., Woosley, S., & Lewis, R. S. 1999, ApJ, 510, 325
- Ueta et al. (2001) Ueta, T. et al. 2001, ApJ, 548, 1020
- Ueta & Meixner (2003) Ueta, T., & Meixner, M. 2003, ApJ, 586, 1338
- Voors et al. (2000) Voors, R. H. M. et al. 2000, A&A, 356, 501
- Wooden et al. (1993) Wooden, D. H. et al. 1993, ApJ, 88, 477
- Zubko et al. (1996) Zubko, V. G., Mennella, V., Colangeli, L., & Bussoletti, E. 1996, 282, 1321
| Instrument | IRAC | IRAC | IRAC | IRAC | MIPS |
|---|---|---|---|---|---|
| [m] | 3.6 | 4.5 | 5.8 | 8.0 | 24.0 |
| T(sec)a | 26.8 | 26.8 | 26.8 | 26.8 | 7.34 |
| Star 1 Jun/Jul 04 | 0.72 0.14 | 1.22 0.12 | 4.28 0.50 | 17.0 1.6 | 46.5 5.1 |
| Star 1 25th Nov 04 | 0.88 0.17 | 1.07 0.12 | 3.65 0.35 | 12.8 1.3 | – |
| Star 2 10th Jun 04 | 119.6 18.4 | 68.9 4.2 | 54.9 2.1 | 31.4 1.6 | – |
| Star 2 25th Nov 04 | 115.6 15.4 | 58.8 4.2 | 53.5 2.2 | 30.4 1.2 | – |
| Star 3 10th Jun 04 | 1.12 0.35 | 0.54 0.10 | 0.71 0.21 | 1.23 0.28 | – |
| Star 3 25th Nov 04 | 0.78 0.19 | 0.62 0.21 | 0.58 0.16 | 1.78 0.82 | – |
| Star 4 Jun/Jul 04 | 0.64 0.17 | 0.57 0.11 | 3.52 0.46 | 9.3 1.2 | 27.7 4.5 |
| Star 4 25th Nov 04 | 0.64 0.24 | 0.59 0.13 | 3.27 0.36 | 10.9 1.1 | – |
| Star 5 10th Jun 04 | – | – | 2.11 0.36 | 8.6 1.2 | – |
| Star 5 25th Nov 04 | – | 0.18 0.09 | 1.80 0.32 | 6.7 1.1 | – |
- a
-
Effective exposure time per pixel