The Ages and Metallicities of Galaxies in the Local Universe
Abstract
We derive stellar metallicities, light-weighted ages and stellar masses for a magnitude-limited sample of 175,128 galaxies drawn from the Sloan Digital Sky Survey Data Release Two (SDSS DR2). We compute median-likelihood estimates of these parameters using a large library of model spectra at medium-high resolution, covering a comprehensive range of star formation histories. The constraints we derive are set by the simultaneous fit of five spectral absorption features, which are well reproduced by our population synthesis models. By design, these constraints depend only weakly on the /Fe element abundance ratio. Our sample includes galaxies of all types spanning the full range in star formation activity, from dormant early-type to actively star-forming galaxies. By analysing a subsample of 44,254 high-quality spectra, we show that, in the mean, galaxies follow a sequence of increasing stellar metallicity, age and stellar mass at increasing 4000 Å-break strength. For galaxies of intermediate mass, stronger Balmer absorption at fixed 4000 Å-break strength is associated with higher metallicity and younger age. We investigate how stellar metallicity and age depend on total galaxy stellar mass. Low-mass galaxies are typically young and metal-poor, massive galaxies old and metal-rich, with a rapid transition between these regimes over the stellar mass range . Both high- and low-concentration galaxies follow these relations, but there is a large dispersion in stellar metallicity at fixed stellar mass, especially for low-concentration galaxies of intermediate mass. Despite the large scatter, the relation between stellar metallicity and stellar mass is similar to the correlation between gas-phase oxygen abundance and stellar mass for star-forming galaxies. This is confirmed by the good correlation between stellar metallicity and gas-phase oxygen abundance for galaxies with both measures. The substantial range in stellar metallicity at fixed gas-phase oxygen abundance suggests that gas ejection and/or accretion are important factors in galactic chemical evolution.
keywords:
galaxies: formation, galaxies: evolution, galaxies: stellar content1 Introduction
The ages and metallicities of stellar populations in nearby galaxies are direct tracers of the star formation and chemical enrichment histories of the Universe. Clues to the ages and metallicities of the stars may be inferred from the integrated spectra of galaxies, using ‘stellar population synthesis models’ (Tinsley, 1978; Bruzual A., 1983; Bruzual A. & Charlot, 1993; Bressan et al., 1994; Fioc & Rocca-Volmerange, 1997; Maraston, 1998; Vazdekis, 1999). Analyses based on these models have been traditionally limited by the difficulty of deriving independent constraints on the age, star formation history, metallicity and dust content of a galaxy. For example, changes in age, metallicity and attenuation by dust all have similar effects on the colours and low-resolution spectra of galaxies. This gives rise to well-known ‘near-degeneracies’ in the constraints derived on these different parameters.
The expectation is that these degeneracies may be broken, at least in part, by appealing to refined spectral diagnostics which are not sensitive to attenuation by dust and have different sensitivities to age and metallicity. Studies in this area have focused on a set of 25 absorption features defined and calibrated in the spectra of 460 nearby Galactic stars obtained at Lick Observatory (e.g. Faber, 1973; Worthey et al., 1994; Worthey & Ottaviani, 1997). These studies all pertain to early-type galaxies, because the lack of hot stars in the Lick library does not allow the spectral interpretation of star-forming galaxies. The conclusion from these studies is that, for early-type galaxies, comparisons of the strengths of metallic lines and age-sensitive Balmer lines can break the age-metallicity degeneracy, but only in a relative way: the derived ages and metallicities appear to depend strongly on the specific choice of metal indices (e.g. Kuntschner et al., 2001; Eisenstein et al., 2003; Thomas et al., 2004). This is because the Galactic stars used to calibrate the Lick indices have approximately solar metal abundance ratios at any metallicity, whereas the ratio of -elements to iron is seen to increase from dwarf to massive early-type galaxies (e.g. Worthey et al., 1992).
A main weakness of the original calibration of Lick indices is that it relies on spectra which were not calibrated in flux, and for which the resolution ( Å FWHM) is three times lower than achieved by modern spectroscopic galaxy surveys, such as the Sloan Digital Sky Survey (SDSS; York et al. 2000). Thus, the high-quality spectra from these surveys must be degraded to the calibration and resolution of the original Lick spectra for index-strength analyses to be performed. The situation has changed recently with the development of medium-high resolution ( Å FWHM), flux-calibrated population synthesis models including stars in the full temperature range (Vazdekis, 2001; Bruzual & Charlot, 2003). These models can be compared directly to high-quality observed spectra of both early-type and late-type galaxies. Several studies have also quantified the sensitivity of stellar absorption features to changes in element abundance ratios in galaxy spectra (Tantalo et al., 1998; Trager et al., 2000; Thomas et al., 2003b). These developments coincide with the advent of large homogeneous samples of galaxy spectra gathered by modern surveys such as the SDSS.
This is the first paper of a series in which we combine modern population synthesis techniques with the statistical power of the SDSS to investigate the connection between metallicity, age and stellar mass in nearby galaxies. Here, we use the medium-high resolution population synthesis code of Bruzual & Charlot (2003, hereafter BC03) to derive estimates of the metallicities, ages and stellar masses of a sample of nearby galaxies from the SDSS Data Release Two (DR2). We adopt a Bayesian statistical approach and derive full likelihood distributions for these physical parameters by comparing the observed spectrum of each galaxy with a comprehensive library of model spectra corresponding to different star formation histories. The comparison is driven by the strengths of 5 spectral features selected to depend only weakly on the /Fe ratio, which we measure in the same way in model and observed spectra.
An important specificity of our work is that we derive the above constraints not only for quiescent, early-type galaxies, but also for late-type, star-forming galaxies, for which the contamination of stellar absorption features by nebular emission must be removed. We explore the relationships between metallicity, age and stellar mass and the dependence of these relationships on galaxy structure. In a companion paper, we exploit these results to investigate the physical origin of the colour-magnitude relation and of the relation between -index strength and velocity dispersion for early-type galaxies. The total metal content of the local Universe and the distribution of metals as a function of galaxy properties will be the subject of a subsequent paper.
The paper is organized as follows. In Section 2 below, we present our sample of SDSS spectra and the models used to interpret them. We also describe our method for deriving metallicities, ages and stellar masses from observed galaxy spectra. The results are presented in Section 3, where we study the dependence of metallicity and age on total stellar mass and the age-metallicity relation as a function of galaxy structure. We also address in that section the influence of aperture bias on our derived parameters. We summarize and briefly discuss our results in Section 4.
2 The approach
In this section, we describe our approach for deriving estimates of light-weighted ages and metallicities from the observed spectra of SDSS galaxies. These spectra are discussed in Section 2.1, along with the models we use to interpret them. In Section 2.2, we select a set of spectral absorption features which we argue should most robustly constrain age and metallicity. Then, in Section 2.3, we outline the statistical approach we adopt to derive ages and metallicities from galaxy spectra. We also highlight the sensitivity of our constraints on age and metallicity to the observational signal-to-noise ratio (S/N) of the spectra.
2.1 Observed and model spectra
The observed spectra we consider are drawn from the SDSS DR2 (Abazajian et al., 2004). The SDSS is an imaging and spectroscopic survey of the high Galactic latitude sky, which will obtain , , , and photometry of almost a quarter of the sky and spectra of at least 700,000 objects (York et al., 2000). The spectra are taken using 3″-diameter fibres, positioned as close as possible to the centres of the target galaxies. The flux- and wavelength-calibrated spectra cover the range from 3800 to 9200 Å with a resolution of . Our sample, drawn from the SDSS DR2, includes unique spectra of 196,673 galaxies with Petrosian -band magnitudes in the range (after correction for foreground Galactic extinction using the extinction maps of Schlegel et al. 1998). The galaxies span the full range of types, from actively star-forming, late-type galaxies to dormant, early-type galaxies. The median redshift is 0.13. A more detailed description of this sample is given in Section 3 below.
To interpret these observed spectra in terms of physical parameters such as age, metallicity and stellar mass, we use the recent population synthesis models of BC03. These models are based on ‘STELIB’, a newly available library of observed stellar spectra assembled by Le Borgne et al. (2003). The models have a spectral resolution of 3 Å FWHM across the whole wavelength range from 3200 to 9500 Å. They are thus ideally matched to the SDSS spectra.
We note that, to interpret the spectra of star-forming and active galaxies with these models, we must first remove the contamination of the observed spectra by nebular emission lines. This is achieved using the procedure outlined by Tremonti et al. (2004), which is optimized for use with SDSS galaxy spectra (see also Tremonti, 2003). This consists in performing first a non-negative least-squares fit of the emission-line-free regions of the observed spectrum, using a set of model template spectra broadened to the observed velocity dispersion (the template spectra correspond to 30 instantaneous-burst models of different ages and metallicities computed using the BC03 code). Once the fitted spectrum is subtracted from the observed spectrum, the residuals can be fitted to Gaussian-broadened emission-line templates. The method assumes a single broadening width for all the Balmer lines, and another (independent) width for all the forbidden lines. The strength of each line is fitted independently. Then, the fitted emission lines are subtracted from the original observed spectrum to produce a ‘pure’ absorption-line spectrum suited to our analysis.
2.2 Stellar absorption diagnostics of age and metallicity
The strongest stellar absorption features in the optical spectra of galaxies form the basis of the Lick system of spectral indices (Burstein et al. 1984; Gorgas et al. 1993; Worthey et al. 1994; Worthey & Ottaviani 1997; Trager et al. 1998; see also Section 1). Each index in this system is defined by a central ‘feature bandpass’ and two adjacent ‘pseudo-continuum bandpasses’. The above studies have shown that some Lick indices are primarily sensitive to age, such as those based on H-Balmer lines, while others are primarily sensitive to metallicity, such as several Fe- and Mg-based indices at wavelengths between 4500 and 5700 Å. We also consider here the 4000-Å break index of Balogh et al. (1999), which we denote , which is defined as the ratio of the average flux densities in the narrow bands 4000–4100 Å and 3850–3950 Å.111This index is sometimes denoted by . This index depends somewhat on metallicity but correlates more with the ratio of present to past-averaged star formation rates in galaxies (see fig. 2 of Kauffmann et al. 2003a and fig. 27 of Brinchmann et al. 2004).
In previous studies based on models with low spectral resolution, the strengths of Lick indices had to be modelled analytically as functions of the effective temperatures, gravities and metallicities of the stars (Worthey et al. 1994; Worthey & Ottaviani 1997; Gorgas et al. 1999). These ‘fitting functions’ were not appropriate for hot stars, and hence, index-strength analyses had to be restricted to old stellar populations. Moreover, as mentioned in Section 1, the stellar spectra on which the Lick indices were originally calibrated had lower resolution than typical galaxy spectra today and were not flux-calibrated. These various weaknesses are resolved here by our adoption of the medium-high resolution, flux-calibrated BC03 models. These models can be compared directly to the SDSS spectra of galaxies with any star formation history, and the Lick indices can be measured in the same way in model and observed spectra.
Like previous models, however, the BC03 models rely on a spectral library of nearby stars with near solar metal abundance ratios at any metallicity. The models are therefore expected to show discrepancies when compared to galaxies where the abundance ratios differ from those of nearby stars.222The abundance ratio of elements (such as N, O, Mg, Ca, Na, Ne, S, Si, Ti), which are produced mainly by Type II supernovae, to Fe-peak elements (such as Cr, Mn, Fe, Co, Ni, Cu, Zn), which are produced mainly by Type Ia supernovae, is observed to vary in external galaxies (e.g., Worthey et al., 1992; Thomas et al., 2003a). In fact, such discrepancies appear to be responsible for the fact that some spectral features, such as CN1, CN2, TiO1, TiO2, Ca4227 and several Mg and Fe lines, were not well reproduced when BC03 compared their models with a sample of high-quality galaxy spectra drawn from SDSS Early Data Release (Stoughton et al., 2002).
Several studies have addressed the dependence of Lick index strengths on changes in the relative ratios of heavy elements (González, 1993; Tripicco & Bell, 1995; Tantalo et al., 1998; Trager et al., 2000; Vazdekis, 2001; Thomas et al., 2003b; Tantalo & Chiosi, 2004; Thomas et al., 2004, see also BC03). These studies have led to the identification of composite Mg+Fe indices, which are sensitive to metallicity (i.e. the fraction by mass of all elements heavier than helium over the total gas mass) but show little sensitivity to /Fe (i.e. the ratio of the total mass of elements to the mass of iron; see footnote 2). Among these, we use here
| (1) |
as proposed by Thomas et al. 2003b, and
| (2) |
as defined in BC03.
We wish to extract ages and metallicities from the SDSS galaxy spectra. We therefore fit simultaneously both metal-sensitive and age-sensitive indices. Among the 28 spectral indices studied by BC03, we concentrate on those that are best reproduced by the models. This requirement already excludes several Fe-based indices, the three Mg-based indices, Ca4227, Ca4455, the CN, TiO and NaD features (see fig. 18 of BC03). Among the remaining indices we identify those that are known to have at most a weak dependence on /Fe. and are suitable metal-sensitive indices and H is a suitable age-sensitive index. We also include , which is sensitive to the ratio of present to past-averaged star formation rate (see above). We are not aware of any study indicating the dependence of this index on /Fe. Finally, to better constrain age we decided to include also the two higher-order Balmer lines, H and H. These indices have been recently shown to depend on variations in element abundance ratios at metallicities around solar and above (Thomas et al., 2004; Korn et al., 2005). However, we find that including them in our procedure does not produce results systematically different from those obtained without them, while it provides smaller errors on both age and metallicity estimates. Therefore, we decide to use also H+H. We choose the sum of H and H because it is better reproduced by the models than the two indices separately (see fig. 18 of BC03). Thus, our final set of indices is composed of , H, H+H, and . This is the minimum set that allows us to derive good constraints on metallicity and age simultaneously and to recover well the parameters of simulated galaxies (see section 2.4 below).
The solid histograms in Fig. 1 show the distributions in ‘resolving power’ of these five spectral features for the galaxies in our sample. The resolving power is defined as the ratio between the 5–95 percent percentile range of the distribution of index strengths for all galaxies in the sample, , and the observational error for each galaxy, . The resolving power is largest () for and slightly lower () for the other indices. Also shown as dotted histograms in Fig. 1 are the analogous distributions in resolving power for a subsample of galaxies with mean signal-to-noise per pixel greater than 20. As expected, the distributions for these galaxies are shifted to higher values, because of the smaller observational errors.
We note that the strengths of some spectral absorption indices are sensitive to the stellar velocity dispersion in a galaxy (e.g. Davies et al., 1993; Longhetti et al., 1998; Trager et al., 1998; Kuntschner, 2004). The indices that are most affected are those measured with the narrowest pseudo-continuum bandpass definitions. In particular this effect is seen in Fe-based indices and therefore also in the composite Mg+Fe indices. The BC03 population synthesis code provides SSP spectra broadened to different velocity dispersions. This allows us to compare each galaxy spectra with models that have a similar velocity dispersion (see Section 2.3).

2.3 Statistical estimates of age and metallicity
We wish to estimate not only the most likely values of the ages and metallicities of SDSS galaxies, but also the accuracy of these values. To this purpose, we adopt a Bayesian statistical approach, similar to the one outlined by Kauffmann et al. (2003a). The goal is to obtain the likelihood distribution of a given parameter in the space of all possible values of . This is obtained by comparing the observational data with a set of models that populate the space of all possible according to a prior distribution which represents our prejudice about the relative likelihood of different values in absence of any data.
We generate a library of 150,000 Monte Carlo realizations of a full range of physically plausible star formation histories. Following Kauffmann et al. (2003a), each star formation history is parametrized in terms of a continuous model in which stars are formed from the time to the present according to the law . Random bursts of star formation are superposed on this continuous model. We take the formation time to be uniformly distributed between 13.5 and 1.5 Gyr and the star formation time-scale parameter to be uniform over the interval from 0 to 1 Gyr-1. The bursts can occur at all times after with equal probability, set in such a way that 10 percent of the galaxies in the library experience a burst in the last 2 Gyr.333In Kauffmann et al. (2003a) this parameter was set such that 50 percent of the models in the library experienced a burst in the last 2 Gyr. We reduce this fraction to 10 percent because it provides a more uniform distribution of the models in light-weighted age. The influence on our results from changing this fraction is discussed in Section 2.4.2. They are parametrized in terms of the fraction of stellar mass produced during the burst relative to the total mass formed by the continuous model. The ratio is logarithmically distributed between 0.03 and 4. During a burst, stars form at a constant rate for a time distributed uniformly in the range – yr. The velocity dispersions of the models are distributed uniformly in the range 50–350 . We further take the models to be distributed logarithmically in metallicity in the range 0.2–2.5 and make the density of models drop smoothly as at metallicities from 0.2 down to 0.02 , in order not to overrepresent extremely metal-poor models. All stars in a given model have the same fixed metallicity, which we interpret as the ‘(optical) light-weighted’ metallicity.
For each model in the library we compute the following properties:
-
1.
the strengths of the , H, H+H, and spectral indices, measured in the same way as in the SDSS spectra;
-
2.
the -band light-weighted age, evaluated by the integral , where is the total -band flux produced by stars of age . We refer below to the -band light-weighted age simply as the ‘age’ of a galaxy;
-
3.
the -band stellar mass-to-light ratio , which accounts for the gas mass returned to the ISM by evolved stars (see also section 3.1 of BC03);
-
4.
the apparent , , , and magnitudes of the model at redshifts between 0 and 0.3 in steps of 0.01.
The models in the library provide accurate simultaneous fits to the strengths of the 5 spectral indices , H, H+H, and that we have selected to derive age and metallicity estimates from SDSS galaxy spectra. To illustrate this, Fig. 2 shows the distribution of the differences between the best-fit and observed strengths of each index, in units of the observational error, for the galaxies in our sample. Because of the dependence of the composite Mg+Fe indices on stellar velocity dispersion, when fitting the index strengths of an observed galaxy, we only include those models for which the stellar velocity dispersion is within of the observed one.444The median uncertainty on velocity dispersion is for the full sample and only for galaxies with S/N20. The plain histograms in Fig. 2 show the distributions for the sample as a whole, while the hatched histograms show the distributions for those galaxies with a median S/N per pixel greater than 20. For both samples, the deviations between observations and best-fit models are within the observational errors for all indices, as indicated by the comparison with a Gaussian distribution of unit standard deviation (dotted line). There is no strong correlation between the residuals of the different indices.

The comparison of the strengths of , H, H+H, and in the spectrum of an observed SDSS galaxy with the strengths of these indices in every model spectrum in the library allows us to construct the probability density functions (PDFs) of physical parameters (such as age, metallicity and mass-to-light ratio) for that galaxy. This is achieved by assigning to each model a weight , where is calculated by comparing the strengths of the 5 indices measured in the observed spectrum with those measured in the model spectrum, given the observational measurement errors. The PDF of a selected physical parameter is then simply given by the distribution in that parameter of the weights of all the models in the library.
The PDF of a given parameter can then be characterized by its mode, which corresponds to the most likely value of the parameter, its median, which can differ from the mode for non-symmetric distributions, and by a confidence interval within which the parameter is constrained at a certain probability level. We often quote below the 68 percent confidence interval corresponding to the 16%–84% percentile range of the PDF, which would be equivalent to the range for a Gaussian distribution.
2.4 Accuracy of the estimates
2.4.1 Dependence on observational properties
We now want to illustrate the kind of constraints that can be obtained on the ages and metallicities of SDSS galaxies with different spectral properties using the method outlined above. Kauffmann et al. (2003a) have shown that the combination of H-Balmer lines and is a discriminating diagnostic of the recent star formation activity in galaxies. We therefore draw 4 galaxies from our sample with high-quality spectra (median S/N per pixel larger than 30) located at different positions along the sequence occupied by SDSS galaxies in the H+H versus diagnostic diagram.
The solid distributions in Fig. 3 show the constraints obtained on the metallicities (left-hand plot) and ages (right-hand plot) of these galaxies in two cases: when including only the age-sensitive indices , H and H+H to constrain the fits (bottom panels), and when including also the metal-sensitive indices and (top panels). As expected, the ages are well constrained by , H and H+H alone, and the corresponding PDFs do not change appreciably when including also the constraints from metal-sensitive indices. In contrast, the metallicities are well constrained only when the metal-sensitive indices are included in the fit. In each panel in Fig. 3, the arrows indicate the median (longer one) and the and percentiles (shorter ones) of the PDF. The 68 percent confidence interval becomes narrower when all the five indices are included, and the median of the distribution in this case is consistent with that obtained when including only the age-sensitive indices. We note that age and metallicity appear to correlate with (indicated on the figure) for these 4 galaxies, and that the constraints on metallicity are weakest for the galaxy with the lowest . This is not a coincidence, as we shall see in Section 3 below.


It is important to note that the observed S/N directly influences the uncertainties in the age and metallicity estimates. To investigate this, we consider a set of galaxies with index strengths similar to those of the galaxies in Fig. 3, but with lower median S/N per pixel, e.g. 20. We take the average errors in the index strengths of these low-S/N galaxies to be typical of errors that would be measured at the same S/N for the galaxies in Fig. 3. We then mimic 100 realizations of ‘degraded spectra’ of the high-S/N galaxies by randomly drawing index strengths from Gaussian distributions centered on their index values, of widths the typical errors obtained from the lower-S/N galaxies. The PDFs of age and metallicity may be computed for each realization, and the average PDF of the 100 realizations is a good estimator of the results that would be obtained at low S/N for these galaxies.
In the upper panels of Fig. 3, we show the average PDFs obtained in this way when the median S/N per pixel of each galaxy is degraded to 30 (long-dashed line), 20 (short-dashed line) and 10 (dotted line). A median S/N per pixel of 10 is not sufficient to constrain metallicity well (except for the most metal-rich galaxy, which has the spectrum with the strongest absorption features). As we increase the S/N, the distributions narrow down and converge to the PDFs obtained from the original high-S/N spectra. We conclude that a median S/N per pixel of at least 20 is required to reliably constrain metallicity. This is higher than the median value of for the SDSS-DR2 sample. The age estimates do not appear to be significantly affected by low S/N (except for the youngest galaxy), probably because they are constrained strongly by , which has small errors. The results of this exercise are summarized in Table 1.
| 0.430.57 | 0.420.43 | 0.070.27 | 0.090.12 | |
| 0.360.44 | 0.390.27 | 0.020.21 | 0.120.08 | |
| 0.340.35 | 0.370.17 | 0.000.16 | 0.130.06 | |
| 0.410.22 | 0.380.12 | 0.000.12 | 0.140.04 | |
| 9.190.21 | 9.680.18 | 9.840.15 | 9.920.11 | |
| 9.120.15 | 9.680.15 | 9.830.14 | 9.920.10 | |
| 9.120.12 | 9.660.13 | 9.790.14 | 9.920.09 | |
| 9.120.08 | 9.660.13 | 9.790.13 | 9.920.07 | |
The results of Fig. 3 would not change dramatically if we restricted the fit to only a subset of the selected spectral indices. We have checked this by using only H to derive age estimates for the galaxies in Fig. 3, and only to derive metallicity estimates. The median-likelihood estimates of age and metallicity obtained in this way fall within the errors of those shown in Fig. 3. The main effect of reducing the number of indices included in the fitting is to broaden the derived likelihood distributions. For the galaxies of Fig. 3, the average error on age increases from 0.10 dex to 0.14 dex when fitting H alone555It has been noticed that higher-order Balmer lines can yield younger ages than those predicted by H, presumably because of the dependence of higher-order lines on /Fe (e.g. Kuntschner, 2000; Eisenstein et al., 2003). However, we do not see any significant difference in the results when using either H+H only or H only., while the average error on metallicity increases from 0.13 dex to 0.29 dex when fitting alone.
2.4.2 Possible systematic uncertainties
To identify any potential bias in our method, we also tested how well it can recover ages and metallicities of model galaxies for which these parameters are known. We selected 3000 models at random from the library described in Section 2.3. We added Gaussian noise to the index strengths of these models to reflect the average observational errors of our SDSS sample. The ages and metallicities recovered by our method for these models showed no systematic deviation from the true values. For both age and metallicity, the deviations and for the 3000 models followed Gaussian distributions centred on zero of width . Interestingly, the deviations in age and metallicity appear to correlate with each other with a slope . This is consistent with the age-metallicity degeneracy identified in Section 3.3 below. We have checked that the way in which and respond to (noise-induced) changes in metal-sensitive and age-sensitive indices for galaxies with different star formation histories cannot lead to spurious correlations between index strengths and metallicity/age residuals.
We mentioned above that higher-order Balmer lines may be sensitive to the /Fe ratio. To quantify the potential error on our metallicity and age estimates for galaxies with enhanced /Fe relative to solar, we compared the predictions of the Thomas et al. (2004) stellar populations models at solar element abundance ratio, , with those for (a typical ratio for massive elliptical galaxies). We chose 3000 models at random from our library and perturbed their index strengths with Gaussian noise, as above. In addition, we increased the values of H and H to reflect the difference between the and tracks, interpolating in metallicity and age to the values for each model considered. The distributions in and are well represented by Gaussian centred on and , respectively, of width given by the average error on metallicity and age (0.2 and 0.13 respectively). This test indicates that we tend to overestimate the stellar metallicities and underestimate the light-weighted ages of galaxies with supersolar abundance ratios by dex. However, this seems in contradiction with the fact that the results on the galaxies in our sample do not vary systematically if we include or exclude H+H in the fit. This is true also for massive early-type galaxies, which are likely to be -enhanced (e.g. Worthey et al., 1992). The offset of dex may thus be regarded as an upper limit to the error in the ages and metallicities derived from our analysis in the case of non-solar abundance ratios.
Another possible source of systematic error is the choice of prior according to which our model library populates the parameter space. In particular, the mix of continuous and bursty star formation histories may influence the physical parameters in which we are interested, mainly the light-weighted age. To test for this effect, we generated a Monte Carlo library with a modified prior, by increasing to 50 percent (instead of 10 percent) the fraction of models that can undergo a burst of star formation in the last 2 Gyrs. We then compared the (median-likelihood) estimates of light-weighted age and stellar metallicity derived with this modified prior and with our standard prior. Increasing the fraction of bursts, we derive ages 0.07 dex younger, on average, than those derived with our standard prior. This bias mainly affects old, early-type galaxies. Similarly the metallicities are on average 0.04 dex higher than those derived with the standard prior. The effect of these offsets on the relations between age, metallicity and stellar mass that we discuss in Section 3.2 is very small. The zeropoint of the relations changes according to the offsets in metallicity and age reported above, but the shape of the relations remains identical.
2.4.3 Stellar mass estimates
In the remainder of this paper, we will be interested in the dependence of age and metallicity not only on directly observed properties, such as spectral features and morphology, but also on ‘derived’ quantities, such as stellar mass. Kauffmann et al. (2003a) derived Bayesian likelihood estimates of the stellar masses of a sample of SDSS galaxies, based on fits of the and absorption indices. We use a similar approach here and estimate stellar masses for all the galaxies in our sample, based on the fits of , H, H+H, and . We compute the PDF of the stellar mass for each galaxy by scaling the -band mass-to-light ratio of each model to the observed, total -band luminosity of the galaxy.666We assume that the ratio is the same for the whole galaxy as it is in the region sampled by the fibre. See Fig. 13 for the typical fraction of light that enters the fibre. We compute at the observed galaxy redshift and include the effects of attenuation by dust. The -band attenuation is inferred from the difference between the emission-line corrected fibre colour777Fibre magnitudes are obtained using the SDSS photometry directly out to the radius covered by the fibre. They are thus directly comparable to quantites derived from spectroscopy, provided that the fibre is positioned at the centre of the galaxy. Corrections for emission lines are obtained by comparing the magnitudes measured off the spectrum before and after removing emission lines. of the galaxy and the colour of the redshifted (dust-free) model, assuming a single power law () attenuation curve (Charlot & Fall, 2000).
The true attenuation can of course not be negative, but imposing strictly would not account for the errors affecting the measurements of indices and magnitudes. Moreover, at high metallicities, there is a potential problem that the dust-free models providing the best fits to the observed absorption-line strengths can be redder than the observed galaxy (implying negative apparent attenuations). This problem arises because of a discrepancy between the spectral absorption features and the integrated colours of the BC03 models at the metallicity . The colours of these models correspond to stellar evolutionary tracks with (and colour-temperature calibrations for) , but the absorption-line strengths had to be calibrated using stellar spectra for slightly lower metallicity, (see Appendix A of BC03). Hence, the metallicity scale, which is linked to the evolutionary tracks and colours, may be biased high at supra-solar metallicities. This problem affects mainly the most metal-rich, early-type galaxies. To account for this bias, we include models producing dust attenuations down to when computing the PDFs of stellar mass, stellar metallicity and age.888The difference in colour between two old stellar populations of metallicities and , when interpreted as a colour excess, corresponds to a -band attenuation .
A comparison of our stellar mass estimates with those derived by Kauffmann et al. (2003a, which were based on a preliminary version of the BC03 models and an early calibration of the SDSS spectra) for the galaxies in common between the two samples shows overall consistency, with a scatter of dex. Our stellar mass estimates tend to be systematically larger than theirs by dex. A difference of almost dex can be attributed to the different prior used to generate the Monte Carlo library. The remaining offset is likely to originate from their exclusion of all models with colour redder than that observed, while we include models which imply ‘attenuations’ down to .
3 The ages and metallicities of nearby galaxies
We now use the models described in Section 2 to estimate ages and metallicities for a sample of 196,673 galaxies drawn from the SDSS-DR2 (Abazajian et al., 2004, see also Section 2.1 above). Fig. 4 shows the distributions in median S/N per pixel (upper panel) and in redshift (lower panel) of this sample. Although the distribution in redshift extends up to 0.3, in what follows we discuss results only for galaxies in the redshift range . The lower limit is intended to avoid redshifts for which deviations from the Hubble flow can be substantial, but still allows us to include galaxies at very low luminosity (corresponding roughly to a lower mass limit of ). The upper limit corresponds roughly to the redshift at which a typical galaxy is detected with median S/N per pixel greater than 20. These cuts leave us with 175,128 galaxies.
In some applications below, it will be useful to distinguish between different morphological types of galaxies. This can be achieved on the basis of the ‘concentration parameter’ , defined as the ratio of the radii enclosing 90 and 50 percent of the Petrosian -band luminosity of a galaxy. Strateva et al. (2001) and Shimasaku et al. (2001) have shown that the concentration parameter allows a rough classification into galaxy morphological types. Strateva et al. (2001) propose a cut at to separate early- from late-type galaxies. To limit the contamination between the two types, here we define those galaxies with to be ‘early-type’ and those galaxies with to be ‘late-type’. The dotted and dashed lines in Fig. 4 show separately the distributions in median S/N per pixel and in redshift of the resulting subsamples of early- and late-type galaxies, respectively. Early-type galaxies generally have a higher median S/N per pixel and are detected out to higher redshifts than late-type galaxies, as expected from their higher surface brightnesses.
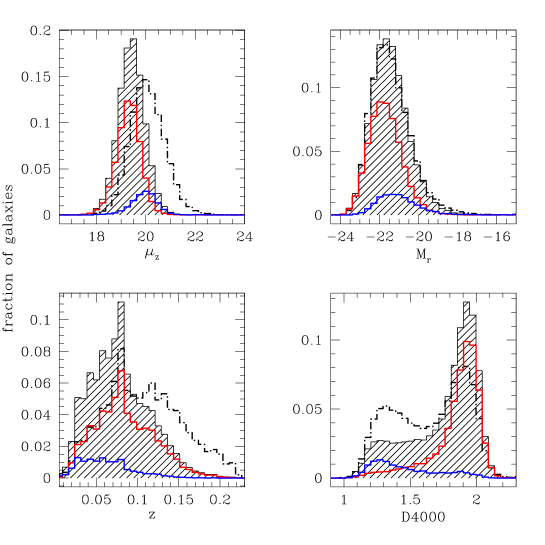
We have shown in Section 2.4.1 and Fig. 3 the impact of the signal-to-noise ratio on our ability to derive reliable constraints on age and, especially, metallicity. In the remainder of this paper we focus on the subsample of 44,254 galaxies with median S/N per pixel greater than 20, for which the constraints on metallicity are the most accurate. The properties of these high-S/N galaxies are summarized in Fig. 5 where we show their distribution (shaded histogram) in -band surface brightness (averaged within the Petrosian radius), Petrosian -band absolute magnitude, redshift and , compared to the distributions for the original sample (dot-dashed line). The red and blue lines distinguish early-type from late-type (high-S/N) galaxies. The S/N requirement excludes about 75 percent of our sample. As can be seen from Fig. 5, this biases the sample toward higher-surface brightness, more concentrated, lower-redshift galaxies. There is not a bias instead in the luminosity distribution. In the redshift range , high-S/N galaxies typically have -band surface brightnesses brighter than 21 mag arcsec-2. They lie primarily at redshifts less than 0.15, where they account for about 40 percent of the galaxies. They also represent roughly 40 percent of the high-concentration sample but only 10 percent of the low-concentration sample. Similarly, they constitute about 30 percent of the galaxies with and 15 percent of those with . Our selection in S/N therefore excludes a substantial fraction of diffuse systems, with potentially subsolar metallicities. We will turn our attention to these systems in the third paper of this series. Their omission here does not alter significantly the results presented in the next sections. In particular, we have checked that the median ages and metallicities found for galaxies with stellar masses less than in Sections 3.2 and 3.3 below would change by at most 0.2 dex if we included galaxies with low S/N in our sample.

3.1 Age, metallicity and mass distributions
We present here the distributions in age, metallicity and stellar mass of the 44,254 galaxies in our final sample. We recall that we estimate -band light-weighted ages but assume that all stars in a given galaxy have a single metallicity (interpreted as the optical light-weighted metallicity). The left-hand panels of Fig. 6 show, from top to bottom, the distributions of the median-likelihood estimates of stellar metallicity, age and stellar mass for the galaxies in our sample (solid histograms). The distribution in metallicity peaks around , the number of galaxies with sub-solar metallicities decreasing smoothly down to 10 percent of solar. The distribution in age indicates that most of the galaxies have fairly old mean stellar populations, with Gyr. The distribution in stellar mass reveals that our sample is dominated by relatively massive galaxies, with , while only a small fraction of the sample has masses below .

The right-hand panels of Fig. 6 show the distributions of one half the 68 percent confidence range in the estimates of , and . Stellar mass is the best constrained parameter, with a typical random uncertainty of dex. Almost all the galaxies in the sample have a stellar mass estimate with an uncertainty less than 0.1 dex. Also, the ages are constrained within 0.2 dex for almost all the galaxies, the typical uncertainty being dex. Similarly the average error on stellar metallicity is 0.12 dex, but the distribution extends to larger errors () than for light-weighted age.
As a comparison, the dotted histograms show the distributions in the derived parameters and the associated uncertainties for the original sample of 175,128 galaxies. There is a significant tail of galaxies with very broad stellar metallicity PDFs, resulting in uncertainties greater than 0.25 dex. This further demonstrates that the uncertainties in metallicity estimates depend sensitively on the S/N in the observed spectra, as discussed in Section 2.4. Also, the distribution in stellar metallicity shows that with our S/N cut we have excluded preferentially galaxies with subsolar metallicity. High-metallicity galaxies tend to be associated with small errors and low-metallicity galaxies with large errors (presumably because of their weaker absorption lines). Including low-S/N galaxies also increases the average error on light-weighted age to dex, but the trend of increasing error with decreasing age is less strong than the analogous trend for metallicity.
3.2 Relations between age, stellar metallicity, stellar mass and gas-phase metallicity
It is interesting to examine how age, metallicity and stellar mass (and the errors on these quantities) are distributed among galaxies with different star formation histories. As shown by Kauffmann et al. (2003a), galaxies with different star formation histories populate different areas of a diagram defined by and the strength of a H-Balmer absorption line (they illustrated this result for ). Galaxies with smooth star formation histories form a sequence extending from actively star-forming galaxies (corresponding to small and strong H-Balmer absorption) to quiescent early-type galaxies (corresponding to large and weak H-Balmer absorption). Galaxies which experienced recent bursts of star formation exhibit the strongest H-Balmer absorption at fixed .
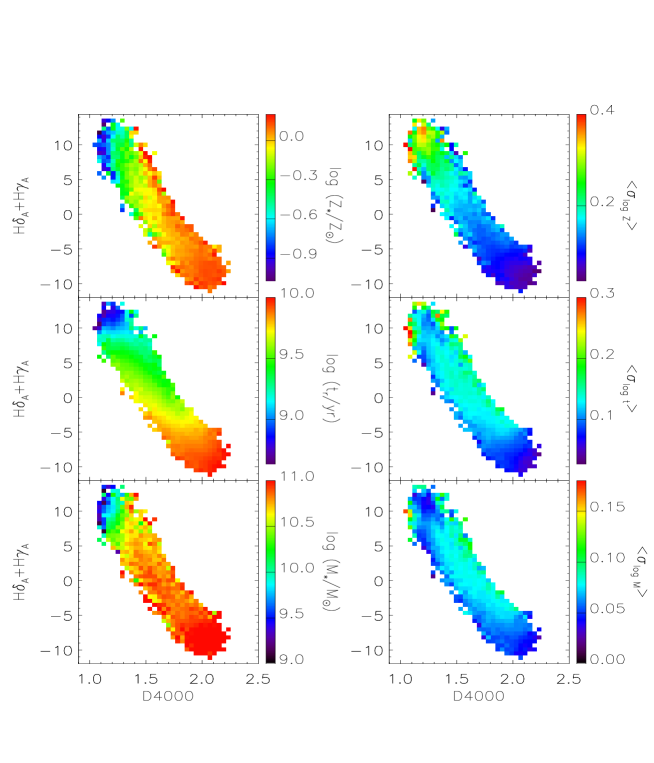
We now explore how the 44,254 high-S/N galaxies in our sample populate such a diagram as a function of their physical parameters derived in Section 3.1 above. We consider here for consistency the diagram defined by and the H+H absorption index. In the left-hand panels of Fig. 7, we have binned and colour-coded this diagram in order to reflect, from top to bottom, the average stellar metallicity, the average age and the average stellar mass of the galaxies falling into each bin. The widths of the bins in and H+H correspond roughly to the mean observational errors in the two quantities for galaxies with median S/N per pixel greater than 20 (0.04 and 0.4, respectively).
The bottom-left panel of Fig. 7 shows that stellar mass increases with along the sequence populated by SDSS galaxies in the H+H versus diagram. The average mass of galaxies with is less than , while that of galaxies with reaches . There is a smooth transition between these two regimes in the central region of the diagram. This confirms the trends in and H as functions of stellar mass observed by Kauffmann et al. (2003b) (see their fig. 1). Both stellar metallicity and age also appear to increase with increasing (upper- and middle-left panels of Fig. 7). The variation in age is very smooth. In the intermediate regime, age appears to decrease with increasing H+H at almost fixed . The variation in metallicity is more noisy, partly because of the larger errors associated with metallicity estimates, especially for low (see Section 3.1). Near the middle of the galaxy sequence, i.e., for , stronger H-Balmer absorption appears to be associated to not only younger but also more metal-rich stellar populations. This is consistent with the idea that these galaxies could have experienced a burst of metal-enriched star formation about 1–2 Gyr ago.999At fixed , this trend in age and metallicity is not consistent with (and more pronounced than) the age-metallicity degeneracy described in Section 3.3.
We have checked that the above trends in stellar metallicity, age and stellar mass do not change significantly if we include galaxies with lower S/N values. The main effect is to increase the scatter in these physical parameters along the H+H versus sequence, mainly because of the larger observational errors in these two indices. Moreover, the average S/N for the full sample does not vary significantly along the relation. For these reasons, we believe that our results are not strongly biased by our cut in S/N.
In the right-hand panels of Fig. 7, we have colour-coded the H+H versus diagram to reflect the average uncertainties in the determinations of stellar metallicity, age and stellar mass (from top to bottom) for the galaxies falling into each bin. These diagrams illustrate how the tightness of the constraints derived on the various physical parameters depends on the strengths of H+H and . The errors in all three parameters tend to be larger at lower , the trend being especially strong for stellar metallicity. We emphasize that the right-hand panels of Fig. 7 do not reflect the rms scatter in the various physical parameters, but rather the average uncertainties associated with determinations of these parameters. For reference, the rms scatter is typically comparable to (or smaller than) the average uncertainty for stellar metallicity and age, but always larger than the average uncertainty for stellar mass.
The results of Fig. 7 suggest that both stellar metallicity and age correlate with stellar mass. We investigate this further in Fig. 8, where we show the distributions of metallicity (panel a) and age (panel b) as function of stellar mass for the 44,254 high-S/N galaxies in our sample. Rather than assigning each galaxy its median-likelihood estimate of each of the three parameters, we keep here the whole information contained in the PDFs. In Fig. 8a, the likelihood distribution of stellar metallicity as a function of stellar mass was obtained by coadding the normalized 2-D likelihood distributions of metallicity and stellar mass for all the galaxies and then re-normalizing along the metallicity axis in bins of stellar mass (we adopted a bin width of 0.2 dex, roughly comparable to the 68 percent confidence range in stellar mass estimates). The solid line indicates the median of the final conditional distribution, and the dashed lines the and percentiles. The percentiles of the metallicity and age distributions at fixed stellar mass are provided in Table 2.
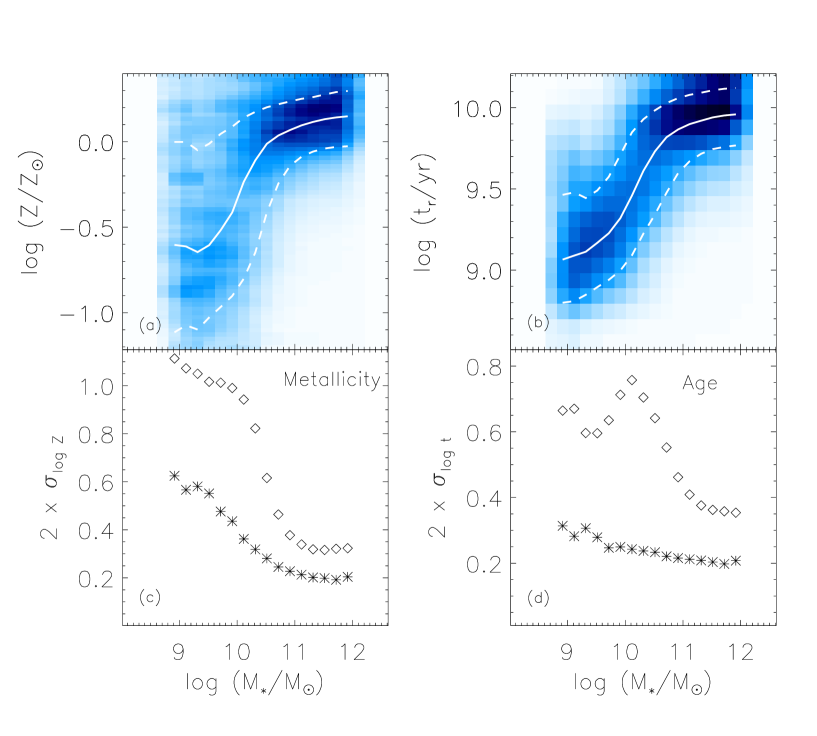
The median shows that metallicity increases with stellar mass, from roughly 20 percent of solar for galaxies with masses below to about 1.4 times solar for those with masses above . In between, stellar metallicity increases rapidly with stellar mass, the trend becoming shallower at . Fig. 8b shows the analogous conditional distribution of age as a function of stellar mass. The median (-band light-weighted) age increases from roughly 1 Gyr for galaxies with masses around to about 6.5 Gyr for those with masses around . For more massive galaxies, the median age continues to increase, but only by about 0.2 dex ( Gyr) over one order of magnitude in stellar mass.
| P50 | P16 | P84 | P50 | P16 | P84 | |
|---|---|---|---|---|---|---|
| 8.91 | -0.60 | -1.11 | -0.00 | 9.06 | 8.80 | 9.46 |
| 9.11 | -0.61 | -1.07 | -0.00 | 9.09 | 8.81 | 9.48 |
| 9.31 | -0.65 | -1.10 | -0.05 | 9.11 | 8.85 | 9.44 |
| 9.51 | -0.61 | -1.03 | -0.01 | 9.17 | 8.89 | 9.49 |
| 9.72 | -0.52 | -0.97 | 0.05 | 9.23 | 8.94 | 9.57 |
| 9.91 | -0.41 | -0.90 | 0.09 | 9.32 | 9.00 | 9.71 |
| 10.11 | -0.23 | -0.80 | 0.14 | 9.46 | 9.09 | 9.85 |
| 10.31 | -0.11 | -0.65 | 0.17 | 9.61 | 9.23 | 9.93 |
| 10.51 | -0.01 | -0.41 | 0.20 | 9.73 | 9.34 | 9.98 |
| 10.72 | 0.04 | -0.24 | 0.22 | 9.82 | 9.48 | 10.03 |
| 10.91 | 0.07 | -0.14 | 0.24 | 9.87 | 9.60 | 10.06 |
| 11.11 | 0.10 | -0.09 | 0.25 | 9.90 | 9.67 | 10.08 |
| 11.31 | 0.12 | -0.06 | 0.26 | 9.92 | 9.72 | 10.09 |
| 11.51 | 0.13 | -0.04 | 0.28 | 9.94 | 9.75 | 10.11 |
| 11.72 | 0.14 | -0.03 | 0.29 | 9.95 | 9.76 | 10.12 |
| 11.91 | 0.15 | -0.03 | 0.30 | 9.96 | 9.77 | 10.12 |
Although the median metallicity and age both increase with increasing stellar mass, the probability levels (indicated by the colour) and the 68 percent confidence ranges reveal broad distributions in the estimates of both parameters. We now explore whether the larger scatter in both distributions at smaller masses can be accounted for by the larger uncertainties in metallicity and age estimates for more metal-poor and younger galaxies, or whether it is indicative of an intrinsically broad distribution in metallicity and age for low-mass galaxies. In the bottom panels of Fig. 8, we compare the scatter in these relations with the uncertainties in the estimates of metallicity (panel c) and age (panel d) at fixed stellar mass. In each panel, the diamonds show the difference between the and percentiles of the conditional distribution shown above as a function of stellar mass. The stars show the mean 68 percent confidence range in the individual estimates of metallicity or age for the galaxies falling into each stellar-mass bin.101010The stars in Fig. 8c,d are not computed using the joint likelihood distribution, but rather by adopting the median of the PDF as our estimate of stellar mass. The comparison of the stars with the diamonds is consistent, given that the width of the stellar mass bins is comparable with the error in stellar mass estimates. Fig. 8c shows that the scatter in the mass-metallicity relation is always larger than the uncertainties in the metallicity estimates, by at least 0.1 dex, and is largest (compared to the error) at about . Similarly, the scatter in the mass-age relation (Fig. 8d) is always larger than the uncertainties in the age estimates and is also largest at about . Fig. 8 clearly indicates that more massive galaxies are older and more metal-rich, while less massive galaxies are younger and more metal-poor. Metallicity and age, however, are not uniquely determined by stellar mass. There is an intrinsic scatter in both parameters, which is particularly evident at intermediate stellar masses. The results of Section 3.3 below indicate that part of this intrinsic scatter can be accounted for by differences in galaxy morphology, the intermediate-mass regime corresponding to the transition between disc-dominated and bulge-dominated galaxies. However, a significant scatter persists even when considering the two classes of galaxies separately.

Tremonti et al. (2004) have shown that the emission-line galaxies in the DR2 sample exhibit a tight relation between stellar mass and gas-phase oxygen abundance, as determined from their nebular spectra. The gas-phase oxygen abundance increases steadily from low to high stellar masses, and then gradually flattens around masses of . There is a striking similarity between the relation Tremonti et al. (2004) found for star forming galaxies and the relation found in Fig. 8 above between stellar metallicity and stellar mass, which includes both star-forming and quiescent galaxies. However, the dispersion in the stellar metallicity versus stellar mass relation is much larger than that in the relation between gas-phase oxygen abundance and stellar mass ( dex). This may partly reflect the larger errors associated with stellar metallicity determinations.
In Fig. 9, we plot stellar metallicity against gas-phase oxygen abundance, 12+log(O/H), for the 7462 high-S/N galaxies of our sample for which both measures are available. We note that gas-phase metallicity is best determined for star-forming galaxies, whereas stellar metallicity is best determined for early-type galaxies. The small dots show the median-likelihood estimates of the stellar and gas-phase metallicities for each galaxy. The larger points indicate the median stellar metallicity in bins of 12+log(O/H), while the outer solid lines show the corresponding and percentiles. There is a relation between the two parameters with approximately unit slope. However, the stellar metallicity is generally lower than the gas-phase metallicity (by dex), as demonstrated by the one-to-one relation (dot-dashed line). This is expected since the nebular metallicity traces the metallicity of the last generations of stars to form, whereas the stellar metallicity represents an average over the entire star formation history of the galaxy. Notably, the large scatter in stellar metallicity at fixed gas-phase oxygen abundance (solid lines) cannot be solely accounted for by the errors in stellar metallicity estimates (indicated by the dashed lines).
To investigate the origin of this scatter, we compute the residuals in with respect to a simple linear fit of the median relation (large dots) in Fig. 9. The residuals are plotted in Fig. 10 as a function of various galaxy properties, including the star formation rate (from Brinchmann et al. 2004) and an indirect estimate of the gas mass fraction inferred from the star formation rate (see eq. 5 of Tremonti et al. 2004). In each panel, we indicate the median trend of the residuals as a function of the property under consideration for galaxies in five bins of gas-phase oxygen abundance, from (blue) to (red). The residuals show positive correlations with stellar mass, surface mass density, concentration parameter and and negative correlations with specific star formation rate, gas mass fraction and H+H. These various trends are almost independent of gas-phase oxygen abundance.111111We checked that the trends of residuals with the strengths of and H+H are not caused by any bias in our estimates of stellar metallicity (see Section 2.4.2). They imply that, at fixed 12+log(O/H), the stars are most metal-rich in massive, high-concentration galaxies, which have exhausted most of their gas and form stars at a lower rate than in the past. The existence of a substantial range of stellar metallicities at fixed gas-phase oxygen abundance in Fig. 9 further suggests that the galaxies in our sample are not well approximated by ‘closed-box’ systems, for which stellar and interstellar metallicities should be tightly related (e.g., Tinsley, 1980). This indicates that gas ejection and/or accretion may be important factors in galaxy chemical evolution.
3.3 Age versus metallicity
Most previous population synthesis studies of the age-metallicity relation for nearby galaxies have focused on early-type galaxies (e.g. Gonzalez et al., 1993; Worthey, 1997; Bernardi et al., 1998; Terlevich et al., 1999; Ferreras et al., 1999; Trager et al., 2000). A few studies have also included the bulges of spiral galaxies (Jablonka et al., 1996; Goudfrooij et al., 1999; Terlevich & Forbes, 2002; Proctor & Sansom, 2002). Our determination, with a new method, of the ages and metallicities of a large sample of nearby galaxies spanning a wide range of star formation activities allows us to re-assess the relation between these two physical parameters.
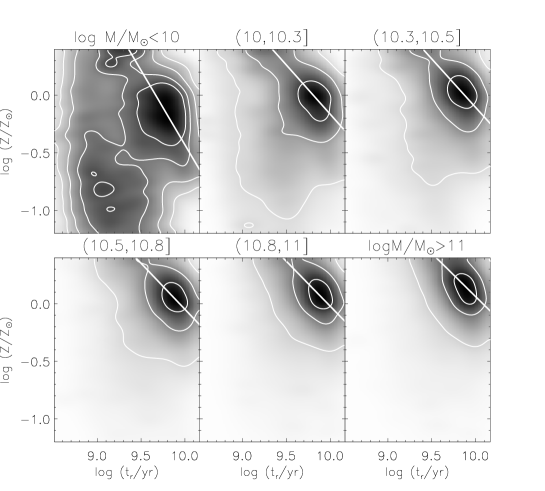
We separate here high-concentration, bulge-dominated early-type galaxies and low-concentration, disk-dominated late-type galaxies as described above to understand whether different conclusions can be drawn for different types of galaxies. We have shown in Fig. 8 that both metallicity and age increase with stellar mass. We may therefore expect that the distribution of galaxies over metallicity and age will change when different masses are considered. This mass dependence may also be different for different types of galaxies. For this reason, we divide each morphological subsample into six bins of stellar mass. Figs 11 and 12 show the age-metallicity relation in these different stellar-mass bins for late-type and early-type galaxies, respectively. The stellar mass increases from in the top-left panel to in the bottom-right panel. These relations were obtained by simply coadding the normalized joint likelihood distributions of age and metallicity for individual galaxies, without further normalization. The grey levels indicate the probability associated with each value of metallicity and age in a square-root scale, while the contours enclose 26, 68, 95 and 99 percent of the total probability.
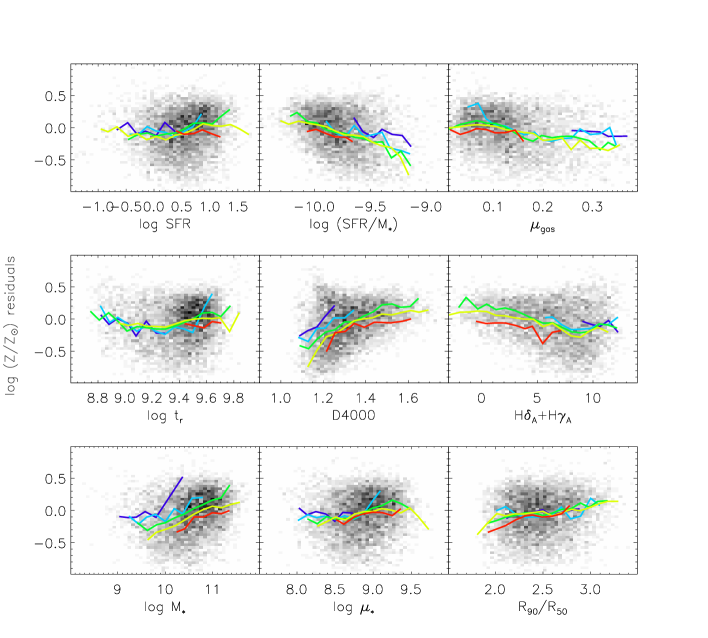
Fig. 11 shows that the ages and metallicities of low-concentration, late-type galaxies change significantly as a function of stellar mass. Galaxies less massive than have typically low metallicities () and young ages (). At intermediate stellar masses, i.e. for , the distribution in metallicity becomes broader and shifts gradually to higher metallicities. The overall spread in age is roughly 0.8 dex, and the distribution shifts slightly to older ages. Late-type galaxies more massive than have predominantly high metallicities () and old ages (). The fraction of young metal-poor galaxies nearly vanishes at the highest masses.
Fig. 12 shows that the ages and metallicities of high-concentration, early-type galaxies depend much more weakly on stellar mass than those of low-concentration, late-type galaxies. The gradual increase of metallicity with stellar mass is still appreciable for early-type galaxies. Galaxies less massive than have metallicities typically in the range –, while galaxies more massive than have metallicities typically above solar. The age range does not exhibit any significant variation with stellar mass, except for a population of young metal-poor galaxies in the lowest-mass bin, which does not show up at higher masses. At low stellar masses, we also notice a small fraction ( percent) of galaxies clumping at much higher metallicities and younger ages than the bulk of the early-type galaxy sample. Detailed inspection reveals that these galaxies are photometric outliers, for which we are uncertain of the accuracy of our fits. Follow-up observations would be required to understand whether the unusual metallicities and ages of these galaxies are consistent with a substantial recent episode of metal-enriched star formation.
We note that the typical light-weighted age for the massive early-type galaxies in our sample is 8 Gyr, which is somewhat younger than the ages usually quoted for (cluster) ellipticals. Differences can arise from differences in the adopted methods. In particular, the ages usually quoted in the literature are derived by comparing the observed distributions in spectral indices with simple stellar population predictions. What we quote here is a proper light-weighted age, calculated by weighting the age of each generation of stars by their luminosity along the entire SFH of each model galaxy. Nevertheless, the relatively young ages we find could reflect an environmental dependence, since the SDSS sample is composed predominantly of galaxies in lower density regions than those used in most studies of early-type galaxies. Indeed, several studies have reported an age difference between early-type galaxies in clusters and in low-density regions from 1.2 Gyr (Bernardi et al., 1998) up to Gyr (Kuntschner et al., 2002; Thomas et al., 2005). We will discuss the properties of the early-type galaxies in our sample in more detail in the second paper of this series.
A comparison of Figs 11 and 12 suggests that the ages and metallicities of late- and early-type galaxies differ primarily at the low-mass end. Low-mass late-type galaxies tend to be younger and more metal-poor than their early-type counterparts (by about 0.6 dex in both age and metallicity). In contrast, massive late-type galaxies tend to have old ages and high metallicities similar to those of their early-type counterparts, even though there is a tail of young ( yr), metal-poor () late-type galaxies with masses greater than in our sample. The high metallicities of most massive late-type galaxies might reflect the influence of their metal-rich bulges. This may be enhanced by the fact that the SDSS spectra sample only the inner regions of the galaxies (see Section 3.4 below).
Figs 11 and 12 also indicate that the relation between stellar metallicity and stellar mass discussed in Section 3.2 holds for both late-type and early-type galaxies. In contrast, the relation between age and stellar mass is much more pronounced for late-type galaxies, which cover a significant range in age ( Gyr). Early-type galaxies do not show such a clear trend, at least above . This is in agreement with previous findings of no significant relation between the ages of early-type galaxies and luminosity (Kuntschner & Davies, 1998; Kuntschner, 1998; Terlevich & Forbes, 2002). At fainter luminosities, however, there are indications of a spread to younger ages (see also Worthey & Ottaviani, 1997; Caldwell & Rose, 1998). We also find that the fraction of young early-type galaxies increases at lower stellar masses. This is true in particular below , reflecting a possible contamination by S0 galaxies (e.g. Poggianti et al., 2001). Finally, we note that for both early-type galaxies and high-mass late-type galaxies, the probability contours of Figs 11 and 12 hint at an anticorrelation between age and stellar metallicity, at given mass. Other workers have pointed out this anticorrelation (e.g. Worthey et al., 1995; Colless et al., 1999; Jørgensen, 1999; Rakos et al., 2001; Poggianti et al., 2001), but it is difficult to assess its significance here because of the correlated errors on age and metallicity (see below).
The dependence of the properties of SDSS galaxies on stellar mass has been addressed in previous studies (e.g. Shen et al., 2003; Brinchmann et al., 2004; Tremonti et al., 2004; Kannappan, 2004; Salim et al., 2005; Jimenez et al., 2005). In particular, Kauffmann et al. (2003b) point out that, at masses around , galaxies separate into two distinct classes of spectral and structural properties. Baldry et al. (2004) have recently shown that this transition around can be seen directly from the colour-magnitude relation. Moreover, this mass range seems also to correspond to a shift in gas richness (Kannappan, 2004). It is interesting to note that, around the same value of stellar mass, there appears to be also a gradual transition in the ages and metallicities of the galaxies. This transition, which is particularly evident for late-type galaxies, causes the dispersion in age and metallicity to be highest for galaxies of intermediate mass.

We have not mentioned so far the potential influence of the ‘age-metallicity degeneracy’ on the results of Figs 11 and 12 (see Section 1). This degeneracy, which arises from the competing effects of age and metallicity on absorption-line strengths, can cause the confusion between old, metal-poor galaxies and young, metal-rich ones (Worthey, 1994). To address this issue, we first evaluate the slope of the age-metallicity degeneracy from the two-dimensional likelihood distribution of each individual galaxy in our sample. This is achieved by computing the matrix of second moments of the likelihood distribution (inside the 68 percent probability contour) with respect to the median and values. The direction of the eigenvector corresponding to the largest eigenvalue of this matrix defines the slope of the age-metallicity degeneracy. In each panel of Figs 11 and 12, the straight line indicates the mean for the galaxies falling into the corresponding bin of stellar mass. The slopes are listed in Table 3.121212These values are consistent with the results of Worthey (1996), which imply that the change in metallicity needed to compensate a change in age at fixed index strength in the spectrum of an old stellar population should correspond to values of ranging from for age-sensitive indices to for metal-sensitive indices. They tend to be steeper for low-concentration galaxies ( to ) than for high-concentration ones ( to ).
| Stellar mass () | ||
|---|---|---|
| 1.78 | 1.29 | |
| 1.41 | 0.85 | |
| 1.28 | 0.84 | |
| 1.15 | 0.80 | |
| 1.05 | 0.78 | |
| 0.95 | 0.75 | |
The orientation of the age-metallicity degeneracy in Figs 11 and 12 indicates that it cannot be responsible for the trends in age and metallicity as a function of stellar mass identified above. However, it can account for the shape of the joint age-metallicity probability contours for early-type galaxies and the most massive late-type galaxies at high metallicities ().
3.4 Aperture bias
The SDSS galaxy spectra on which our analysis is based are taken using 3″-diameter fibres, which collect only the light coming from limited inner regions of the galaxies. We can estimate the fraction of the total galaxy light entering a fibre from the ratio between the fibre flux and the total Petrosian flux. Fig. 13 shows the distribution of this ratio for the 44,254 high-S/N galaxies in our sample. The median value is about 30 percent, and the maximum value about 60 percent. The dashed and dotted lines show the distributions for low-concentration, late-type galaxies and high-concentration, early-type galaxies, respectively. As expected, the fibre tends to collect a smaller fraction of the total light for low-concentration galaxies than for high-concentration galaxies.
Radial gradients in the properties of stellar populations are known to exist for both bulge-dominated (Henry & Worthey, 1999; Saglia et al., 2000; Mehlert et al., 2003) and disk-dominated (Bell & de Jong, 2000; MacArthur et al., 2004) galaxies. Thus, aperture effects are a significant concern for our age and metallicity estimates. Fortunately, the distribution of the fraction of total galaxy light that enters an SDSS fibre does not vary appreciably with redshift (except at very low redshift), because larger galaxies are also brighter and hence selected out to larger distances.
One way to test for the effects of aperture bias on our results is to compare the ages and metallicities of galaxies of similar luminosity located at different redshifts. Because of the presence of both a faint and a bright magnitude cut-off in the SDSS survey, this comparison is possible only for galaxies in a limited absolute-luminosity range, if we want to span a reasonably large redshift range. We consider galaxies with -band absolute magnitudes in the narrow range , which are observed at redshifts between 0.02 and 0.12. At fixed absolute magnitude within this range, both low- and high-concentration galaxies show a decrease (by dex) in typical metallicity from redshift 0.02 to 0.12. High-concentration galaxies do not exhibit any significant trend in age, but the typical age of low-concentration galaxies decreases by about 0.2 dex over the same redshift range.

Another way to examine the potential effects of aperture bias on our results is to compare the age and metallicity distributions of galaxies with similar properties as a function of , where is the minimum of the redshift at which the galaxy reaches the survey faint-magnitude limit and that at which its median S/N per pixel drops below 20 (we assume Poissonian noise, i.e. that the median S/N per pixel scales as the square root of the apparent fibre luminosity). With this approach, we can avoid restricting our test to galaxies in a narrow magnitude range. Also, since we are interested in possible effects of aperture bias on trends with galaxy mass, we divide our sample into the same 6 bins of stellar mass as in Figs 11 and 12 above.
Fig. 14 shows the dependence on of the median (thick line) and the and percentiles (thin lines) of the distributions in stellar metallicity (left-hand plot) and age (right-hand plot) of the high-S/N galaxies in our sample. The solid lines correspond to the subsample of 26,003 early-type galaxies, while the dot-dashed lines correspond to the subsample of 5616 late-type galaxies. For early-type galaxies of different masses, the largest change in median metallicity from one edge of the survey to the other is about 0.2 dex. This is comparable to the error associated with the metallicity estimates of most galaxies and smaller than the overall metallicity change with galaxy mass (see Fig. 8). This variation is also consistent with the metallicity gradient of dex per decade in radius reported by several studies of bulge-dominated galaxies (see Henry & Worthey, 1999; Wu et al., 2004). We note that the largest variation arises for galaxies with intermediate stellar masses, which often have both a prominent bulge and a disk. For disk-dominated, late-type galaxies, the trends in median metallicity with are weaker than for early-type galaxies, although the distributions are broader.
The median age of early-type galaxies does not show any significant trend with in any mass range in Fig. 14. This is in agreement with earlier findings of negligible age gradients in such galaxies (Mehlert et al., 2003; Wu et al., 2004). Late-type galaxies of low and intermediate mass show a similar behaviour. Only the most massive late-type galaxies show a significant decrease (by about 0.2 dex) in median age as a function of , as expected if age gradients in spiral galaxies are stronger for larger galaxies (MacArthur et al., 2004).


The occurrence of negative radial age and metallicity gradients in different types of galaxies and the fact that the SDSS spectra sample no more than 50–60 percent of the total light of a galaxy are likely to cause overestimates of the stellar metallicities and ages of some galaxies in our sample. However, the weak trends in and as a function of in Fig. 14 suggest that aperture biases are unlikely to have a significant effect on the trends we have found previously for metallicity and age as a function of stellar mass.
4 Summary and conclusions
We have used a new approach to derive estimates of light-weighted stellar metallicity, age and stellar mass from the optical spectra of a sample of 200,000 nearby galaxies () drawn from the SDSS DR2. Our method relies on the comparison of the galaxy spectra to a large library of model spectra at medium-high resolution, based on Monte Carlo star formation histories spanning the full physically plausible range. Extending earlier work by Kauffmann et al. (2003a), we have adopted a Bayesian approach to derive the a posteriori likelihood distribution of each physical parameter by computing the goodness of fit of the observed spectrum for all the models in the library. In practice, we compute only the strengths of a set of carefully selected spectral absorption features.
Our analysis shows that stellar absorption features with different sensitivities to age and metallicity must be fitted simultaneously in galaxy spectra to obtain good constraints on both age and metallicity. We focus on several newly calibrated Lick indices and the 4000 Å break (see below). The resolution of our models is higher than that used in most previous studies and is well matched to the resolution of the SDSS spectra. This allows us to measure the indices in the same way in model and galaxy spectra, avoiding any loss of information from the observed spectra. We emphasize that, while most previous studies were restricted to the analysis of old stellar populations, our sample includes galaxies in the full range of star formation activities. For actively star-forming galaxies, the higher resolution of the models is crucial to separate strong emission lines from the underlying stellar absorption.
Using this approach, we are able to constrain stellar metallicity and light-weighted age to within dex for the majority of the galaxies in the sample. Our stellar-mass estimates, determined within less than dex for the whole sample, are in good agreement with those derived by Kauffmann et al. (2003a). While the uncertainties on the stellar mass are almost independent of galaxy type, we find that, as expected, the smallest errors on age and especially metallicity are obtained for galaxies with the strongest absorption lines.
The estimates we derive of galaxy parameters are affected by limitations of both model and observed spectra. For example, the models do not include the effects of variations in heavy-element abundance ratios, while systematic deviations from the solar abundance ratios are known to arise in external galaxies (e.g. Worthey et al., 1992). When estimating metallicity, we therefore consider only those spectral features that have been shown by previous studies to depend negligibly on /Fe abundance ratio (Trager et al., 2000; Thomas et al., 2003b; Tantalo & Chiosi, 2004). The inclusion of higher-order Balmer lines, which may depend on element abundance ratio at high metallicities (Thomas et al., 2004), could lead to an overestimate of the metallicity and an underestimate of the age by 0.05 dex for galaxies with non-solar abundance ratios in our sample. Another systematic uncertainty in our metallicity and age estimates comes from the discrepancy between integrated colours and spectral index strengths for supra-solar metallicity models (the model spectral indices correspond to lower metallicities than the colours). Therefore, we expect metallicities inferred using these models to be biased toward high values at high metallicities. This problem mainly affects massive, early-type galaxies with strong absorption lines.
We have shown that, in addition to these model uncertainties, the signal-to-noise ratio in a galaxy spectrum strongly affects our estimates of age and especially metallicity. We choose to rely primarily on results for galaxies with median S/N per pixel greater than 20. This cut reduces the original sample by about 75 percent and biases our analysis toward high surface brightness, high concentration galaxies. Our main results appear unaffected by this cut in S/N; including lower-S/N galaxies mainly increases the scatter in the relations we find, because of the larger associated uncertainties on metallicity.
Another observational limitation is the small aperture sampled by the SDSS spectra. The fraction of light collected by an SDSS fibre depends on the apparent size of the target galaxy, and this fraction is less than 30 percent for most galaxies in our sample. The stellar mass we derive from the spectrum has been scaled to the total luminosity of the galaxy, and hence, it represents the total stellar mass of that galaxy. However, the age and the metallicity derived from the fibre spectrum cannot be easily extrapolated to total values without information about radial gradients. We have shown that these two parameters vary weakly as a function of the fraction of light entering the fibre. This reassures us that aperture bias does not have a major effect on the relations between metallicity, age and stellar mass that we derive.
We have explored how galaxies are distributed in metallicity, age and stellar mass in the diagram defined by 4000-Å break and Balmer-line strength. As shown by Kauffmann et al. (2003a) the principal sequence in this plane reflects an increase in present to past-averaged star formation rate with decreasing (see also Brinchmann et al., 2004). Galaxies with particularly strong Balmer absorption at given have undergone recent starbursts. By including metallicity dependence in the modelling, we have shown that:
-
•
In this diagram, the average stellar mass increases along the sequence populated by galaxies in our sample, from less than to more than from end to end of the sequence. The transition at intermediate is smooth between the two regimes. These results are in agreement with those of Kauffmann et al. (2003b).
-
•
Both stellar metallicity and light-weighted age also increase with . Galaxies with particularly strong Balmer absorption at intermediate 4000-Å breaks () are on average younger and more metal-rich than the bulk of the sequence. This supports the idea that these galaxies may have recently undergone a burst of metal-enriched star formation.
In addition, we have constructed the conditional distributions of metallicity and age estimates as a function of stellar mass. This analysis shows that:
-
•
Both stellar metallicity and light-weighted age increase with stellar mass, the increase being rapid at intermediate masses. At masses above , a gradual flattening occurs in both relations. This stellar mass corresponds to the transition mass identified by Kauffmann et al. (2003b) in plots of , surface mass density and concentration against stellar mass.
-
•
Despite the above clear relations, metallicity and age are not uniquely determined by mass; there is an intrinsic scatter in both relations, which is largest at stellar masses around . This scatter persists even when considering low- and high-concentration galaxies separately.
-
•
The relation we find between stellar metallicity and stellar mass is similar to that found by Tremonti et al. (2004) between gas-phase oxygen abundance and stellar mass. We confirm that higher stellar metallicities are indeed associated with higher gas-phase metallicities. However, the relation between stellar and gas-phase metallicities has a substantial scatter, which can only partly be attributed to the uncertainties in stellar-metallicity estimates. This suggests that a simple ‘closed-box’ scenario is not sufficient to explain the relation, and that a variety of gas accretion/ejection histories may be required.
We have also explored relationships between metallicity, age and stellar mass for separate subsamples of high-concentration, early-type and low-concentration, late-type galaxies. The distribution in age-metallicity space in bins of stellar mass shows that (Figs 11 and 12):
-
•
Relations between stellar metallicity, age and stellar mass hold for both early- and late-type galaxies. However, the age range of the sample is less mass-dependent for early-type than for late-type galaxies.
-
•
At masses below , late-type galaxies are younger and more metal-poor than early-type galaxies. At masses above the metallicities and ages of late-type galaxies are similar to those of early-type galaxies.
The above results indicate that young, metal-poor stellar populations are found predominantly in low-mass galaxies. This is consistent with a ‘downsizing’ scenario, in which the mass and luminosity of the galaxies undergoing active star formation become progressively lower as the Universe becomes older (Cowie et al., 1996). Taken at face value, this would imply that the low metallicities of low-mass galaxies just reflect the fact that these galaxies have had less time to produce metals. This naive conclusion is not consistent with that of Tremonti et al. (2004), who showed that the effective yields (from indirect gas-mass fraction measurements) of low-mass, star-forming galaxies in the SDSS DR2 are too low for these galaxies to be interpreted as young closed-box systems. This led Tremonti et al. (2004) to favor galatic winds as the most likely origin of the relation between gas-phase metallicity and stellar mass. This interpretation is supported here by the fact that galaxies with no H emission in our sample (which have presumably completed their star formation) also show a trend of decreasing stellar metallicity with decreasing stellar mass for (the metallicity of closed-box galaxies should tend to the yield near gas exhaustion, independently of mass). The large scatter present in all relations between stellar metallicity, age and stellar mass (even when separated into late-type and early-type galaxies) further indicates that stellar mass is not the unique parameter determining the star formation history and hence the physical parameters of present-day galaxies. Additional variations in star formation and enrichment history (e.g. driven by gas infall or outflow) are required to explain these parameters.
An advantage of the large samples available from the SDSS is that they allow us to study not only the mean relations between physical parameters of galaxies, but also the dependence of these parameters on various galaxy properties. Our results are particularly useful for studying the physical origin of well-known observed relations, such as for example the colour-magnitude relation and the relation between -index strength and velocity dispersion for early-type galaxies. Our analysis also enables us to estimate the total metal content of the local Universe and the distribution of these metals over different galaxy types. We will address these questions in forthcoming papers.
A complete census of the physical parameters of galaxies out to is essential for constraining models of the star formation and chemical enrichment histories of galaxies. The application of our method to large samples of galaxies at higher redshifts will enable us to study how the distribution of the physical parameters of galaxies evolves with lookback time. Ongoing deep redshift surveys, such as VVDS (Le Fèvre et al., 2004) and DEEP2 (Davis et al., 2003) in the optical and GALEX in the ultraviolet (Martin et al., 2004), are already assembling large samples of high-redshift galaxies. Quantitative comparison with the SDSS samples should substantially deepen our understanding of galaxy evolution.
Acknowledgments
We thank Guinevere Kauffmann and an anonymous referee for useful comments. A.G. thanks Stefano Zibetti and Gabriella De Lucia for useful discussions. A.G. and S.C. thank the Alexander von Humboldt Foundation, the Federal Ministry of Education and Research, and the Programme for Investment in the Future (ZIP) of the German Government for funding through a Sofja Kovalevskaja award. J.B. acknowledges the support of an ESA post-doctoral fellowship.
Funding for the creation and distribution of the SDSS Archive has been provided by the Alfred P. Sloan Foundation, the Participating Institutions, the National Aeronautics and Space Administration, the National Science Foundation, the US Department of Energy, the Japanese Monbukagakusho, and the Max Planck Society. The SDSS Web site is http://www.sdss.org/. The Participating Institutions are the University of Chicago, Fermilab, the Institute for Advanced Study, the Japan Participation Group, the Johns Hopkins University, the Max Planck Institute for Astronomy (MPIA), the Max Planck Institute for Astrophysics (MPA), New Mexico State University, Princeton University, the United States Naval Observatory, and the University of Washington.
References
- Abazajian et al. (2004) Abazajian K., et al. 2004, AJ, 128, 502
- Allende Prieto et al. (2001) Allende Prieto C., Lambert D. L., Asplund M., 2001, ApJ, 556, L63
- Baldry et al. (2004) Baldry I. K., Glazebrook K., Brinkmann J., Ivezić Ž., Lupton R. H., Nichol R. C., Szalay A. S., 2004, ApJ, 600, 681
- Balogh et al. (1999) Balogh M. L., Morris S. L., Yee H. K. C., Carlberg R. G., Ellingson E., 1999, ApJ, 527, 54
- Bell & de Jong (2000) Bell E. F., de Jong R. S., 2000, MNRAS, 312, 497
- Bernardi et al. (1998) Bernardi M., Renzini A., da Costa L. N., Wegner G., Alonso M. V., Pellegrini P. S., Rité C., Willmer C. N. A., 1998, ApJ, 508, L143
- Bressan et al. (1994) Bressan A., Chiosi C., Fagotto F., 1994, ApJS, 94, 63
- Brinchmann et al. (2004) Brinchmann J., Charlot S., White S. D. M., Tremonti C., Kauffmann G., Heckman T., Brinkmann J., 2004, MNRAS, 351, 1151
- Bruzual & Charlot (2003) Bruzual G., Charlot S., 2003, MNRAS, 344, 1000
- Bruzual A. (1983) Bruzual A. G., 1983, ApJ, 273, 105
- Bruzual A. & Charlot (1993) Bruzual A. G., Charlot S., 1993, ApJ, 405, 538
- Burstein et al. (1984) Burstein D., Faber S. M., Gaskell C. M., Krumm N., 1984, ApJ, 287, 586
- Caldwell & Rose (1998) Caldwell N., Rose J. A., 1998, AJ, 115, 1423
- Charlot & Fall (2000) Charlot S., Fall S. M., 2000, ApJ, 539, 718
- Colless et al. (1999) Colless M., et al 1999, MNRAS, 303, 813
- Cowie et al. (1996) Cowie L. L., Songaila A., Hu E. M., Cohen J. G., 1996, AJ, 112, 839
- Davies et al. (1993) Davies R. L., Sadler E. M., Peletier R. F., 1993, MNRAS, 262, 650
- Davis et al. (2003) Davis M., et al. 2003, in Discoveries and Research Prospects from 6- to 10-Meter-Class Telescopes II. Edited by Guhathakurta, Puragra. Proceedings of the SPIE, Volume 4834, pp. 161-172 (2003). Science Objectives and Early Results of the DEEP2 Redshift Survey. pp 161–172
- Eisenstein et al. (2003) Eisenstein D. J., et al. 2003, ApJ, 585, 694
- Faber (1973) Faber S. M., 1973, ApJ, 179, 731
- Ferreras et al. (1999) Ferreras I., Charlot S., Silk J., 1999, ApJ, 521, 81
- Fioc & Rocca-Volmerange (1997) Fioc M., Rocca-Volmerange B., 1997, A&A, 326, 950
- González (1993) González J. J., 1993, Ph.D. Thesis
- Gonzalez et al. (1993) Gonzalez J. J., Faber S. M., Worthey G., 1993, Bulletin of the American Astronomical Society, 25, 1355
- Gorgas et al. (1999) Gorgas J., Cardiel N., Pedraz S., González J. J., 1999, A&AS, 139, 29
- Gorgas et al. (1993) Gorgas J., Faber S. M., Burstein D., Gonzalez J. J., Courteau S., Prosser C., 1993, ApJS, 86, 153
- Goudfrooij et al. (1999) Goudfrooij P., Gorgas J., Jablonka P., 1999, Ap&SS, 269, 109
- Henry & Worthey (1999) Henry R. B. C., Worthey G., 1999, PASP, 111, 919
- Jablonka et al. (1996) Jablonka P., Martin P., Arimoto N., 1996, AJ, 112, 1415
- Jimenez et al. (2005) Jimenez R., Panter B., Heavens A. F., Verde L., 2005, MNRAS, 356, 495
- Jørgensen (1999) Jørgensen I., 1999, MNRAS, 306, 607
- Kannappan (2004) Kannappan S. J., 2004, ApJ, 611, L89
- Kauffmann et al. (2003a) Kauffmann G., et al. 2003a, MNRAS, 341, 33
- Kauffmann et al. (2003b) Kauffmann G., et al. 2003b, MNRAS, 341, 54
- Korn et al. (2005) Korn A. J., Maraston C., Thomas D., 2005, astro-ph/0504574
- Kuntschner (1998) Kuntschner H., 1998, Ph.D. Thesis
- Kuntschner (2000) Kuntschner H., 2000, MNRAS, 315, 184
- Kuntschner (2004) Kuntschner H., 2004, A&A, 426, 737
- Kuntschner & Davies (1998) Kuntschner H., Davies R. L., 1998, MNRAS, 295, L29+
- Kuntschner et al. (2001) Kuntschner H., Lucey J. R., Smith R. J., Hudson M. J., Davies R. L., 2001, MNRAS, 323, 615
- Kuntschner et al. (2002) Kuntschner H., Smith R. J., Colless M., Davies R. L., Kaldare R., Vazdekis A., 2002, MNRAS, 337, 172
- Le Borgne et al. (2003) Le Borgne J.-F., Bruzual G., Pelló R., Lançon A., Rocca-Volmerange B., Sanahuja B., Schaerer D., Soubiran C., Vílchez-Gómez R., 2003, A&A, 402, 433
- Le Fèvre et al. (2004) Le Fèvre O., et al. 2004, A&A, 417, 839
- Longhetti et al. (1998) Longhetti M., Rampazzo R., Bressan A., Chiosi C., 1998, A&AS, 130, 251
- MacArthur et al. (2004) MacArthur L. A., Courteau S., Bell E., Holtzman J. A., 2004, ApJS, 152, 175
- Maraston (1998) Maraston C., 1998, MNRAS, 300, 872
- Martin et al. (2004) Martin C. D., et al. 2004, astro-ph/0411302
- Mehlert et al. (2003) Mehlert D., Thomas D., Saglia R. P., Bender R., Wegner G., 2003, A&A, 407, 423
- Poggianti et al. (2001) Poggianti B. M., Bridges T. J., Carter D., Mobasher B., Doi M., Iye M., Kashikawa N., Komiyama Y., Okamura S., Sekiguchi M., Shimasaku K., Yagi M., Yasuda N., 2001, ApJ, 563, 118
- Poggianti et al. (2001) Poggianti B. M., Bridges T. J., Mobasher B., Carter D., Doi M., Iye M., Kashikawa N., Komiyama Y., Okamura S., Sekiguchi M., Shimasaku K., Yagi M., Yasuda N., 2001, ApJ, 562, 689
- Proctor & Sansom (2002) Proctor R. N., Sansom A. E., 2002, MNRAS, 333, 517
- Rakos et al. (2001) Rakos K., Schombert J., Maitzen H. M., Prugovecki S., Odell A., 2001, AJ, 121, 1974
- Saglia et al. (2000) Saglia R. P., Maraston C., Greggio L., Bender R., Ziegler B., 2000, A&A, 360, 911
- Salim et al. (2005) Salim S., et al. 2005, ApJ, 619, L39
- Schlegel et al. (1998) Schlegel D. J., Finkbeiner D. P., Davis M., 1998, ApJ, 500, 525
- Shen et al. (2003) Shen S., et al. 2003, MNRAS, 343, 978
- Shimasaku et al. (2001) Shimasaku K., et al. 2001, AJ, 122, 1238
- Stoughton et al. (2002) Stoughton C., et al. 2002, AJ, 123, 485
- Strateva et al. (2001) Strateva I., et al. 2001, AJ, 122, 1861
- Tantalo & Chiosi (2004) Tantalo R., Chiosi C., 2004, MNRAS, 353, 917
- Tantalo et al. (1998) Tantalo R., Chiosi C., Bressan A., 1998, A&A, 333, 419
- Terlevich & Forbes (2002) Terlevich A. I., Forbes D. A., 2002, MNRAS, 330, 547
- Terlevich et al. (1999) Terlevich A. I., Kuntschner H., Bower R. G., Caldwell N., Sharples R. M., 1999, MNRAS, 310, 445
- Thomas et al. (2003a) Thomas D., Maraston C., Bender R., 2003a, MNRAS, 343, 279
- Thomas et al. (2003b) Thomas D., Maraston C., Bender R., 2003b, MNRAS, 339, 897
- Thomas et al. (2005) Thomas D., Maraston C., Bender R., de Oliveira C. M., 2005, ApJ, 621, 673
- Thomas et al. (2004) Thomas D., Maraston C., Korn A., 2004, MNRAS, 351, L19
- Tinsley (1978) Tinsley B. M., 1978, ApJ, 222, 14
- Tinsley (1980) Tinsley B. M., 1980, Fundamentals of Cosmic Physics, 5, 287
- Trager et al. (2000) Trager S. C., Faber S. M., Worthey G., González J. J., 2000, AJ, 120, 165
- Trager et al. (1998) Trager S. C., Worthey G., Faber S. M., Burstein D., Gonzalez J. J., 1998, ApJS, 116, 1
- Tremonti (2003) Tremonti C. A., 2003, Ph.D. Thesis
- Tremonti et al. (2004) Tremonti C. A., et al. 2004, ApJ, 613, 898
- Tripicco & Bell (1995) Tripicco M. J., Bell R. A., 1995, AJ, 110, 3035
- Vazdekis (1999) Vazdekis A., 1999, ApJ, 513, 224
- Vazdekis (2001) Vazdekis A., 2001, Ap&SS, 276, 921
- Worthey (1994) Worthey G., 1994, ApJS, 95, 107
- Worthey (1996) Worthey G., 1996, in ASP Conf. Ser. 98: From Stars to Galaxies: the Impact of Stellar Physics on Galaxy Evolution Elliptical Galaxies: Abundance Ratio Trends and Implications. pp 467–+
- Worthey (1997) Worthey G., 1997, in American Institute of Physics Conference Series Star Formation History of Elliptical Galaxies from Low-Redshift Evidence. pp 525–+
- Worthey et al. (1992) Worthey G., Faber S. M., Gonzalez J. J., 1992, ApJ, 398, 69
- Worthey et al. (1994) Worthey G., Faber S. M., Gonzalez J. J., Burstein D., 1994, ApJS, 94, 687
- Worthey & Ottaviani (1997) Worthey G., Ottaviani D. L., 1997, ApJS, 111, 377
- Worthey et al. (1995) Worthey G., Trager S. C., Faber S. M., 1995, in ASP Conf. Ser. 86: Fresh Views of Elliptical Galaxies The Galaxian Age-Metallicity Relation. pp 203–+
- Wu et al. (2004) Wu H., Shao Z., Mo H. J., Xia X., Deng Z., 2004, astro-ph/0404226
- York et al. (2000) York D. G., et al. 2000, AJ, 120, 1579