A new intermediate mass protostar in the Cepheus A HW2 region
Abstract
We present the discovery of the first molecular hot core associated with an intermediate mass protostar in the Cep A HW2 region. The hot condensation was detected from single dish and interferometric observations of several high excitation rotational lines (from 100 to 880 K above the ground state) of SO2 in the ground vibrational state and of HC3N in the vibrationally excited states v7=1 and v7=2. The kinetic temperature derived from both molecules is 160 K. The high–angular resolution observations (1.25′′0.99′′) of the SO2 line (488 K above the ground state) show that the hot gas is concentrated in a compact condensation with a size of 0.6′′ (430 AU), located 0.4′′ (300 AU) east from the radio–jet HW2. The total SO2 column density in the hot condensation is 1018cm-2, with a H2 column density ranging from 1023 to 61024 cm-2. The H2 density and the SO2 fractional abundance must be larger than 107 cm-3 and 210-7 respectively. The most likely alternatives for the nature of the hot and very dense condensation are discussed. From the large column densities of hot gas, the detection of the HC3N vibrationally excited lines and the large SO2 abundance, we favor the interpretation of a hot core heated by an intermediate mass protostar of 103 L⊙. This indicates that the Cep A HW2 region contains a cluster of very young stars.
Subject headings:
ISM: individual (Cepheus A) — ISM: molecules — stars: formation1. Introduction
While the general scenario of low mass star formation is reasonably well understood, the formation of massive stars is still poorly known (see e.g. McKee & Tan 2003). Hot cores represent one of the earliest phases in massive star formation accretion (Garay & Lizano 1999). They are compact condensations (0.1 pc) with high densities (106 cm-3), high kinetic temperatures (100 K) and a very rich chemistry. The abundances of sulfur–bearing molecules like SO2, are expected to be enhanced in hot cores by several orders of magnitude with respect to the quiescent gas (Charnley 1997). So far, these hot cores have been mainly detected in objects whose luminosities are larger than 104 L⊙ (Garay & Lizano 1999).
Cepheus A (CepA), with a total IR luminosity of 2104 L⊙, is a very active region of massive star formation. It contains sixteen ultracompact H II regions, molecular outflows and water vapor masers (e.g. Hughes & Wouterloot 1984; Rodríguez, Moran, & Ho 1980; Torrelles et al. 1996; Garay et al. 1996). The main powering source in the region is believed to be the thermal radio–jet, known as HW2, which is the brightest of the radio continuum sources in the region (Rodríguez et al. 1994; Garay et al. 1996). The surroundings of HW2 show a rather complex structure. The morphology of the HW2 radio–jet suggests the presence of a disk of neutral gas whose size is unknown. Torrelles et al. (1996) reported evidence for water masers in a rotating and collapsing disk around the radio–jet. However, the warm molecular gas (about 50 K) around HW2 shows a ring like structure with complex kinematics which does not seem to be consistent with a simple rotating disk (Torrelles et al. 1999).
In addition to the expected neutral disk, within a few hundred AU of the radio–jet, there is clear evidence for very recent star formation. Two radio continuum sources detected by Curiel et al. (2002), one of them claimed to be the source of the expanding bubble found in H2O masers (Torrelles et al. 2001), are very likely protostars. Furthermore, the multiple outflow activity (Hayashi, Hasegawa, & Kaifu 1988; Narayanan & Walker 1996) seems to be powered by three different young stellar objects in the surroundings of HW2 (Codella et al. 2003). Two of these sources have not been yet identified.
In this letter, we report the detection of a hot (160 K), very dense (107 cm-3) compact (0.6′′; 430 AU) condensation located 0.4′′ (300 AU) east from the radio–jet HW2. From the properties of the hot condensation and the large H2 column densities of hot gas, we conclude that this condensation is likely a hot core associated with an intermediate mass star with a luminosity of 103 L⊙ which could be the driving source of one of the molecular outflows observed in the CepA region.
2. Observations & Results
The observations of the high excitation SO2 rotational lines and of the HC3N vibrationally excited lines (hereafter HC3N∗) in Tab. 1 were made with the IRAM111The Institute for Radio Astronomy at Millimeter wavelengths (IRAM) is supported jointly by the German Max–Planck–Society, the French Centre National de Recherche Scientifique (CNRS) and the Spanish Instituto Geográfico Nacional. 30 m telescope at Pico Veleta (Spain). The lines were observed with the 1.3, 2 and 3 mm SIS receivers simultaneously. The half power beam width (HPBW) of the telescope ranged from 14′′ to 25′′. The receivers were tuned to single side band with image rejections larger than 10 dB. The system temperatures of the 1.3, 2 and 3 mm receivers were, respectively, 450, 310 and 170 K. As spectrometers, we used the VESPA autocorrelator, configured to provide velocity resolutions ranging from 0.037 to 3.3 km s-1. The line intensities were converted to main brightness temperatures using the beam efficiencies of 0.55, 0.69 and 0.77 for the 1.3, 2 and 3 mm lines respectively.
The SO2 line (489 K above the ground state) was also observed with high angular resolution using the IRAM Plateau de Bure Interferometer –PdBI– (France) in the A and B configurations. The 3 mm receiver was tuned to double side band. The HPBW of the synthesized beam was 1.25′′0.99′′, PA=–25∘. The correlator was configured to cover 145 MHz (439 km s-1) with a spectral resolution of 625 KHz (1.89 km s-1). CRL618 (1.73 Jy) and MWC349 (1.03 Jy) were used as flux density calibrators. The total observing time on–source was about 7 hours.
Fig. 1 shows the SO2 and HC3N∗ line profiles observed with the 30 m telescope and the PdBI toward CepA HW2, and Tab. 1 gives the line parameters obtained by fitting Gaussian profiles. Our and SO2 lines are in agreement with those of Codella et al. (2003). The SO2 line will be not used in our analysis since it is easily excited and mainly arises from the extended molecular outflow. Like most of the low excitation lines of many molecules (Martín–Pintado, Bachiller, & Fuente 1992; Bergin et al. 1997; Codella et al. 2003), all of the high excitation lines of SO2 and HC3N∗ peak around –10 km s-1. The SO2 lines also show a slightly asymmetric profile with a weak redshifted wing. This asymmetry is probably associated with the high velocity shocks observed in SO2 (Codella et al. 2003).
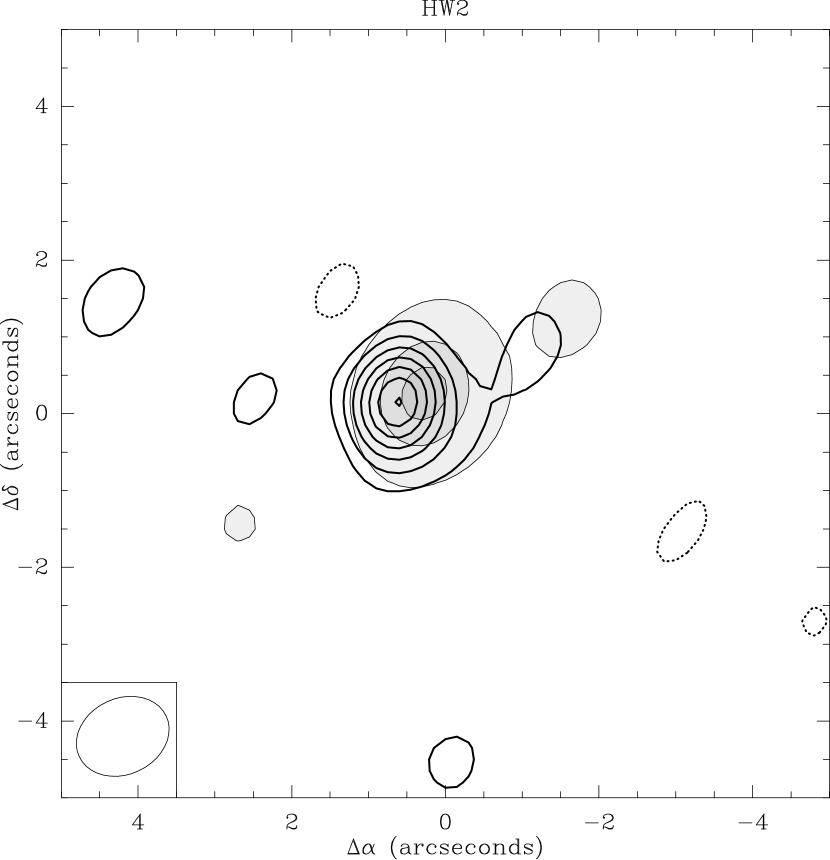
Fig. 2 shows the high angular resolution PdBI images of the continuum emission (thin solid contours and grey map) and of the SO2 line intensity at –10 km s-1 (thick solid contours). The continuum emission is unresolved in our beam with a peak continuum intensity of 110 15 mJy, in agreement with those previously measured by Mehringer, Zhou, & Dickel (1997) and Gómez et al. (1999), and consistent with the continuum emission arising from the HW2 radio–jet. For all radial velocities, the SO2 line emission is also spatially unresolved, indicating that the highly excited gas is very compact with a size of 0.6′′ (430 AU). The unresolved SO2 condensation contains most of the flux (70%) measured with the 30 m telescope. As shown in Fig. 2, the SO2 emission is located 0.4′′ east from the radio–jet. This is consistent with the warm NH3 emission observed in the (3,3) line by Torrelles et al. (1999).
3. Properties of the compact molecular condensation
Tab. 2 summarizes the properties of the compact molecular condensation. Fig. 3 shows the population diagrams (see e.g. Goldsmith & Langer 1999) derived for SO2 and HC3N∗. The level populations of both molecules can be fitted by straight lines with similar excitation temperatures of 150–160 K, indicating the presence of a hot condensation (hereafter HC). We have constrained the size of the HC by using the upper limit to the size measured from the interferometric maps of 0.6′′, and the lower limit of 0.3′′ derived from the measured main beam brightness temperature of the SO2 line and the excitation temperature of 160 K. In the following discussion, we will consider a size of 0.6′′ (430 AU) for the HC. The derived excitation temperature from the HC3N∗ transitions is unlikely affected by optical depth effects since the observed lines are weaker than those expected from a source of 0.6′′ and optically thick emission with an excitation temperature of 160 K.
Combining the column density derived from the PdBI data of the SO2 line (see Table 1) with the estimated source size of 0.6′′ and the excitation temperature of 160 K, we derive a total SO2 column density for the HC of 1018 cm-2. Although the H2 column density of the HC is unknown, it can be constrained between and cm-2. The upper limit of cm-2 is derived from our 3 mm continuum intensity of 30 mJy measured at the location of the HC, and by assuming that it arises from dust at a temperature of 160 K. The lower limit is obtained by assuming the extreme case that 50% of the cosmic sulfur abundance is in SO2. Assuming spherical symmetry, the H2 densities in the HC range between 107 and 6108 cm-3. Hereafter (see Tab. 2), we will consider the intermediate case for a H2 column density of 1024 cm-2 (i.e. a SO2 abundance of 10-6). In this case, the H2 density and the mass of the HC will be 108 cm-3 and 410-2M respectively. The kinetic temperature, (Tkin), of the HC is unknown, but it must be equal or larger than the derived excitation temperature of 160 K. For the high density (107 cm-3) derived for the HC, the SO2 transitions are thermalized and the excitation temperature should be a direct measurement of the kinetic temperature. Furthermore the dust and gas must be also closely coupled and the dust temperature should be equal to the gas kinetic temperature. Since the HC is optically thick in the mid–IR, we estimate a bolometric luminosity of 103 L⊙ by assuming that it emits like a black body at 160 K.
In summary, we have detected a warm (160 K), very dense (107 cm-3) and compact condensation (size 400 AU) located 300 AU east from the radio–jet HW2. The HC has a total mass of 410-2 M⊙, a luminosity of 103 L⊙ and a very large abundance (210-7) of SO2.
4. The nature of the hot condensation. A hot core
In view of the complexity of the region in the vicinity of HW2, we discuss the two most likely possibilities for the nature of the HC. The first one consists of a hot and dense spot in the expected circumstellar disk around the radio–jet. In the disk scenario, the large H2 column density (1024 cm-2) of hot gas (160 K) in the HC could be externally heated by the IR radiation from HW2 or by the shocks produced by the stellar wind of HW2. For the projected distance between HW2 and the HC, external heating by radiation would require the IR luminosity of HW2 to be few 105 L (Fig. 7 of Kaufman, Hollenbach, & Tielens 1998), which is at least one order of magnitude larger than that measured in the whole region of 2104 L. Shock heating would require collisional excitation of the v7=1 and 2 vibrationally levels of HC3N and the conversion of 10% of the total bolometric luminosity in the region into mechanical luminosity. Collisional excitation of the vibrational levels of HC3N is possible since the H2 densities estimated for the HC are close to the critical densities of 2108 cm-3 (Goldsmith et al. 1982). Shocks should then provide a mechanical luminosity of 103L in a region of only 400 AU. This is very unlikely since the total mechanical luminosity in the large scale outflow powered by HW2 is only 30 L (Narayanan & Walker 1996), nearly two orders of magnitude smaller than the mechanical luminosity required to heat the HC.
The second possibility is that we are observing a hot core internally heated. This option will explain the presence of the vibrationally excited emission which in hot cores is usually produced by IR radiation (see e.g. de Vicente et al. 2000). The luminosity and the mass of the hot core in HW2 will be more than one order of magnitude smaller than those reported for hot cores associated with massive stars. Then, the HC will be the first hot core associated with an intermediate mass star. The luminosity of the hot core would require a main sequence B5 star. Large SO2 abundance (10-7) seems to be a general property of hot cores associated with massive protostars (Keane et al. 2001). Our lower limit to the SO2 abundance of 210-7 suggests that intermediate mass hot cores have similar sulfur chemistry than those associated with massive protostars. The derived HC3N abundance in the HC of 10-8, is also in agreement with the abundances measured in hot cores associated with massive stars (de Vicente et al. 2000). It has been proposed that the large abundance of sulfur–bearing molecules can be driven by fast gas phase reactions after the evaporation from grain mantles of key molecules like H2S (Charnley 1997), OCS (van der Tak et al. 2003; Martín et al. 2005) and SO (Jimenez–Serra et al. 2005) or atomic sulfur (Wakelam et al. 2004). From the available data on other sulfur–bearing molecules, SO2 seems to be the most abundant species in the HC. We can set upper limits to the abundance of other sulfur–bearing molecules and of atomic sulfur by assuming that all their emissions observed with beams of 10–30′′, are optically thin and arise from the hot core. From the H2S, SO and [S I] 25.2m observations of Codella et al. (2003), Martín–Pintado et al. (1992) and Wright et al. (1996) respectively, we derive column densities for the three species of 1–21017cm-2. Their corresponding abundances are 10-8, at least one order of magnitude smaller than the SO2 abundance. Viti et al. (2004) have performed model calculations to follow the sulfur chemistry evolution from the collapse phase to the hot core stage using new experimental data on desorption temperatures for mixed ices. The model predicts that an intermediate mass star of 5 M in the hot core phase will evaporate H2S from the grain mantles, and after few 105 years, will produce SO2 in gas phase with abundances similar to that observed in the intermediate mass hot core in HW2.
The discovery reported in this letter of an intermediate mass protostar, and the recent detection of two embedded young stellar objects (Curiel et al. 2002) within 500 AU of HW2, support the scenario of the formation of a cluster of stars. The new protostar in the HW2 region is an excellent candidate for powering one of the three molecular outflows observed in the region (Codella et al. 2003). If the relationship found between the mechanical luminosity of the molecular outflows and the luminosity of their exciting sources (Shepherd & Churchwell 1996) holds for the outflows in the CepA region, the new protostar will be luminous enough to power the east outflow (Hayashi et al. 1988). However, high angular resolution observations of these outflows are needed to confirm if the new protostar is the driving source of one of the multiple outflows found in this region.
In summary, we have detected a hot and dense condensation in the vicinity of the radio–jet HW2 in the CepA region. From the properties of the hot condensation, we suggest that it is a hot core heated by an intermediate mass protostar. This protostar could be the driving source of one of the observed multiple molecular outflows. The detection of a new protostar in the vicinity of HW2 supports the idea of the formation of a cluster of massive and intermediate stars in the CepA region.
References
- Bergin et al. (1997) Bergin, E. A., Ungerechts, H., Goldsmith, P. F., Snell, R. L., Irvine, W. M., Schloerb, F. P. 1997, ApJ, 482, 267
- Charnley (1997) Charnley, S. B. 1997, ApJ, 481, 396
- Codella et al. (2003) Codella, C., Bachiller, R., Benedettini, M., & Caselli, P. 2003, MNRAS, 341, 707
- Curiel et al. (2002) Curiel, S. et al. 2002, ApJ, 564, L35
- de Vicente et al. (2000) de Vicente, P., Martín–Pintado, J., Neri, R., & Colom, P. 2000, A&A, 361, 1058
- Garay et al. (1996) Garay, G., Ramírez, S., Rodríguez, L. F., Curiel, S., & Torrelles, J. M. 1996, ApJ, 459, 193
- Garay & Lizano (1999) Garay, G. & Lizano, S. 1999, PASP, 111, 1049
- Goldsmith et al. (1982) Goldsmith, P. F., Snell, R. L., Deguchi, S., Krotkov, R., & Linke, R. A. 1982, ApJ, 260, 147
- Goldsmith & Langer (1999) Goldsmith, P. F. & Langer, W. D. 1999, ApJ, 517, 209
- Gómez et al. (1999) Gómez, J. F., Sargent, A. I., Torrelles, J. M., Ho, P. T. P., Rodríguez, L. F., Cantó, J., & Garay, G. 1999, ApJ, 514, 287
- Hayashi et al. (1988) Hayashi, S. S., Hasegawa, T., & Kaifu, N. 1988, ApJ, 332, 354
- Hughes & Wouterloot (1984) Hughes, V. A. & Wouterloot, J. G. A. 1984, ApJ, 276, 204
- Jimenez–Serra et al. (2005) Jimenez–Serra, I., Martín–Pintado, J. Rodríguez–Franco, A., & Martín, S. 2005, submitted
- Kaufman et al. (1998) Kaufman, M. J., Hollenbach, D. J., & Tielens, A. G. G. M. 1998, ApJ, 497, 276
- Keane et al. (2001) Keane, J. V., Tielens, A. G. G. M., Boogert, A. C. A., Schutte, W. A., & Whittet, D. C. B. 2001, A&A, 376, 254
- Martín et al. (2005) Martín, S., Martín–Pintado, J., Mauersberger, R., Henkel, C., & García–Burillo, S. 2005, ApJ, 620, 210
- Martín–Pintado et al. (1992) Martín–Pintado, J., Bachiller, R., & Fuente, A. 1992, A&A, 254, 315
- McKee & Tan (2003) McKee, C. F. & Tan, J. C. 2003, ApJ, 585, 850
- Mehringer et al. (1997) Mehringer, D. M., Zhou, S., & Dickel, H. R. 1997, ApJ, 475, L57
- Narayanan & Walker (1996) Narayanan, G., & Walker, C. K. 1996, ApJ, 466, 844
- Rodríguez, Moran, & Ho (1980) Rodríguez, L. F., Moran, J. M., & Ho, P. T. P. 1980, ApJ, 240, L149
- Rodríguez et al. (1994) Rodríguez, L. F., Garay, G., Curiel, S., Ramírez, S., Torrelles, J. M., Gómez, Y., & Velázquez, A. 1994, ApJ, 430, L65
- Shepherd & Churchwell (1996) Shepherd, D. S., & Churchwell, E. 1996, ApJ, 472, 225
- Torrelles et al. (1996) Torrelles, J. M., Gómez, J. F., Rodríguez, L. F., Curiel, S., Ho, P. T. P., & Garay, G. 1996, ApJ, 457, L107
- Torrelles et al. (1999) Torrelles, J. M., Gómez, J. F., Garay, G., Rodríguez, L. F., Miranda, L. F., Curiel, S., & Ho, P. T. P. 1999, MNRAS, 307, 58
- Torrelles et al. (2001) Torrelles, J. M., et al. 2001, Nature, 411, 277
- van der Tak et al. (2003) van der Tak, F. F. S., Boonman, A. M. S., Braakman, R., & van Dishoeck, E. F. 2003,A&A, 412, 133
- Viti et al. (2004) Viti, S., Collings, M. P., Dever, J. W., McCoustra, M. R. S., & Williams, D. A. 2004, MNRAS, 354, 1141
- Wakelam et al. (2004) Wakelam, V., Caselli, P., Ceccarelli, C., Herbst, E., & Castets, A. 2004, A&A, 422, 159
- Wright et al. (1996) Wright, C. M., Drapatz, S., Timmermann, R., van der Werf, P. P., Katterloher, R., & de Graauw, T. 1996, A&A, 315, L301


| Line | VLSRaaThe 1 errors from the gaussfits are shown in parenthesis. | aaThe 1 errors from the gaussfits are shown in parenthesis. | TmbaaThe 1 errors from the gaussfits are shown in parenthesis. | |
|---|---|---|---|---|
| (km s-1) | (km s-1) | (K) | (1011 cm-2) | |
| SO2 | ||||
| -9.7 (1) | 7.9 (4) | 0.144 (3) | 80.4 | |
| -9.6 (3) | 7.8 (6) | 0.100 (3) | 70.3 | |
| -10.0 (1) | 5.2 (3) | 8.8 (1) | 3628bbSO2 column density derived for a beam of 1.25′′0.99′′. | |
| -9.4 (5) | 6 (1) | 0.030 (4) | 15.4 | |
| -8.8 (4) | 7.8 (9) | 0.060 (4) | 30.0 | |
| HC3N | ||||
| -10.5 (5) | 4.8 (9) | 0.026 (6) | 0.36 | |
| -10.3 (5) | 5 (2) | 0.017 (4) | 0.27 | |
| -8.9 (5) | 4.3 (8) | 0.050 (3) | 0.57 | |
| -10.2 (5) | 7 (1) | 0.04 (1) | 0.33 | |
| -10.8 (4) | 3.4 (8) | 0.04 (1) | 0.18 | |
| Source | LocationaaOffset from the continuum peak at , derived from gaussian fits. | Size | Tkin | n | Column densitiesbbFor a source size of (UA) and a distance to the source of 725 pc. Column densities are in units of cm-2. | Luminosity | Mass | ||
|---|---|---|---|---|---|---|---|---|---|
| (′′) | (′′) | (K) | (cm-3) | SO2 | HC3N | H2ccSee text for details. | (L⊙) | (M⊙) | |
| HC | 0.3–0.6 | 160(10) | 1.5 | 11018 | 3 | 11024 | 1103 | 4 | |