The Origin of T Tauri X-ray Emission: New Insights from the Orion Ultradeep Project
Abstract
The Orion Ultradeep Project (COUP) provides the most comprehensive dataset ever acquired on the X-ray emission of pre-main sequence stars. In this paper, we study the nearly 600 X-ray sources that can be reliably identified with optically well characterized T Tauri stars (TTS) in the Orion Nebula Cluster. With a detection limit of erg/sec for lightly absorbed sources, we detect X-ray emission from more than 97% of the optically visible late-type (spectral types F to M) cluster stars. This proofs that there is no “X-ray quiet” population of late-type stars with suppressed magnetic activity. We use this exceptional optical, infrared, and X-ray data set to study the dependencies of the X-ray properties on other stellar parameters. All TTS with known rotation periods lie in the saturated or super-saturated regime of the relation between activity and Rossby numbers seen for main-sequence (MS) stars, but the TTS show a much larger scatter in X-ray activity than seen for the MS stars. Strong near-linear relations between X-ray luminosities, bolometric luminosities and mass are present. We also find that the fractional X-ray luminosity rises slowly with mass over the range. The plasma temperatures determined from the X-ray spectra of the TTS are much hotter than in MS stars, but seem to follow a general solar-stellar correlation between plasma temperature and activity level. The scatter about the relations between X-ray activity and stellar parameters is larger than the expected effects of X-ray variability, uncertainties in the variables, and unresolved binaries. This large scatter seems to be related to the influence of accretion on the X-ray emission. While the X-ray activity of the non-accreting TTS is consistent with that of rapidly rotating MS stars, the accreting stars are less X-ray active (by a factor of on average) and produce much less well defined correlations than the non-accretors. We discuss possible reasons for the suppression of X-ray emission by accretion and the implications of our findings on long-standing questions related to the origin of the X-ray emission from young stars, considering in particular the location of the X-ray emitting structures and inferences for pre-main-sequence magnetic dynamos.
1 Introduction
1.1 X-ray emission from young stellar objects
Young stellar objects (YSOs) in all evolutionary stages from class I protostars to ZAMS stars show highly elevated levels of X-ray activity (for recent reviews on the X-ray properties of YSOs and on stellar coronal astronomy in general see Feigelson & Montmerle 1999 and Favata & Micela 2003). X-ray observations of star forming regions allow to study the high energy processes in YSOs, which are of great importance for our understanding of the star formation process. For example, the X-ray emission from a YSO should photoionize its circumstellar material and thus influence accretion as well as outflow processes, both of which are thought to be based on the interaction of ionized material with magnetic fields. The X-ray emission from the central YSO is certainly an important, probably even the dominant factor in determining the ionization structure of protoplanetary disks, and has therefore a strong impact on processes like the formation of proto-planets (e.g. Glassgold, Feigelson & Montmerle, 2000; Matsumura & Pudritz, 2003).
The first discoveries of X-ray emission from T Tauri stars (TTS, low-mass pre-main sequence (PMS) stars) were made with the EINSTEIN X-ray observatory (e.g. Feigelson & DeCampli, 1981) and revealed a surprisingly strong X-ray activity, exceeding the solar levels by several orders of magnitude. The X-ray observations also revealed a new population of young stellar objects (Walter et al., 1988), the “weak-line T Tauri stars” (WTTS), which lack the classical optical signposts of youth, like strong H emission, of the previously known “classical T Tauri stars” (CTTS). The ROSAT observatory increased the number of observed star forming regions, and thereby the number of known X-ray emitting TTS, considerably (e.g. Feigelson et al., 1993; Casanova et al., 1995; Gagné et al., 1995; Neuhäuser et al., 1995; Preibisch, Zinnecker, & Herbig, 1996). The ROSAT All Sky Survey lead to the X-ray detection of extended populations of TTS in and around many star forming regions (e.g. Neuhäuser, 1997) and demonstrated that the stellar populations of star forming regions are considerably larger than suspected by earlier surveys based on classical youth indicators such as H emission. The ROSAT All Sky Survey was also well suited to study the X-ray properties in complete, volume limited samples of nearby field stars. An important result from such studies was that apparently all cool dwarf stars are surrounded by X-ray emitting coronae, with a minimum X-ray surface flux around erg/sec/cm2 Schmitt (1997). The ASCA satellite detected X-ray emission from numerous deeply embedded YSOs; due to its rather poor spatial resolution, however, the proper identification of the X-ray sources was often difficult.
While the X-ray missions of the last two decades provided important information about the X-ray properties of YSOs, there were also serious limitations. First, the typical samples of X-ray detected objects in young clusters and star forming regions contained hardly more than objects, too few to allow well founded statistical conclusions to be drawn. Second, a large fraction of the known cluster members (especially low-mass stars) remained undetected in X-rays, and any correlation studies had therefore to deal with large numbers of upper limits. Third, especially in dense clusters, the individual sources could often not be spatially resolved, and so the proper identification of the X-ray sources was difficult or impossible. Finally, only a relatively small number of individual young stars were bright enough in X-rays to allow their spectral and temporal X-ray properties to be studied in detail, and it is not clear whether these stars really are “typical” cases or perhaps peculiar objects.
With the advent of and XMM-Newton, the situation has improved substantially. Due to the large collecting areas of these observatories, their sensitivity is at least an order of magnitude better than that of earlier missions. Due to their wide energy band, extending from keV up to keV, they are very well suited to study the hard X-ray emission from highly obscured YSOs (e.g., Skinner et al., 2003). Furthermore, has a superb point spread function, providing a spatial resolution of better than ; this abolishes the usual identification problems in nearby star forming regions.
1.2 Open questions about the X-ray activity from TTS
We enunciate two basic, still unresolved questions concerning the origin of the elevated X-ray activity of TTS: Does the strong X-ray activity of TTS, with X-ray luminosities up to times and plasma temperatures up to times higher than seen in our Sun, originate from solar-like coronae? If so, are these coronae created and heated by solar-like (although strongly enhanced) magnetic dynamo processes, or are fundamentally different magnetic structures and heating mechanisms involved?
One main obstacle on the way towards an understanding of TTS X-ray activity is the fact that the solar corona has an extremely complex and dynamic structure with many different facets (e.g., Aschwanden et al., 2001); it is not clear to what degree comparisons and extrapolations from the solar to the stellar case make sense. A second problem is that even for the Sun, which can be studied in great detail at high spatial, temporal, and spectral resolution, the important question about the heating of the solar corona remains puzzling, even after 5 decades of intense research (e.g., Walsh & Ireland, 2003). The third problem is our lack of a sound understanding of the dynamo processes which are the ultimate origin of the magnetic activity in the Sun and in stars (e.g., Ossendrijver, 2003).
The X-ray activity of main-sequence (MS) stars is mainly determined by their rotation rate. The well established rotation–activity relation (e.g. Pallavicini et al., 1981; Pizzolato et al., 2003) is given by the power-law relation , in agreement with the expectations from solar-like dynamo models (e.g. Maggio et al., 1987). At periods shorter than 2-3 days, the activity saturates at for reasons that are not yet understood. The plasma temperatures generally increase with the level of X-ray activity, scaling roughly as (e.g. Preibisch, 1997). Most TTS rotate quite rapidly, and neither their X-ray luminosities nor their plasma temperatures are unusual when compared to rapidly rotating MS stars.
However, a relation between rotation and X-ray activity could never be convincingly established for TTS; in most studies the small number of X-ray detected TTS with known rotation periods did not allow to draw sound conclusions. This problem of small and often biased samples has, however, recently been overcome with two studies of the ONC (Feigelson et al., 2002a; Flaccomio et al., 2003b), both of which found no significant relation between X-ray activity and rotation. This strongly puts into question the solar-like dynamo activity scenario for TTS. Another argument against solar-like dynamos comes from theoretical considerations: at ages of only a few Myr, the TTS are usually thought to be fully convective, and therefore the standard solar-like dynamo, which is anchored at the boundary between the convective envelope and the inner radiative core, should not work. Theoreticians have developed alternative dynamo concepts (e.g., Küker & Rüdiger 1999; Giampapa et al. 1996) that may work in fully convective stars. A problem with these and other models is that they usually do not make quantitative predictions that can be easily tested from observations. Further possibilities for the origin of X-ray emission from TTS include magnetic fields coupling the stars to their surrounding circumstellar disk (see, e.g., Hayashi et al. 1996; Montmerle et al. 2000; Isobe et al., 2003; Romanova et al., 2004), or X-ray emission from accretion shocks (see, e.g., Kastner et al., 2002; Stelzer & Schmitt, 2004; Favata et al., 2003, 2005). The investigation of these possibilities in the light of the the Chandra Orion Ultradeep Project (COUP) (catalog ADS/Sa.CXO#obs/COUP) data will be a major topic of this study.
1.3 Properties of the ONC and previous X-ray observations
The Orion Nebula is an HII region on the near side of a giant molecular cloud, which contains one of the most prominent and nearby ( pc) star forming regions (for a recent review see O’Dell, 2001). This star forming region contains a massive cluster of young ( yr) stars (cf. Herbig & Terndrup, 1986; McCaughrean & Stauffer, 1994; Hillenbrand, 1997), which is known as the Orion Nebula Cluster (ONC). The Orion Nebula is illuminated mainly by the two O-type stars C and A. Since the ONC is a perfect laboratory for observations of star formation over the full stellar mass range, it is one of the best investigated star forming regions and has been observed at virtually any wavelength. Hillenbrand (1997) has compiled a catalog of nearly 1600 optically visible stars within pc of the Trapezium; for over 900 of these stars enough information is avaliable to place them into the HR-diagram and to determine their masses and ages by comparison with theoretical PMS evolution models.
The ONC has been observed with basically all previous X-ray observatories (see e.g. Ku & Chanan (1979) for EINSTEIN observations; Gagné et al. (1995); Geier et al. (1995); Alcalá et al. (1996) for ROSAT observations; Yamauchi et al. (1996) for ASCA observations). However, the high spatial density of stars in the ONC and the poor spatial resolution of these X-ray observatories did not allow a reliable identification of many X-ray sources. Only with its superb point spread function is suitable for studying the ONC, where the mean separation between the sources in the inner radius area is only . The ONC has been observed with both imaging instruments onboard of . The results of two ACIS-I observations with a combined exposure time of 23 hours were reported in Garmire et al. (2000) and Feigelson et al. (2002a, b, 2003). 1075 individual sources were detected, 91% of which could be identified with known stellar members of the cluster. Flaccomio et al. (2003a, b) presented the analysis of a 17.5 hr HRC-I observation of the ONC, which yielded 742 X-ray sources in the field-of-view. Furthermore, some of the brightest X-ray sources in the ONC have also been studied with the High Energy Transmission Grating Spectrometer (Schulz et al., 2000, 2001, 2003), but most of these sources are massive stars which are not the topic of this paper.
In this paper, we discuss the X-ray data on the TTS in the ONC resulting from COUP, by far the longest and most sensitive X-ray observation ever obtained for the ONC. The plan of this paper is as follows: after briefly describing the COUP observation in §2, we define in §3 the optical sample which will be the basis of our studies, and then investigate the relation of the X-ray emission to basic stellar parameters in §4. In §5 we study in detail the relation between X-ray emission, rotation and convection. In §6 we discuss the origin of the large scatter seen in the correlations between X-ray activity and other stellar parameters. In §7, we investigate the plasma temperatures as determined from the fits to the X-ray spectra. Section 8 deals with the possible connections between X-ray emission and circumstellar accretion disks. Finally, in §9 we discuss the implications of our results with respect to the origin of the TTS X-ray emission.
2 The COUP observation
The COUP observation is the deepest and longest X-ray observation ever made of a young stellar cluster, providing a rich and unique dataset for a wide range of science studies. The observational details and a complete description of the data analysis can be found in Getman et al. (2005a), here we summarize only the aspects that are most important to our studies. The COUP observation was performed between 8 Jan 2003 and 21 Jan 2003, utilizing the Advanced CCD Imaging Spectrometer (ACIS) in its imaging configuration, which gives a field of view of . The total exposure time of the COUP image was 838 100 sec (232.8 hours or 9.7 days). The spatial resolution of ACIS is better than over most of the field of view. The very low background allows the reliable detection of sources with as little as source counts. The final COUP source catalog lists 1616 individual sources. The superb point spread function and the high accuracy of the aspect solution allowed a clear and unambiguous identification of nearly all X-ray sources with optical or near-infrared counterparts111The median offsets between COUP sources and near-infrared or optical counterparts are only 0.15″and 0.24″, respectively.
Spectral analysis was performed using a semi-automated approach to produce an acceptable spectral model for as many as possible sources. The XSPEC spectral fitting programme was used to fit the extracted spectra with one- or two-temperature optically thin thermal plasma MEKAL models assuming 0.3 times solar abundances and X-ray absorption. The parameters derived in these fits are the hydrogen column density as a measure of the X-ray absorption, and the temperatures and emission measures of the one or two spectral components. The spectral fitting results were also used to compute the intrinsic (extinction-corrected) X-ray luminosity by integrating the model source flux over the keV band.
Our analysis in this paper is based on the tabulated X-ray properties and identifications of the COUP sources as listed in Getman et al. (2005a). We use the identifications of the X-ray sources with optical counterparts as given in their Table 9, the X-ray luminosities and X-ray spectral properties as listed in their Tables 8 and 6, and upper limits of undetected stars in the Hillenbrand sample as given in Table 11.
The temporal behavior of COUP sources is often very complex, with high-amplitude, rapidly changing flares superposed on apparent quiescent or slowly variable emission as studied in detail by Wolk et al. (2005), Favata et al. (2005) and Flaccomio et al. (2005). For the purpose of the present study, the individual features of the lightcurves are not of interest. We note that the X-ray properties tabulated in the COUP tables, i.e. the count rates, derived spectral parameters, and X-ray luminosities, represent the average over the 10 days exposure time of our dataset. This implies that the effect of short excursions in the X-ray lightcurves, like flares with typical timescales of a few hours, are strongly “smoothed out”. Since most of the young stars are rather fast rotators with periods of less than 10 days, the tabulated X-ray properties represent for these objects the average over at least one rotation period and therefore also smooth out possible rotational modulation.
Nevertheless, it would be interesting to establish the level of “quiescent” X-ray emission in the sources, i.e. the sustained, or “typical” level of X-ray emission outside the periods of flares or otherwise elevated activity. For this purpose, we used the results of the Maximum Likelihood Blocks (MLB) lightcurve analysis (Flaccomio et al., 2005), which segments the lightcurves into contiguous sequences of constant count rates and allows to discern between periods of flaring and more constant, sustained X-ray emission. A strict and fully convincing definition for “quiescent” X-ray emission is not possible, especially since any apparently quiescent emission may, in reality, just be a superposition of numerous unresolved small flares. Wolk et al. (2005) empirically establish a proxy for the quiescent emission levels by determining a ”characteristic level” in each lightcurve, which is essentially defined as the average count rate over periods where the count rate is not significantly elevated. An estimate for the characteristic X-ray luminosity can then be obtained by multiplying the temporally averaged X-ray luminosity, as determined from the spectral analysis, with the ratio of the characteristic countrate from the MLB analysis to the mean countrate over the COUP exposure. We note that this simple scaling procedure is not fully self-consistent, because it does not take into account that the X-ray spectral parameters (and thereby the transformation factor from count rate to luminosity) can change as a function of the emission level, but it should be appropriate for our purposes.
The difference between the average and characteristic X-ray luminosities is generally not large: the median value of the correction factor is 0.78; only for 13% of the TTS this factor is , and for only 4% of the TTS . We will show below that the choice of either the average or the characteristic X-ray luminosities has generally very little effect on the observed relations. We will therefore mainly use the temporally averaged X-ray luminosities and consider the characteristics luminosities only in a few cases.
3 Definition of the optical sample and X-ray detection completeness
3.1 The optical sample of ONC stars
The aim of our study is to investigate the X-ray properties of a homogenous and well defined sample of comprehensively characterized TTS (= young late type [F–M] stars). We will therefore not consider the COUP detected brown dwarfs (see Preibisch et al., 2005) or embedded objects (see Grosso et al., 2005), or OBA stars (see Stelzer et al., 2005), although we will sometimes compare the more massive stars with TTS.
The basis for the construction of our “optical sample” is the Hillenbrand (1997) [H97 hereafter] sample of optically visible () stars within pc () of the Trapezium, for of which optical spectral types are known. We used an updated version of the H97 tables in which for many objects spectral types and other stellar parameters have been revised222http://www.astro.caltech.edu/~lah/papers/orion_main.table1.working. Some of the stars in this area are unrelated field stars lying either in the foreground or the background of the Orion Nebula; these should of course be excluded from our studies. We therefore used the membership information from proper motion studies listed in the table of H97: we consider all stars with membership probabilities to be bona-fide members of the ONC, while stars with membership probabilities are considered here to be non-members and excluded from our analysis. Stars with no membership information are considered here as likely cluster members, because contamination by foreground field stars is very small333H97 estimate that of the mag stars within about 1 pc of the Trapezium (i.e., roughly the field of view of our COUP image) are ONC members, and contamination by background stars is unlikely due to the large visual extinction in the molecular could immediately behind the ONC. H97 assumes that the optical database is representative of all stars in the ONC region and that the completeness of is uniform with radius.
1056 of the H97 stars are within the field-of-view of the COUP observation, 892 of which are detected as X-ray sources. Excluding the 33 stars that are identified as non-members, we have 1023 likely ONC members from the H97 sample in the COUP field-of-view and detect 870 of these (i.e., 85%) as X-ray sources. For the analysis in this paper we use those of these stars for which spectral types are known. Our “optical sample” then consists of 639 optically visible likely ONC members from H97 with known spectral type; 598 of these stars (i.e., 94%) are detected as X-ray sources, 41 remain undetected in the COUP image. The spectral types range from O7 for Ori, the most massive and luminous star in the ONC, down to M6.5 for objects close to the stellar-substellar boundary (at ) at the age of the ONC. For 575 stars in the COUP optical sample bolometric luminosities are known, allowing them to be placed into the HR-diagram. Masses and ages were estimated for 536 stars by comparison of their location in the HR-diagram to the theoretical PMS evolutionary tracks from Siess, Dufour, & Forestini (2000). The masses in the COUP optical sample range from (the lowest mass in the Siess, Dufour, & Forestini (2000) models) to for C Ori.
The visual extinction is known for 631 of the 639 stars in our optical sample and varies from 0 to mag, with a mean value of mag. Since the optical sample is magnitude limited, extinction introduces a bias, since intrinsically brighter stars can suffer from more extinction and still be included in the sample than the intrinsically fainter stars. We therefore used an extinction limit to construct a more homogeneous sample: we define as the “lightly absorbed optical sample” those stars for which the optical extinction is known and is mag. The lightly absorbed optical sample consists of 586 stars, 554 of which are detected as X-ray sources in the COUP image. This extinction limit also yields a rather uniform sample with respect to the X-ray detection limit: PIMMS simulations for Raymond-Smith spectra with keV show that the detection limit (i.e. the X-ray luminosity that corresponds to a given number of detected source counts) increases by dex when going from zero extinction to ( mag). Since the uncertainty of the X-ray luminosity determinations is similar to this factor, our extinction limited sample does not suffer from a significant extinction-dependent X-ray detection bias.
To summarize, our “lightly absorbed optical sample” of 586 stars is not 100% complete (because spectral types are not available for all stars in the ONC), but nevertheless should be a statistically representative sample of the ONC young stellar population with low extinction. The only potential systematic selection effect might be that older ( Myr) very-low mass () stars may be missing; it is, however, unclear whether such an older population of ONC members does exist at all.
For the 42 stars in the optical sample which were not detected as X-ray sources in the COUP data, we estimated upper limits to their X-ray luminosities from the tabulated upper limits to their count rates following the procedure outlined in Getman et al. (2005a).
3.2 X-ray detection completeness
Table 1 lists the COUP X-ray detection fractions for the different spectral types. It is important to note here that most of the non-detections of ONC stars are due to X-ray source confusion in the COUP data; the typical case are close ( separation) binary systems, in which only one of the components is clearly detected as an X-ray source (Getman et al., 2005a). In these cases the object would perhaps have been detected if located at a different position. Since the occurrence of source confusion should not depend on stellar parameters, these objects can be considered as “unobserved” and will be ignored in our analysis. We can thus compute an “effective”, confusion-free detection fraction by removing these non-detections with source confusion from the sample. Then, the effective detection fractions range between 97% and 100% for all spectral classes except the A- and B-type stars. This means that less than 3% of the TTS in the optical sample are undetected because their X-ray emission is below our detection limit.
With so few undetected objects, we can look at these stars in detail. The undetected B8 star H97-1892 and the A1 star H97-531 are intermediate mass stars and will be discussed in Stelzer et al. (2005).
The three undetected K-type stars not suffering from source confusion are H97-62, H97-489, and H97-9320. H97-62 has a rather large extinction of mag that may have absorbed too much of its X-ray emission. H97-489 has no bolometric luminosity and optical extinction listed in H97. The third object is the K6-star H97-9320, which lies far (2.7 mag) below the ZAMS in the HR-diagram, putting considerable doubt on its membership to the ONC; since the star has also no proper-motion membership information in H97, we suspect it to be a non-member and exclude it from our optical sample. We therefore conclude that all K-type stars in the lightly absorbed optical sample are detected.
For the 13 undetected M-type stars not suffering from source confusion we note that two objects have optical extinction exceeding mag, and 4 objects have no proper-motion membership information in H97 and may therefore perhaps be non-members. Only 8 of the M-type stars among the known proper motion members in the lightly absorbed optical sample remain undetected. The upper limits to the fractional X-ray luminosities of the undetected M-type stars range from (for H97-305) to (for H97-853). This is considerably below the mean fractional X-ray luminosities of the detected M-type stars of , but still within the range of fractional X-ray luminosities found for the detected M-type stars, three of which have values below the lowest upper limit for the non-detections. We conclude that the very few undetected M-type stars show low, but not necessarily unusually low levels of X-ray activity.
To summarize, we find that COUP detects every optically visible star in the ONC sample except a few of the intermediate mass stars (which are not expected to be intrinsic X-ray emitters) and a few of the M-type stars (some of which may perhaps be non-members). We find no indications for the existence of an “X-ray quiet” population of stars with suppressed magnetic activity. Our analysis is thus based on a (nearly) complete sample, and we can be very confident that our conclusions will not be affected by non-detections. The only remaining concern is about the completeness of the optical sample, which may not be very well established for older ( yr) very low-mass () stars.
It is interesting to note that most (1047 of 1616, i.e. 65%) of the COUP X-ray sources were already detected in the previous 23 hr exposure ACIS observation or the 17.5 hr HRC observation of the ONC. Since the field-of-view covered by the different observations is not identical, we focus on the inner radius area, which is included in all observations considered here. In this area, 970 (66.6%) of the 1457 COUP sources, 475 (90.9%) of the 522 COUP sources in the optical sample, and 438 (91.3%) of the 480 COUP sources in the lightly absorbed optical sample were already detected in the previous 23 hr ACIS observation or the 17.5 hr HRC observation. With more than 10 times the earlier exposure times, COUP leads to the detection of only a relatively small number of 47 (42) new X-ray sources that could be identified with stars in the (lightly absorbed) optical sample. The COUP data nevertheless represent an important step forward over the previous observations, since they increased the X-ray detection fraction in the lightly absorbed optical sample from to at least 97%, transforming an incomplete sample to a (nearly) complete sample. Also, the COUP data for the individual sources have much higher S/N (counts per source) than previous data sets, thus allowing a much more reliable determination of the X-ray source properties.
4 Relation of the X-ray emission to basic stellar parameters
Since the origin of the X-ray activity in TTS is still not well known, it is unclear which are the best parameters to consider in making correlations. We therefore consider several possibly useful stellar parameters (bolometric luminosity, stellar mass, effective temperature, rotation, circumstellar disk properties, accretion rates) to look for relations to the X-ray emission level; note that relation between X-ray activity and age are discussed in a separate paper (Preibisch & Feigelson 2005). For the characterization of the X-ray properties we consider here the X-ray luminosity , the fractional X-ray luminosity , and the X-ray surface flux , i.e. X-ray luminosity divided by the stellar surface area. Throughout this paper, we use to refer to the extinction-corrected total band ( keV) luminosity defined and listed by Getman et al. (2005a).
Most of the relations presented here were already studied in other X-ray data sets (e.g. Feigelson et al., 2003; Flaccomio et al., 2003b; Preibisch & Zinnecker, 2002), often with similar results to what we find here. Nevertheless, we study these relations here in some detail because our COUP data provide a unique, in fact the best data set for an investigation of the nature and the origin of the X-ray emission from TTS for the following reasons. With the exceptionally well characterized young stellar population in the ONC we can take advantage of known stellar parameters for several hundred stars. The high sensitivity of the COUP X-ray data yields a detection limit of erg/sec for lightly absorbed stars and allows us to detect more than 97% of the stars in the lightly absorbed optical sample of cluster members. Our analysis is therefore based on an nearly complete sample. The high sensitivity allows us to detect X-ray emission of the young solar-luminosity stars down to activity levels444Note that the quoted activity level refers to the relatively hard 0.5–8 keV COUP band. This band covers most of the X-ray flux from TTS (which are characterized by rather high plasma temperatures of MK and have accordingly relatively hard X-ray spectra). Solar-like field stars and the Sun, however, exhibit considerably lower plasma temperatures ( MK in the case of the Sun) and have accordingly softer X-ray spectra with most of the X-ray flux below the COUP band. If the Sun were located at the distance of the ONC, it would be only marginally detectable during its maximum phase of coronal activity. of . Our statistical analysis strongly benefits from the large sample of 598 optically well characterized ONC stars for which X-ray emission is detected. This represents the largest homogenous sample of TTS that has ever been studied with very sensitive X-ray observations (and will remain so for the foreseeable future). The availability of X-ray spectra with good S/N for nearly all sources allows the determination of reliable X-ray luminosities. The 10 day long observation provides a much better measure for the “typical” X-ray properties of the strongly variable TTS than observations with shorter exposure times, which yield only a “snapshot”.
4.1 X-ray luminosity and bolometric luminosity
The plot of X-ray luminosity versus bolometric luminosity is shown in Fig. 2. Nearly all stars show and therefore are much more X-ray active than the Sun (for which is an average during the course of the solar cycle). The most active stars show fractional X-ray luminosities around , which is known as the “saturation limit” for coronally active stars (Fleming et al., 1995).
Considering only the low-luminosity () stars, we find a clear correlation between X-ray and bolometric luminosity, although with a very large scatter. We utilized the ASURV survival analysis package (Feigelson & Nelson, 1985; Isobe et al., 1986; LaValley et al., 1990) for the statistical investigation of the relation between and . The ASURV software allows one to deal with data sets that contain non-detections (upper limits) as well as detections, and provides the maximum-likelihood estimator of the censored distribution, several two-sample tests, correlation tests and linear regressions. The linear regression fit with the parametric Estimation Maximization (EM) algorithm in ASURV yields with a standard deviation of 0.70 dex in for the low-luminosity stars (). This relation is very similar to the relations found for other young clusters (cf. Feigelson & Montmerle 1999) and is consistent with a linear relation between X-ray and bolometric luminosity characterized by .
4.2 X-ray activity and stellar mass
Next we considered the relation between X-ray luminosity and stellar mass (Fig. 3). As described in Getman et al. (2005a), the stellar masses listed in the COUP tables were derived from the Siess, Dufour, & Forestini (2000, SDF hereafter) PMS models. It is well known that mass estimates from PMS evolutionary models are subject to significant uncertainties; different PMS models and/or temperature scales can lead to differences by as much as a factor of in the mass estimates (for detailed investigations of these uncertainties see, e.g., Luhman, 1999 or Hillenbrand & White, 2004). As a test to what extent the relation is dependent on the choice of the PMS model555Our comparison here is restricted to the PMS models of Siess, Dufour, & Forestini (2000) and Palla & Stahler (1999) because these two models cover particularly wide ranges of stellar masses; this does not imply that we consider these specific models to be “better” than other models., we compared the relation found for the masses derived from the SDF models to those based on stellar masses estimated from the PMS models of Palla & Stahler (1999, PS hereafter). Note that the masses determined from these two sets of models agree very well with each other for objects with , but below the PS models yield systematically lower masses than the SDF models.
For both sets of stellar masses a clear correlation is found between X-ray luminosity and mass. For the low-mass () stars, the SDF models lead to an EM linear regression fit of with a standard deviation of 0.65, whereas the PS models yield a somewhat shallower relation of with a standard deviation of 0.64. From this exercise we conclude that the detailed shape of the correlation does depend on the PMS model used, but the general dependence is independent of the choice of the model.
The power-law slopes we find here for the ONC TTS are considerably lower than those found for the TTS in the Chamaeleon star forming region (slope in the mass range ; Feigelson et al., 1993) and the very young stellar cluster IC 348 (slope in the mass range ; Preibisch & Zinnecker, 2002) or than that derived for M-type field stars (slope in the mass range ; Fleming et al., 1988). The differences in the slopes are in part due to differences in the considered mass ranges and in the methods to estimate stellar masses. Another factor may be that many of the previous studies had to deal with large numbers of X-ray upper limits for undetected very-low mass stars, which perhaps caused the typical X-ray luminosities of these very-low mass stars to be underestimated.
Next we consider the fractional X-ray luminosity as a function of mass. In Fig. 4 we show the relation for low-mass stars. The statistical tests in ASURV reveal a very shallow, but nevertheless highly significant () correlation between fractional X-ray luminosity and mass for low-mass () objects. The linear regression fit with the EM algorithm yields with a standard deviation of 0.69 dex.
We also used this relation to illustrate the influence of X-ray variability during the COUP observation on the resulting correlations. If we consider the characteristic X-ray luminosities derived from the MLB lightcurve analysis rather than the average X-ray luminosities, we find a very similar relation with with a standard deviation of 0.64 dex. This test shows that the use of the characteristic rather than the average X-ray luminosities decreases the values of the fractional X-ray luminosities slightly, but the power-law slopes for the correlations are nearly identical, and the scatter in the correlation diagrams is only very slightly smaller. From this exercise, we conclude that the correlations do not significantly depend on the choice of the average or characteristic X-ray luminosities.
4.3 X-ray activity and stellar effective temperature
In Fig. 5 we show the X-ray surface fluxes (i.e. X-ray luminosities divided by the stellar surface area) of the ONC TTS plotted versus their effective temperatures. Nearly all stars have X-ray surface fluxes in the range , which corresponds nicely to the minimum and maximum X-ray surface flux found for different structures in the solar corona (where coronal holes and the background corona show X-ray fluxes around , while active regions show fluxes up to ); the similarity of the X-ray surface flux ranges found for late-type stars and for different constituents of the solar corona has already been noted, e.g., in Schmitt (1997) or Peres et al. (2004). The plot also shows a strong decline of the X-ray surface flux with effective temperature among the M-type stars. This dependence is much more pronounced than the very shallow relation between and the stellar mass discussed above. This effect can be understood if one recalls that the surface flux and the fractional X-ray luminosity are related to each other by . Therefore, decreases with decreasing for constant .
4.4 Comparison to main-sequence stars
For a meaningful comparison of the ONC TTS to main-sequence (MS) stars, it is important to keep in mind that our ONC TTS sample is an optically selected and representative sample of cluster members. For a proper comparison we therefore have to use an optically selected (not X-ray selected) sample of MS stars. A well suited comparison sample is the NEXXUS database (Schmitt & Liefke, 2004), which provides updated ROSAT X-ray and optical data (including accurate HIPPARCOS parallaxes) for nearby field stars. It contains volume-limited samples for G-type ( pc), K-type ( pc), and M-type ( pc) stars with detection rates of more than 90%. The NEXXUS tables were kindly provided to us by the authors; they list , , in the keV ROSAT band, and the X-ray surface flux . We used the data for the 43 G-type stars (including 4 non-detections), the 54 K-type stars (including 2 non-detections), and the 79 M-type stars (including 5 non-detections). Bolometric luminosities, effective temperatures, and masses of the stars were estimated by interpolation using MS relationships of these quantities with the absolute magnitude .
When comparing the NEXXUS data to our COUP data one has to take into account the different energy bands for which X-ray luminosities were computed. The NEXXUS X-ray luminosities are given for the keV ROSAT band, and for comparison with our COUP results we have to transform these luminosities into keV band. The transformation factor can be calculated with PIMMS and depends on the X-ray spectrum; since we can assume thermal plasma spectra, the transformation mainly depends on the plasma temperature. For the NEXXUS stars, the count-rate to luminosity transformation factor used by Schmitt & Liefke (2004) assumes a plasma temperature of MK, and the corresponding energy band correction factor is 0.33 dex. In the following comparisons we also consider the X-ray properties of our Sun. For this, we use here the ROSAT-band X-ray luminosity range of based on the results of Judge et al. (2003) for the activity range of a typical solar cycle. Assuming a plasma temperature of 2 MK, the flux in the keV band is 0.48 dex lower than that in the keV band.
Figure 6 compares the relations for the COUP optical sample to that for the NEXXUS sample of field stars. A clear correlation between X-ray and bolometric luminosity is not only seen for the ONC TTS, but also for the NEXXUS field stars. The tests in ASURV show that the correlation for the NEXXUS stars is significant ; the linear regression fit with the EM algorithm for the G-, K-, and M-type stars in the NEXXUS sample yields a power-law slope of , which is much shallower than the slope found for the correlation for the COUP stars ().
Figure 7 compares the relations for the COUP optical sample to that for the NEXXUS sample of field stars. It is interesting to see that there is a clear correlation between X-ray luminosity and mass for the NEXXUS field stars. The tests in ASURV show the X-ray luminosity and mass are clearly correlated ; the linear regression fit with the EM algorithm for objects in the mass range yields with a standard deviation of 0.77. The corresponding correlation for the TTS in the COUP optical sample yielded a power-law slope of , which is consistent to the slope for the field stars within the uncertainties. The similarity of the slopes found in the relations for the ONC TTS and the field stars may indicate that the relation between stellar mass and X-ray luminosity is more fundamental than that between bolometric and X-ray luminosity.
The plot of fractional X-ray luminosities against stellar masses (Fig. 7) shows that some of the very-low mass field stars reach similar activity levels as the TTS. The solar-mass field stars, on the other hand, are typically much less X-ray active than their young COUP counterparts. The different activity levels of the field stars as a function of mass can be understood as a consequence of the activity-rotation relation for MS stars: many of the very-low mass field stars are rapid rotators, thus show high levels of X-ray activity, while most solar-mass field stars rotate quite slowly, therefore displaying lower activity levels. For the COUP stars, on the other hand, we show in Section 5 that all stars with known rotation period rotate more rapidly than the Sun, and that their X-ray activity is probably unrelated to their rotation period.
5 X-ray emission, rotation, and convection
5.1 The activity–rotation relation for the TTS
For MS stars, the well established correlation between fractional X-ray luminosity and rotation period (e.g. Pallavicini et al., 1981; Pizzolato et al., 2003) constitutes the main argument for solar-like dynamo mechanism as the origin of their X-ray activity. As already noted in the introduction, the existence of a similar activity – rotation relation could not be unambiguously proven for PMS stars, mainly due to a lack of statistical power in the underlying data (in most studies the sample sizes were too small for statistically significant conclusions to be drawn). The previous ONC studies (Feigelson et al., 2002a; Flaccomio et al., 2003b), however, provided strong evidence that the TTS do not follow the activity – rotation relation for MS stars.
Table 9 in Getman et al. (2005a) lists rotation periods for 158 stars in our COUP optical sample. Considering also the additional rotation data as listed in Flaccomio et al. (2005), rotation periods from photometric monitoring are available for 228 stars in our optical TTS sample (169 M-type stars, 58 K-type stars, and one G-type star). In Fig. 8 we plot the fractional X-ray luminosity versus rotation period for these stars, and compare them to data for MS stars. It is rather obvious that the COUP stars do not follow the well established activity-rotation relation shown by the MS stars, i.e. increasing activity for decreasing rotation periods followed by saturation at for the fastest rotators. A statistical analysis reveals for the COUP stars a correlation between and rather than the anti-correlation seen for the MS stars: the linear regression analysis with SLOPES (Isobe et al., 1990; Feigelson & Babu, 1992) yields a bisector regression fit of the form . This correlation is statistically significant; a Kendall’s and Spearman’s test give probabilities of for the null hypothesis that a correlation is not present. The observed correlation between and is clearly very different from the anti-correlation shown by the MS stars (where the bisector regression fit yields a slope of for the sample shown in Fig. 8 in the period range 1–10 days). These results do not change significantly if we use the characteristic rather than the average X-ray luminosities.
Before we consider possible explanations for these findings, it is important to note that rotation periods are known for only of the X-ray detected stars in our optical sample, and that this subsample may be biased with respect to its X-ray properties. Stassun et al. (2004a) studied archival ACIS data of the ONC and pointed out that the stars with known rotation period in their sample show systematically higher X-ray activity than the stars with unknown periods. A similar difference is present in our COUP optical sample: the median fractional X-ray luminosity for the TTS with known rotation periods is at , while the median value for TTS with unknown periods is . A KS test gives a probability of for the hypothesis that the distributions of fractional X-ray luminosities in both samples are identical, i.e. the apparent difference of about a factor of in X-ray activity is statistically significant. This difference is not due to systematic differences in the basic stellar parameters666We note that the stars with known periods have systematically higher masses ( dex, ) than the stars without periods. According to the correlation between stellar mass and fractional X-ray luminosity established in Sect. 4, this difference in stellar masses would, however, predict a difference in the activity level of only dex, much smaller than the observed dex difference between stars with and without known periods. This effect can therefore not explain the difference in the activity levels of stars with and without known periods. of the two samples.
The explanation of this difference was discussed in detail by Stassun et al. (2004a): Rotation periods can only be determined for stars showing sufficiently large spot related photometric variability. The level of photometric variability, however, is related to the level of magnetic activity, and therefore the more active stars (i.e. those with higher X-ray luminosities) are easier targets for a determination of photometric rotation periods, while the less active stars (i.e. those with lower X-ray luminosities) show too small photometric variability to allow determination of periods. A quantitative description of these interrelations for the case of MS stars has been given by Messina et al. (2003). It is therefore likely that the COUP stars without known rotation periods rotate on average slower than the stars with known periods. This introduces a bias our sample, since most of the missing stars (i.e. those without known rotation periods) have lower fractional X-ray luminosities and longer rotation periods than the stars in our sample. The apparent correlation between X-ray activity and rotation period may therefore (in part) be due to these selection effects.
Nonetheless, it appears very unlikely that the ONC TTS follow the same rotation-activity relation as found for MS stars. First, we note that the effects of the bias due to unknown rotation periods appear much too small to transform the strong anti-correlation of the MS stars into an apparent positive correlation. Second, the quite high fractional X-ray luminosities for most TTS in the period range between and days, which are more than one order of magnitude higher than the typical values for MS stars, also indicate differences between the TTS and the MS sample. In conclusion, we are confident that the ONC TTS do not follow the same rotation-activity relation as seen in MS stars, but it remains unclear whether and how the X-ray activity of the TTS is correlated to their rotation periods.
The inability to draw meaningful conclusions from our X-ray and rotation data may be due to the fact that the rotation period is perhaps the wrong variable to look at. Theoretical studies of the solar-like dynamos show that the dynamo number is not directly related to the rotation period, but to more complicated quantities such as the radial gradient of the angular velocity and the characteristic scale length of convection at the base of the convection zone. It can be shown that (with some reasonable assumptions) the dynamo number is essentially proportional to the inverse square of the Rossby number (e.g. Maggio et al., 1987). The Rossby number is defined as the ratio of the rotation period to the convective turnover time , i.e. . For MS stars, the theoretical expectations are well confirmed: it is well established (e.g. Montesinos et al., 2001) that the stellar activity shows a tighter relationship to the Rossby number than to rotation period. The shape of the relation is similar to that of the activity–rotation relation: for large Rossby numbers, activity rises strongly as until saturation at is reached around , which is followed by a regime of “supersaturation” for very small Rossby numbers, .
The convective turnover time scale is a sensitive function of the physical properties in the stellar interior and its determination requires detailed stellar structure models. Many studies of stellar activity therefore used semi-empirical interpolations of values as a function of, e.g., color. This may be appropriate for MS stars, but seems to be insufficient for TTS which have a very different and quickly evolving internal structure.
5.2 Computation of convective turnover times for the TTS
For the computation of convective turnover times a series of stellar evolution models with masses ranging from to was computed with the Yale Stellar Evolution Code. The evolution was assumed to start at the stellar birthline, where stars initially become visible objects (Palla & Stahler, 1993). All models used the parameters derived for the standard solar model, where the initial , , and the mixing-length ratio were varied until a solar model at the solar age of 4.55 Gyr has the observed solar values of luminosity, radius, and (=0.0244; Grevesse et al., 1996). The model that best matched the solar properties777We note that new precision measurements of elemental abundances on the solar surface imply a lower metalicity than previously assumed, and lead to inconsistencies in theoretical solar models with respect to the depth of the solar convection zone (see Bahcall et al., 2004, and reference therein). was of and the mixing length ratio 1.7432. These values were then used for all stellar models.
A detailed discussion of the physics used in this study for the construction of stellar models can be found in Yi et al. (2001). The most important aspects are as follows: The solar mixture was assumed as given by Grevesse & Noels (1993). For OPAL Rosseland mean opacities (Iglesias & Rogers, 1996) were used, for opacities from Alexander & Ferguson (1994). The OPAL EOS 2001 equation of state (Rogers et al., 1996) was used and the energy generation rates were set according to Bahcall & Pinonneault (1992). Neutrino losses were taken following Itoh et al. (1989), and for the helium diffusion the values of Thoul et al. (1994) were used.
Since the dynamo action is believed to take place at the base of the convection zone, anchored in the radiative layers just below the convective interface, the convective turnover time of the deepest part of the convection zone is the most relevant in the evaluation of the Rossby number. Our knowledge of stellar convection is too limited to calculate ’correct’ convection turnover times, because the characteristic length scales, as well as the velocities, are not well known. Even when one decides to resort to the mixing length approximation, there are still uncertainties: the mixing length ratio is assumed to be the same for all stars with different masses and/or at different evolutionary stages, which is probably not fully correct. However, for the convection near the base of the convection zone where the temperature gradient is for all practical purposes adiabatic, the mixing-length approximation is known to provide an adequate description of convection at least in an average sense (Kim & Demarque, 1996). For the characteristic timescale of convective overturn, the convective turnover time (i.e. the local mixing length divided by the local velocity) was calculated at each time step, which was determined at a distance of one-half the mixing length above the base of the surface convection zone888Note that for fully convective stars the base of the convection zone is the center. (Gilliland, 1986; Kim & Demarque, 1996). The convective turnover times were determined for the stars in the optical sample according to the model that represents their corresponding state in the HR-diagram, i.e. reproduces the values. The resulting values are shown in Fig. 9. Note that the convective turnover times of the TTS are much larger (up to factors of ) than those in MS stars, and depend strongly on the effective temperatures and ages of the stars.
5.3 The activity – Rossby number relation for the TTS
The Rossby numbers for the ONC TTS were computed by dividing their rotation periods by the values for their local convective turnover time as derived above. The plot of fractional X-ray luminosity versus Rossby number in Fig. 10 shows no strong relation between these two quantities. All TTS have Rossby numbers and therefore are in the saturated or super-saturated regime of the activity – Rossby number relation for MS stars. To search for indications of super-saturation, we compared the fractional X-ray luminosities of the TTS in the saturated () and super-saturated () regimes. Indeed, we found a slightly lower median of for the TTS in the super-saturated regime as compared to for those in the saturated regime; a KS test gives a probability of for the assumption of equal distributions in both samples, i.e. the difference is significant at the 97% level. Thus, the fractional X-ray luminosities of the TTS show a qualitatively similar relation to their Rossby numbers as is found for MS stars.
A remarkable difference between our TTS sample and the data for MS stars is the very wide dispersion of fractional X-ray luminosities at a given Rossby number in our TTS data. The scatter extends over about three orders of magnitude, and even if we consider the characteristic (i.e. flare-cleaned) rather than the average X-ray luminosities, the scatter is only very slightly smaller. This large scatter is in strong contrast to the tight relation found for MS stars, where the scatter in at a given Rossby number is only about dex (e.g., Pizzolato et al., 2003).
To conclude, we find that the X-ray activity of the ONC TTS may depend on Rossby numbers in a similar way to what is found for MS stars, but the large scatter of X-ray activity at any given Rossby number suggests that additional factors are important for the level of X-ray activity.
6 Possible explanations for the wide scatter in the correlations
All the correlations between the X-ray activity and other stellar parameters show a very large scatter, often exceeding three orders of magnitudes. Three obvious reasons for the presence of scatter are uncertainties in the variables, X-ray variability, and unresolved binaries. Can these effects account for the wide scatter seen in the correlations? We first consider X-ray variability.
Most of the COUP sources show strong variability in their lightcurves. It is well known that variability is a common feature in the X-ray emission from TTS, active stars, and also our Sun. The degree of variability is a function of the timescales. For active MS stars and the Sun, short term variability (timescales of minutes to hours) is usually dominated by flares which can cause large variations (sometimes exceeding factors of 10). On timescales from days to weeks, the typical variations are about a factor of 3 and up to 10, while the typical variability on timescales from months to years is a factor of about (e.g. Micela & Marino, 2003; Orlando et al., 2004). Furthermore, indications for stellar X-ray activity cycles have been found for some stars; these cycles can induce more than one order of magnitude variability over a few years (e.g., Favata et al., 2004).
In previous, generally much shorter X-ray observations of TTS, the large scatter was often assumed as being probably due in part to X-ray flaring. The COUP data provide two important pieces of information in this respect. First, the influence of individual flares on the average X-ray luminosity is strongly smoothed out by the long time basis of the COUP observation; the scatter seen in the correlations based on our COUP data should therefore be much smaller than what would be found from shorter, snapshot-like observations. Second, the use of the characteristic X-ray luminosities, which effectively exclude periods of flaring from the lightcurves, should further reduce the scatter, if short-term X-ray variability were the main reason for the large scatter in the correlation diagrams. These expectations are, however, not confirmed in our data: We find that the scatter in the COUP (i.e., 10 day average) X-ray luminosities of the ONC TTS, e.g. as a function of bolometric luminosity or mass, is very similar to that found in the correlations based on the previous 23 hr ACIS observation (Feigelson et al., 2002a). Also, the use of characteristic rather than average X-ray luminosities reduces the scatter only marginally. This suggests that variability on time-scales between and days is not the main source of the large scatter in the correlations between X-ray activity and other stellar parameters.
What about variability on longer timescales? We can investigate the variations on timescales of several years by comparison of the COUP data (obtained in January 2003) to the previous 23 hour ACIS observations of the ONC (obtained in October 1999/April 2000) given by Feigelson et al. (2002a). For 515 of the COUP detected stars in our optical sample X-ray luminosities based on the 23 hour observations are listed by Feigelson et al. (2002a). Since the spectral fitting procedure used in the analysis of the 23 hr data is not identical to that used for the COUP data, we compare here the observed X-ray luminosities, , without extinction correction, which just give the integral of the observed flux over the spectrum. We find a good agreement of the luminosities from the two observations separated by more than 3 years: the median absolute deviation from equal luminosities is only 0.31 dex, corresponding to just a factor of . This demonstrates that the X-ray luminosities of most ONC TTS vary only slightly on timescales of several years. The observed level of variability cannot account for the large scatter seen in the correlation diagrams.
Now we try to quantify the uncertainties of the variables in the correlation diagrams. According to H97, the uncertainties in are dex. The uncertainties in the stellar mass estimates are probably of a similar magnitude. The uncertainties of the X-ray luminosities, derived from the spectral fits, are difficult to determine because the spectral models are highly non-linear and the individual spectral parameters are often strongly correlated. Furthermore, ambiguities can occur when two qualitatively different spectral models give similarly good fits. We therefore assume the typical random uncertainties of to be similar to the uncertainties in the emission measures derived in the spectral fits, i.e. about dex. Note, however, that some sources may be affected by systematic errors, which may well exceed this level.
Finally, we consider the effect of unresolved binaries. The presence of an unresolved companion causes an overestimation of both, the bolometric and the X-ray luminosity. However, if X-ray and bolometric luminosity are related linearly (as our data suggest), unresolved companions should only shift the position of a star in the diagram along the correlation line and not increase the scatter. The stellar mass determined by comparison with PMS tracks depends (in the case of low-mass stars) mainly on the measured spectral type; as the combined optical spectrum of a binary system is dominated by the light of the primary component, the inferred mass is that of the primary, whereas the observed X-ray luminosity is the sum for primary and companion. If X-ray luminosity and stellar mass are correlated, the overestimation of the X-ray luminosity should be at most a factor of two999There may, however, be larger effects in special cases. For example, in the case of a binary system in which both components show very different amounts of extinction, a fit to the combined X-ray spectrum may easily lead to wrong parameters.; the typical shift in depends on the distribution of mass ratios in the binary systems (which is not well known), but is presumably about dex among the low-mass stars.
The combined effect of the variability, the uncertainties in the variables, and unresolved binaries should therefore produce a scatter of roughly dex. This is considerably less (by about a factor of two) than the scatter observed in the correlation diagrams, where the standard deviations are typically dex. A large fraction of the scatter in the correlations must therefore be due to other reasons, most likely due to intrinsic differences in the X-ray activity levels of the TTS. In §8 we will show that the large scatter is probably related to the influence of accretion on the X-ray properties.
7 X-ray plasma temperatures
As described in G05, the X-ray spectra of the COUP sources were fitted with single-temperature or (in most cases) two-temperature thermal plasma models plus absorption. We are fully aware that these relatively simple models are not “perfect”, since it is well known that the coronae of active stars are generally not monothermal and can usually not be considered as to consist of just two different temperature components (e.g. Brickhouse et al., 2000; Sanz-Forcada et al., 2003). Nevertheless, this approach is justified because the purpose of our analysis was to characterize the coronal temperatures of the COUP stars in a homogenous way using a parsimonious model, rather than to perform a detailed investigation of the temperature structure of those sources (which will be the topic of separate studies). As demonstrated for example by Peres et al. (2000), fits of simulated spectra based on continuous temperature distributions with simple one- or two-temperature models usually yield temperatures near the peaks of the underlying temperature distribution. We therefore assume that the temperatures derived from the fits reflect some kind of a “characteristic” temperature, which then can be related to other stellar parameters.
In Fig. 11 we plot the plasma temperatures and the ratios of the emission measures of the hot and cool component derived in the spectral fits versus the X-ray surface flux. First, we note that the temperature of the hot plasma component increases with increasing surface flux; the slope is consistent the relation , what is similar to a scaling relation derived for the solar corona by Peres et al. (2004) (which however, was established for a much lower temperature range than seen here on the TTS). Second, we note that the relative contribution from the hot component (as measured by the ratio of emission measures for the hot and cool components) also increases with increasing X-ray activity. The most interesting result from these plots is the remarkable similarity of the temperatures of the cool plasma component in our sample. For nearly all stars a temperature of about 10 MK is found for the cool component. This suggests that this 10 MK component is a real feature in the coronal temperature distribution of the TTS. It is interesting to note that a MK plasma component seems to be some kind of a general feature of coronally active stars; for example, Sanz-Forcada et al. (2003) determined the emission measure distribution of 28 coronally active nearby field stars and found a peak at 8–10 MK in most of their stars. They argued that this temperature component may define a fundamental coronal structure, which is probably related to a class of compact loops with high plasma density.
Figure 12 shows the derived plasma temperatures as a function of stellar effective temperature. Among the M-type stars one can see a decrease in the temperature of the hot component for decreasing effective temperature. This can be understood as a consequence of the correlation of the hot plasma temperature with the level of X-ray activity (as traced by or ) and the decrease of X-ray activity with decreasing mass or effective temperature (see, e.g. Fig. 5).
In Fig. 13 we plot the temperature of the hot versus that of the cool plasma component for the ONC TTS. We also have included temperatures derived for G- and K-type stars in several young clusters and for solar-like field stars, as well as values for different structures in the solar corona as derived in the simulations of the “Sun as a star” by Orlando et al. (2004). The ONC TTS follow the general correlation between the temperatures of the hot and cool plasma components seen for the MS stars, although nearly all TTS show much higher temperatures than found on the MS stars. In the solar corona and in many active MS stars, plasma temperatures significantly exceeding 10 MK are only seen during strong flares. The high plasma temperatures found for the TTS may suggest an increased contribution of flares to the total X-ray emission.
8 X-ray emission and circumstellar accretion disks
It is still unclear how the (magnetic) interactions between a young stellar object and its surrounding circumstellar accretion disk influence the X-ray activity. Many X-ray observations of star-forming regions have been used to search for differences in the X-ray properties of the classical T Tauri stars (CTTS; usually defined by the presence of H emission with equivalent widths Å), which are thought to be actively accreting via circumstellar disks, and the weak-line T Tauri stars (WTTS; Å), which seem to lack disks and active accretion. The results of these investigations showed confusing differences: some studies (e.g. Gagné et al. 1995; Feigelson et al. 1993; Casanova et al. 1995; Preibisch & Zinnecker 2002) found no significant differences between the X-ray luminosity functions of CTTS and WTTS, while other studies, most notably the Taurus-Auriga study by Stelzer & Neuhäuser (2001), found clear differences in the X-ray luminosity functions, with the WTTS being the stronger X-ray emitters. The two studies of the ONC before COUP also yielded seemingly contradictory results: Feigelson et al. (2002a) found no differences in the X-ray activity levels of stars with and without disks, whereas Flaccomio et al. (2003b) reported a strong difference in the X-ray activity levels of accreting and non-accreting stars.
It is important to note that the different studies used different criteria to define the samples of CTTS and WTTS: sometimes the strength of the H or Ca emission line were used, while other studies used the presence or absence of near-infrared excess emission. These different kinds of indicators actually measure different things that cannot be directly compared: H or Ca line emission is thought to be a tracer of accretion, while infrared excess emission is a tracer of circumstellar material. While accretion obviously requires the presence of circumstellar material, the presence of circumstellar material alone does not necessarily mean that the young stellar object is also accreting. Furthermore, this issue is easily affected by strong selection effects if the samples of TTS are either X-ray selected or based on optical selection criteria such as emission lines or infrared excess. For example, in many star forming regions H emission was used as a tracer to find and define the population of T Tauri stars. This can easily introduce a strong bias, because the CTTS are quite easy to recognize by their prominent H emission even if they are very faint, whereas WTTS of similar brightness are much harder to identify. The optical H selected samples of TTS are therefore often very incomplete for WTTS and much more complete for the CTTS (see discussion in Preibisch & Zinnecker, 2002). In fact, the majority of WTTS in many star forming regions have been found through X-ray observations (cf. Neuhäuser 1997) and therefore suffer from an X-ray selection bias.
The COUP study provides us with the important advantage that we can use a statistically complete sample of all optically visible stars in the region, which does not suffer from any of the selection effects described above. In the following we will investigate how and in which way the X-ray activity is related to infrared excess emission as a tracer of circumstellar material (§8.1), optical line emission as a tracer of accretion (§8.2), and estimates of accretion rates and luminosities from astrophysical models (§8.3).
8.1 X-ray activity and infrared excess (= inner disk tracer)
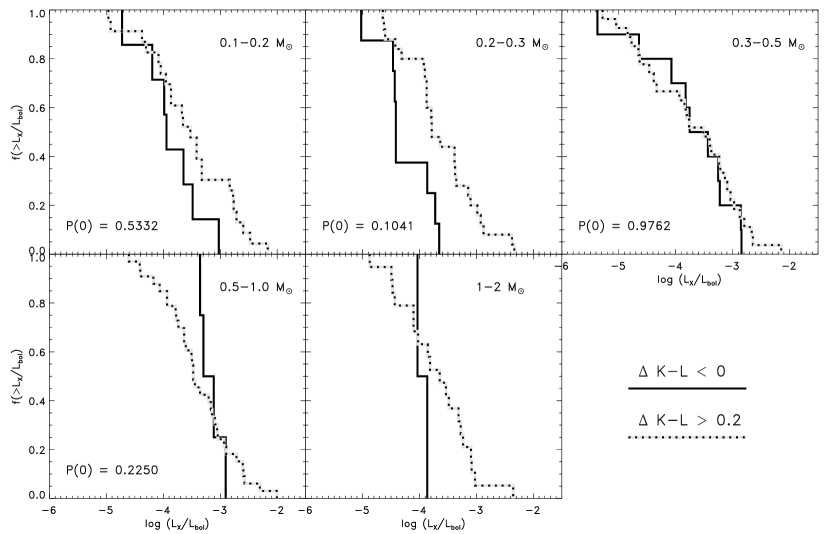
A good way to discern between TTS with and without circumstellar material is to look for infrared excess emission. The COUP tables list the color excess as determined by Hillenbrand et al. (1998). This quantity represents the color excess relative to the expected photospheric colors for the star’s spectral type after correction for reddening due to extinction, and has been shown to be a useful tracer of circumstellar material (see discussion in Hillenbrand et al., 1998). However, the excess is not optimal for detecting circumstellar material, since the -band excess traces only the hottest dust in the innermost regions near the central star; it has been shown (e.g. Haisch et al. 2001) that many stars with circumstellar material show significant excess emission only at longer wavelengths. We therefore also used the -band photometric data listed in the COUP tables and determined a color excess in an analog way as . The excess has the advantage of being more sensitive for circumstellar material and less strongly affected by uncertainties in the visual extinction, but the disadvantage of being available for fewer (228) TTS than (446 TTS) in the optical sample.
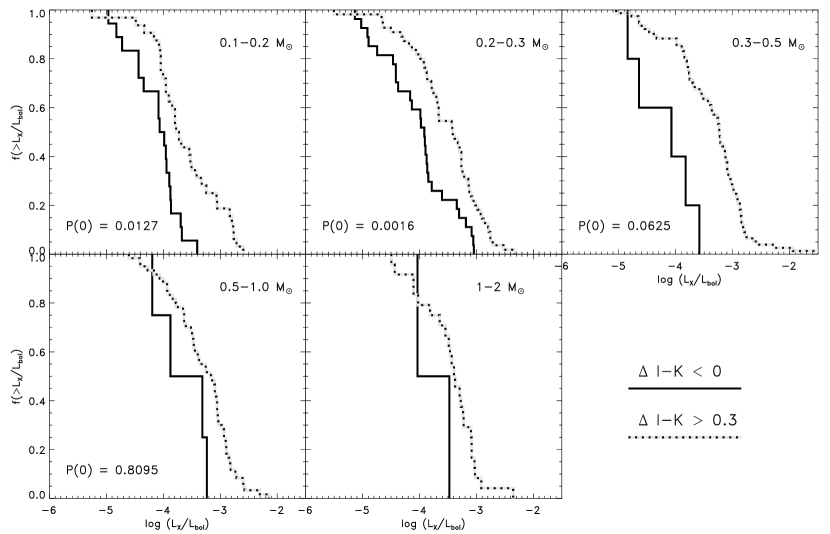
Since the infrared excess emission in our sample is correlated to effective temperature and stellar mass, we compare in Fig.14 and Fig. 15 stars with and without excesses in mass stratified samples. In the samples based on excess, we find significantly different () fractional X-ray luminosity distributions for the and the bins, whereas for the more massive stars the differences are only of marginal statistical significance. If we use the excess (which we regard as more reliable), no significant differences are found for any of the mass ranges considered.
8.2 X-ray activity and Ca II line emission (= accretion tracer)
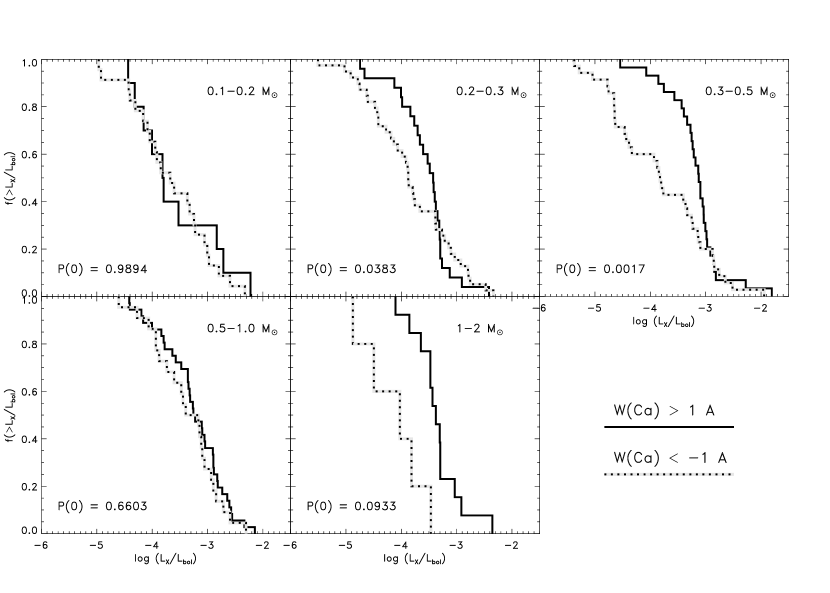
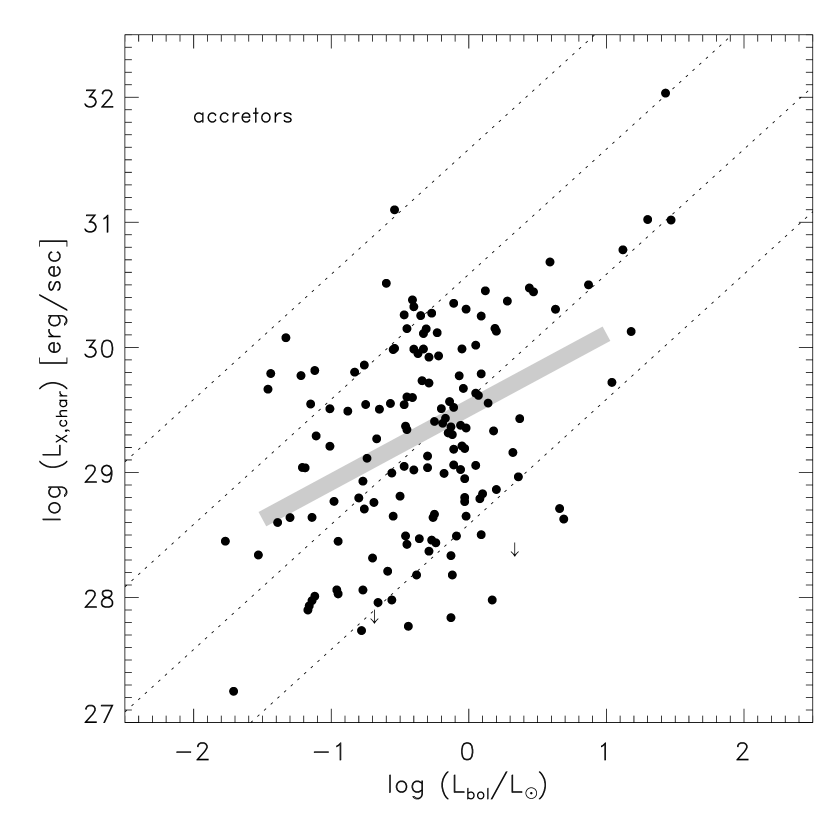
Next we consider the presence/absence of signs for active accretion rather than disks. We follow the strategy of Hillenbrand et al. (1998), who used the equivalent width of the Å Ca II line as an indicator of disk accretion. As they noted, stars without or with very weak accretion are expected to show this line in absorption with Å and a rather weak dependence on the spectral type. In more strongly accreting stars, the line gets filled and the equivalent width should be related to the mass accretion rate. In their analysis of the Chandra HRC data of the ONC, Flaccomio et al. (2003) classified stars as strong accretors if their Ca II line is in emission and has an equivalent width of Å, while stars with the Ca II line in absorption with Å are assumed to be not (or at most very weakly) accreting. Using this scheme, 142 (136) of the objects in our (lightly absorbed) optical sample are classified as strong accretors, and 134 (123) objects as weak or non-accretors. In the following text, we will simply denote these two groups as “accretors” and “non-accretors”.
Flaccomio et al. (2003) found a clear difference in the (fractional) X-ray luminosities of the accretors and non-accretors in their HRC data of the ONC, with the accretors being considerably (about a factor of 2–3) less X-ray bright than the non-accretors. A similar, although less pronounced, effect is found in our COUP data. In Fig. 16 we show the distributions of fractional X-ray luminosities of accreting and non-accreting stars in different mass bins. A significant difference between accretors and non-accretors is only found for the stars, whereas the other mass ranges show only marginal or no evidence at all for a difference in the distribution functions of fractional X-ray luminosities.
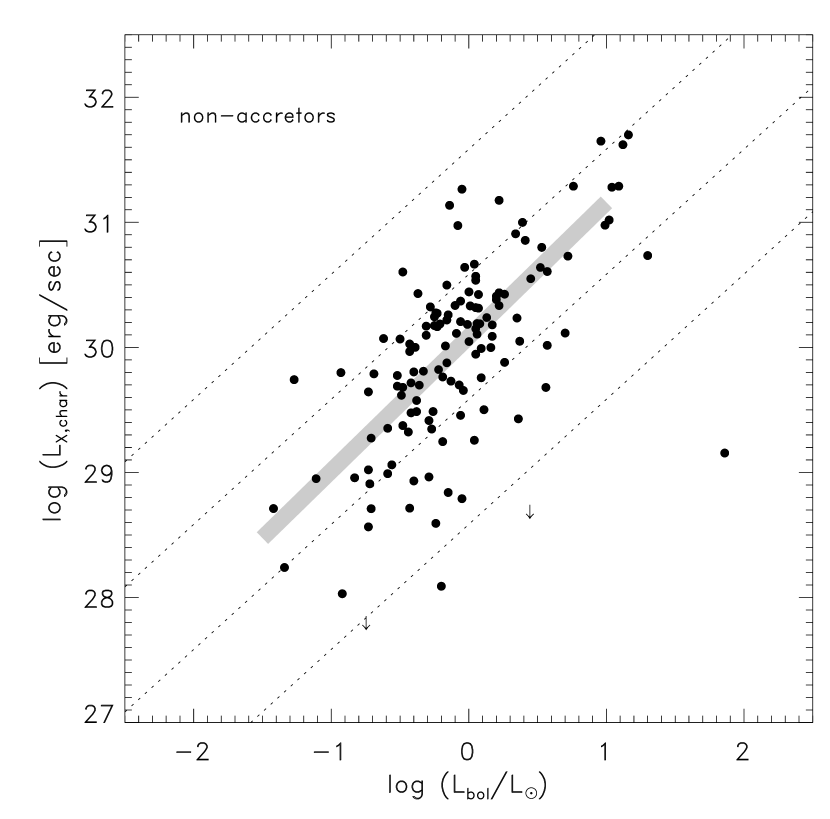
To investigate the difference between accreting and non-accreting stars further, we compare in Fig. 17 the correlations between characteristic X-ray luminosities and the bolometric luminosities for the non-accretors and the accretors. The non-accretors show a very well defined correlation between and , the linear regression fit with the EM algorithm gives a power-law slope and standard deviation of dex in . For the accretors, the correlation is much less well defined; the linear regression fit with the EM algorithm gives a power-law slope and standard deviation of dex in . Very similar results are found for the correlations between characteristic X-ray luminosities and stellar masses for the non-accretors and the accretors.
As discussed in §6, the scatter in the correlations due to X-ray variability, the uncertainties in the variables, and unresolved binaries is expected to be about dex. The standard deviation found for the correlation (or the correlation) for the non-accreting stars agrees well to that expectation, whereas the accreting stars show a considerably larger scatter. Some fraction of this scatter may be due to the fact that the more rapidly accreting stars may have larger errors compared to non-accreting stars in stellar luminosity and effective temperature values due to the effects of accretion on the observables that lead to these quantities.
Another important result is found when considering the mean fractional X-ray luminosities: For the non-accretors, the median value for is , what is in very good agreement to the mean saturation value for rapidly rotating low-mass () field stars derived by Pizzolato et al. (2003). This means that the fractional X-ray luminosities of the non-accreting TTS are consistent to those of much older coronally active field stars. For the accretors, on the other hand, we find a median value for of , which is a factor of about 3 lower than the saturation value for fast rotating low-mass field stars. The accreting TTS therefore are responsible for the “X-ray deficit” of the ONC TTS, i.e. the fact that the median fractional X-ray luminosity of the TTS is lower than that found for rapidly rotating MS stars.
We also looked for possible relations between the X-ray activity and the rotation rates of the accretors and non-accretors. The rotation periods found for the non-accretors and accretors overlap strongly, but the non-accretors show shorter median periods ( days) than the accretors ( days); a KS test gives a probability of only 0.03 that the distribution of periods is identical in both groups. However, neither for the accretors nor for the non-accretors statistically significant correlations are found between activity and rotation. The median fractional X-ray luminosities of the non-accretors and accretors with known rotation period are nearly identical, and . The difference in X-ray activity between accreting and non-accreting stars described above can thus not be explained by differences in their rotation periods or their rotation-activity relations. Considering the relation between X-ray activity and Rossby numbers, we also find no significant correlations for either accretors or non-accretors.
8.3 X-ray activity and accretion rates/luminosities
Robberto et al. (2004) recently determined accretion rates and accretion luminosities for a sample of 40 TTS in the Trapezium cluster from HST - and -band photometry. As the computation of the accretion parameters from the UV excess is quite indirect and involves numerous assumptions, their values have considerable uncertainties; for some of their stars they find even negative values for the accretion luminosities. We therefore restrict us to those 30 stars for which they derived positive values for the accretion luminosity and note that 29 of these are detected as X-ray sources in COUP.
For a considerable fraction of these objects the X-ray luminosities are comparable or even larger than the accretion luminosities; this is a strong argument against the assumption that that the X-ray emission in these TTS is directly created in the accretion process (e.g., comes from the accretion shock; see discussion below). Furthermore, we find a weak anti-correlation of the fractional X-ray luminosity with accretion rate (and also with accretion luminosity); although these correlations are not statistically significant, they agree to the above results based on the Ca line width classification and suggest that active accretion somehow lowers the X-ray activity levels.
8.4 Summary of the relations between X-ray activity and accretion
We find that the TTS with inner circumstellar material as traced by near-infrared excess show slightly higher fractional X-ray luminosities than the TTS without near-infrared excess, but this difference is of only marginal statistical significance. Using the equivalent width of the Ca II line to discern between accreting and non-accreting stars, we find that the non-accretors show very well defined correlations between X-ray luminosity and bolometric luminosity or stellar mass. The accreting stars, on the other hand, produce much poorer correlations between and or stellar mass and much more scatter. Furthermore, the mean fractional X-ray luminosities of the non-accreting TTS are well consistent with those of rapidly rotating MS stars, while the accreting TTS show about 3 times lower levels of X-ray activity. Finally, we have shown that X-ray activity appears to be anti-correlated with mass accretion rate.
In conclusion, the X-ray activity of the non-accreting TTS is consistent with that of rapidly rotating MS stars, while in accreting TTS the X-ray emission is somehow suppressed.
9 Implications on the origin of TTS X-ray emission
In this section we summarize what implications we can derive from our X-ray data on the origin of the observed X-ray emission from the TTS. We will consider the following questions: Where is the X-ray emitting plasma located? What is the reason for the lower X-ray activity of accreting stars in comparison to non-accretors? What is the ultimate origin of the magnetic activity and what kind of dynamo may work in the TTS?
9.1 Location of the X-ray emitting structures
9.1.1 X-ray emission from accretion shocks?
According to the magnetospheric accretion scenario, accreted material crashes onto the stellar surface with velocities of up to several 100 km/sec, what should cause hot ( K) shocks in which strong optical and UV excess emission and perhaps also soft X-ray emission is produced (e.g., Lamzin et al., 1996; Calvet & Gullbring, 1998). The expected characteristics of X-ray emission from accretion shocks would be a very soft spectrum (due to the low plasma temperature in the shock of at most a few MK), and perhaps simultaneous brightness variations at optical/UV wavelengths and in the X-ray band. Although earlier studies failed to find evidence for this scenario (e.g., Gullbring et al., 1997), more recent high-resolution X-ray spectroscopy of some TTS (e.g. TW Hya, XZ Tau and BP Tau, see Kastner et al., 2002; Stelzer & Schmitt, 2004; Favata et al., 2003; Schmitt et al., 2005) yielded plasma temperatures and densities that have been interpreted as evidence for X-ray emission originating from a hot accretion shock.
The COUP results provide no support for a scenario in which X-ray emission is dominated by accretion power. First, we note that many of the accreting TTS show X-ray luminosities considerably larger than their total accretion luminosities. Although we have to be somewhat cautious because the X-ray and accretion rate measurements were not simultaneous and accretion is thought to be strongly time variable, it appears extremely unlikely that the bulk of the observed X-ray emission from the TTS could originate from accretion processes. Second, the COUP spectra of nearly all TTS show much higher plasma temperatures (typically a MK cool component and MK hot component) than the MK expected from shocks for the typical accretion infall velocities. Only for five of the TTS in our optical sample the X-ray spectral fits yielded plasma components with temperatures below 3 MK. For none of these stars accretion rates are known, only two of them show Ca II emission, and only one displays infrared excess. Thus, we cannot determine whether in any of these objects the X-ray emission may be related to accretion shocks. We just note that the low plasma temperatures alone provide no evidence for an accretion shock origin of the X-rays, since similarly low (or even lower) plasma temperatures are found for MS stars and the Sun, i.e. for stars that are certainly not accreting. Furthermore, the COUP lightcurves show thousands of high-amplitude flares whose temporal structure closely resembles solar-type magnetic flares, and is very unlikely to be reproduced by thermal accretion shocks. Indeed, Stassun et al. (2005) have compared these COUP lightcurves with simultaneous optical lightcurves and find very little evidence to suggest that X-ray variability is correlated with accretion-related processes.
Of course, these arguments do not exclude the possibility that accretion shocks may contribute some fraction of the X-ray emission in TTS. It is critical to note that ’s ACIS-I instrument is not very sensitive to the cooler plasma expected from these accretion shocks, and much of this emission may be attenuated by line-of-sight interstellar material. We note that evidence for a scenario of mixed X-ray emission in accreting YSOs has recently come from an X-ray high spectral resolution observation of BP Tau (Schmitt et al., 2005), where hot plasma (too hot to be shock-produced and thus likely magnetically confined and heated in some form of coronal structure) coexists with cool (1–3 MK) plasma for which unusually high densities were inferred, which may be well explained by accretion shock models101010The cool plasma in BP Tau shows a very low value of the ratio between the intensity of the forbidden and intercombination lines () for the O vii triplet, formed at temperatures of 1–3 MK. Low values (also observed in TW Hya, and in no coronal source) can either imply very high densities, or the presence of an intense UV field, as indeed expected within the accretion spot. Too high densities would however be difficult to explain given the pressure structure of an accretion shock, (see Drake, 2005), in which the plasma at cm-3 (the density implied by the value observed in TW Hya) is buried (following e.g. the shock structure and emission models by Calvet & Gullbring 1998) under a column density of typically , that should absorb the soft X-ray emission from the shock zone nearly completely and thermalize the high-energy radiation within or close to the shock..
We conclude that, although accretion shock emission must be present, plays an important role in optical or ultraviolet emission of CTT stars (e.g. Lamzin et al., 1996), and may contribute some fraction of the largely-unobserved soft X-ray emission of TTS, it is not responsible for the bulk of the X-ray emission seen in the COUP data.
9.1.2 X-ray emission from magnetic star-disk interactions?
Another possibility for a non-solar like origin of the X-ray radiation may be plasma trapped in magnetic fields that connect the star with its surrounding accretion disk. The dipolar stellar magnetic field lines anchored to the inner part of the accretion disk should be twisted around because of the differential rotation between the star of the disk. Theoretical work suggests that the twisted field lines periodically reconnect, and the released magnetic energy heats plasma trapped in the field lines to very hot, X-ray emitting temperatures (Hayashi et al. 1996; Montmerle et al. 2000; Isobe et al., 2003; Romanova et al., 2004).
The analysis of the largest flares in COUP data by Favata et al. (2005) suggests that very long magnetic structures (up to a few times cm) are present in some of the most active stars in our sample. Such large structures (tens of times the size of the star) may indicate a magnetic link between these stars and their disks. However, we note that very large loop lengths were derived for only a few of these flares; for the majority of the analyzed flares much smaller loop lengths were found.
Furthermore, our results in the previous sections show that, in general, the X-ray luminosity is strongly linked to stellar parameters like bolometric luminosity and mass, but does not strongly depend on the presence or absence of circumstellar disks as traced by near-infrared excess emission. It is reasonable to conclude that although X-ray emission from magnetic star-disk interactions may be seen during some of the most intense flares, the bulk of the observed X-ray emission from ONC TTS probably originates from more compact structures with geometries resembling solar coronal fields.
9.1.3 X-ray emission from solar-like coronal structures?
Our data are generally consistent with the assumption that the observed X-ray emission originates from, in principle solar-like, coronal structures. The X-ray luminosities and plasma temperatures derived for the ONC TTS are comparable to those of the most active MS stars, and can thus be understood by assuming that stellar coronae in general are composed of X-ray emitting structures similar to those present in the solar corona (e.g. Drake et al. 2000; Peres et al. 2004). Although the high X-ray luminosities of active MS stars and TTS can not be reproduced by simply filling the available coronal volume with solar-like active regions, coronal structures with higher plasma density111111Remember that the emission measure, , scales linearly with the plasma volume , but with the square of the density . can explain the high levels of stellar X-ray activity. Evidence for higher than solar plasma densities is found in high-resolution X-ray and EUV spectra for many active stars (e.g. Sanz-Forcada et al., 2003; Ness et al., 2004). Furthermore, once the stellar coronae get nearly completely filled with active regions, the magnetic interaction of the active regions should lead to increased flaring in the most active stars, boosting their X-ray luminosities even further (Peres et al. 2004).
We also note that the temporal behavior of most flares seen in the COUP data is rather similar to what is seen in flares on the Sun or active MS stars (Wolk et al. 2005). Further evidence suggesting enhanced solar-like coronal activity as the source of the X-ray emission from active MS stars and TTS is summarized e.g., in Feigelson & Montmerle (1999) and Favata & Micela (2003).
9.2 The suppression of X-ray emission by accretion
Our COUP data confirm previous results that accreting TTS show lower levels of X-ray activity than non-accretors (Stelzer & Neuhäuser 2001; Flaccomio et al. 2003; Stassun et al. 2004a). Here we discuss some possible explanations for this effect. Two previously suggested explanations can essentially be ruled out by our data. The first one is the suggestion that the systematically higher extinction of the accreting CTTS (due to absorption in the accretion disk) may be responsible for their weaker observed X-ray emission as compared to the WTTS (e.g. Stassun et al., 2004a). In our COUP data, individual extinction-corrected X-ray luminosities could be determined in a self-consistent fitting analysis of the individual X-ray spectra. The different levels of extinction in the accreting and non-accreting stars should not lead to errors in the extinction-corrected X-ray luminosities.
We can also exclude the idea that accreting TTS are weaker X-ray emitter because their rotation is braked by magnetic disk locking, leading to weaker dynamo action and therefore less X-ray emission than in the non-braked WTTS. We have shown in §5.1 that neither the accretors nor the non-accretors show a relation between rotation and X-ray activity, and thus the difference in rotation rates cannot be the reason for the difference in the level of X-ray emission.
9.2.1 Accretion changes the magnetic field structure?
Numerical simulations suggest that the pressure of the accreting material can distort the large-scale stellar magnetic field considerably (e.g. Miller & Stone, 1997; Romanova et al., 2004) and the magnetospheric transfer of material to the star can give rise to instabilities of the magnetic fields around the inner disk edge and cause reconnection events. The presence of accreting material also leads to higher densities in (parts of) the magnetosphere. In contrast to the WTTS, which probably have loops with moderate plasma densities, some fraction of the magnetic field lines in CTTS would be mass loaded and therefore have much higher densities. If now a magnetic reconnection event liberates a certain amount of energy, this can heat the plasma in the low-density loops of WTTS to X-ray emitting temperatures ( MK), while the denser plasma in the mass loaded loops of the CTTS would be only heated to much lower temperatures, and remain too cool to emit X-rays. This effect may cause the lower X-ray luminosities of the CTTS as compared to WTTS.
However, a more quantitative assessment of this model is difficult. According to magnetospheric accretion models, the fraction of the stellar surface that is covered by accretion funnels should be at most a few percent (e.g., Calvet & Gullbring, 1998; Muzerolle et al., 2001). This may be a too small fraction to explain the reduction of the X-ray luminosity by a factor of . On the other hand, we note that the estimates of the area of accretion funnels are uncertain, and other factors like global changes in the topology of the magnetic field may play a (more?) important role. It therefore seems possible that magnetospheric accretion streams are somehow related to the different X-ray activity levels of accreting and non-accreting stars.
It is also interesting to note that the analysis of the largest flares in the COUP data by Favata et al. (2005) seems to indicate that intense, active accretion may inhibit magnetic heating of the accreting plasma, while in stars which are not actively accreting the long magnetic structures may acquire a “coronal” character.
9.2.2 Accretion changes the stellar structure?
The accretion process may alter the internal stellar structure and the differential rotation patterns, and thereby influence the magnetic field generation process. For example, Siess, Forestini, & Bertout (1999) found in their stellar evolution calculations that accretion reduces the efficiency of convection. This theoretical result agrees with another finding based on comparison of orbital masses of PMS stars with evolution models by Stassun et al. (2004b), who found that TTS seem to have lower convection efficiencies than MS stars. The reduced convection efficiency may lead to weaker dynamo action.
Another effect may be that the magnetospheric star-disk coupling affects the differential rotation pattern at the stellar surface. If the coupling happens closer to the stellar equator than to the poles, the magnetospheric braking effect thought to be at work in CTTS may reduce the amount of differential rotation, and this also may decrease the efficiency of the dynamo.
9.3 Implications for pre-MS magnetic dynamos
The MS activity-rotation relation is well-established in stars (e.g., Pallavicini et al., 1981; Pizzolato et al., 2003) and is usually interpreted in terms of the -type dynamo that is thought to work in the Sun. A simplified description of the rather complicated processes by which this dynamo generates surface magnetic fields can be summarized as follows (for details see, e.g., Schrijver & Zwaan, 2000; Ossendrijver, 2003): The strong differential rotation in the tachocline, a region near the bottom of the convection zone in which the rotation rate changes from being almost uniform in the radiative interior to being latitude dependent in the convection zone, generates strong toroidal magnetic fields. While most of the toroidal magnetic flux is stored and further amplified in the tachocline, instabilities expel individual flux tubes, which then rise through the convection zone, driven by magnetic buoyancy, until they emerge at the surface as active regions. The power of the dynamo (i.e. the magnetic energy created by the dynamo per unit time) depends only indirectly on the rotation rate. The dynamo is principally dependent on the radial gradient of the angular velocity in the tachocline and the characteristic scale length of convection at the base of the convection zone. The empirical relationship between X-ray luminosity and rotation rate in MS stars does therefore not mean that the power of the dynamo scales with rotation rate, but rather that faster rotating stars have stronger velocity shear in the thin tachoclinal layer between the radiative core and the outer convective zone.
The presence of an -type dynamo at the bottom of the convection zone does not prevent other dynamo processes from also operating in a star. In the Sun, small scale turbulent dynamo action (e.g. Durney et al., 1993) is taking place throughout the convection zone and is thought to be responsible for the small-scale intra-network fields. Recent results (Bueno et al., 2004) suggest that the total magnetic flux generated by the small-scale turbulent dynamo action is much larger than previously assumed. This means that two conceptually distinct magnetic dynamos are simultaneously operating in the contemporary Sun. In the case of the Sun, the coronal activity is most likely dominated by the tachoclinal dynamo action. Most of the ONC TTS, however, are thought to be fully convective, or nearly fully convective, so the tachoclinal layer is either buried very deeply, or does not exist at all. It is therefore reasonable to assume that in these (nearly) fully convective TTS, a convective dynamo is the main source of the magnetic activity.
An interesting possible alternative explanation may be that the conventional wisdom, i.e. that TTS are fully convective, is not correct. We note that several studies have shown that accretion can significantly change the stellar structure. For example, Prialnik & Livio (1985) found that even for moderate accretion rates the stars are no longer fully convective. More recently, Wuchterl & Tscharnuter (2003) found that accreting PMS stars are not fully convective; their model of a solar mass star at 1 Myr has a radiative core and a convective envelope, resembling the present Sun rather than a fully convective object. These results open the possibility for a solar-type tachoclinal dynamo to work in the TTS. Our results on the relation between X-ray activity and Rossby number are not inconsistent with that possibility.
We provide in this study various empirical relationships of the X-ray luminosities with, e.g., stellar mass, or bolometric luminosity, which should also be relevant to the dynamos operating in TTS. A purely empirical explanation of these correlations is given by the existence of upper and lower limits to the X-ray activity levels, in analogy to results for MS stars. The upper limit is caused by the saturation level of magnetic activity around (e.g., Pizzolato et al., 2003). A lower limit is suggested by studies of nearby field stars, that led to the conclusion that all cool dwarf stars are surrounded by X-ray emitting coronae with a minimum X-ray surface flux of about (Schmitt, 1997; Schmitt & Liefke, 2004); for early M-type TTS in the ONC this surface flux corresponds to . The restriction of to the range between about and leads to correlation between X-ray luminosity and bolometric luminosity; the correlation between X-ray luminosity and stellar mass can then be explained by the dependence of bolometric luminosity on stellar mass. An alternative explanation for the correlations can be based on the finding that the fractional X-ray luminosities increase with stellar mass (§4.2). This is consistent with the results of Pizzolato et al. (2003), who showed that in low-mass MS stars the saturation level in increases with stellar mass. These results suggest a similar origin of X-ray activity in the TTS and MS stars, and thus provide support for the standard solar-type-dynamo model for TTS X-ray emission.
10 Summary
The main results from our study of the X-ray properties of the TTS in the ONC can be summarized as follows:
In the COUP data we detect X-ray emission from essentially every late-type (F to M) ONC star. There is no indication for the existence of an “X-ray quiet” population of stars with suppressed magnetic activity. We find that the X-ray luminosities of the TTS are correlated to bolometric luminosities, stellar masses, and effective temperatures. The correlation for the TTS shows a slope similar to the corresponding correlation for MS stars, which is probably related to the association between mass and MS X-ray saturation levels. Together, these lines of evidence suggest that the relationship may be more physically fundamental than X-ray relationships to bolometric luminosity, surface area, or rotation.
Our data indicate a correlation between X-ray activity and rotation period, apparently in strong contrast to the well established anti-correlation seen for MS stars. However, the efficacy of our analysis is limited since rotation periods are only known for about 40% of the TTS in our sample, and the missing stars (i.e. those with unknown rotation periods) probably introduce a bias. If we consider Rossby numbers, we find that all TTS are located in the saturated or super-saturated regime of the activityRossby number relation for MS stars. In principle, the TTS may thus follow the same relation between X-ray activity and Rossby number as MS stars, but the large scatter in at any given Rossby number suggests that other factors are also involved in determining the level of X-ray activity.
The enormous scatter we generally find in the correlations between X-ray activity and other stellar parameters is larger than what one would expect due to X-ray variability, uncertainties in the variables, and the effects of unresolved binaries. Therefore, this wide scatter must be related to intrinsic differences in the individual TTS, and we find here that the influence of accretion on the X-ray emission seems to play an important role. There is a remarkable contrast between the X-ray properties of accreting and non-accreting stars: Our data confirm previous results that accreting stars are less X-ray active than non-accreting stars (although a statistically significant difference is only found for stars in the mass range) and suggest an anti-correlation between fractional X-ray luminosity and accretion rate. The non-accreting TTS have the same median X-ray activity level as rapidly rotating MS stars and show good and correlations with a scatter as expected from the uncertainties, X-ray variability, and unresolved binaries. The accreting TTS, on the other hand, show about 3 times lower X-ray activity levels and produce much less well defined and correlations with much wider scatter. These findings imply that the apparent X-ray deficit of the whole TTS sample (i.e. the median fractional X-ray luminosity of , which is below the saturation limit around typically found for rapidly rotating MS stars) is solely due to the reduced X-ray activity of the accreting TTS.
We discuss several possible explanations for the suppression of X-ray emission in accreting stars. The effect may be related to changes of the coronal structure or the internal stellar structure induced by the accretion process. We favor the idea that magnetic reconnection can not heat the dense plasma in mass-loaded accreting field lines to X-ray temperatures.
The geometry of X-ray producing magnetic fields is also still uncertain. Solar-type coronal loops are probably the dominant source of the observed X-ray emission. However, we note that the study of the most powerful flares seen in COUP stars (Favata et al. 2005) suggests that in some objects star-disk field lines extending from the stellar surface may be involved. Accretion shocks at the stellar surface can not be responsible for the emission seen in COUP sources. Finally, the ultimate origin of the X-ray activity of the TTS is most likely either a turbulent dynamo working in the stellar convection zone, or, if theoretical suggestions that accreting TTS may not be fully convective are correct, a solar-like dynamo at the base of the convection zone.
References
- Alexander & Ferguson (1994) Alexander, D. R., & Ferguson, J. W. 1994, ApJ, 437, 879
- Alcalá et al. (1996) Alcalá, J. M. et al. 1996, A&AS, 199, 7
- D’Antona et al. (2000) D’Antona, F., Ventura, P., Mazzitelli, I, 2000, ApJ, 543, L77
- Aschwanden et al. (2001) Aschwanden, M.J., Poland, A.I., Rabin, D.M. 2001, ARA&A, 39, 175
- Bahcall & Pinonneault (1992) Bahcall, J. N., & Pinonneault, M. H. 1992, Rev.Mod.Phys., 60, 297
- Bahcall et al. (2004) Bahcall, J. N., Serenelli, A.M., & Pinonneault, M. H. 2004, ApJ, 614, 464
- Barnes (2003a) Barnes, S. A. 2003a, ApJ, 586, 464
- Barnes (2003b) Barnes, S. A. 2003b, ApJ, 586, L145
- Brickhouse et al. (2000) Brickhouse, N.S., Dupree, A.K., Edgar, R.J., et al. 2000, ApJ, 530, 387
- Briggs & Pye (2003) Briggs, K.R. & Pye, J.P. 2003, MNRAS, 345, 714
- Bueno et al. (2004) Bueno, J.T., Shchukina, N., Ramos, A.A. 2004, Nature, 430, 326
- Calvet & Gullbring (1998) Calvet, N., & Gullbring, E. 1998, ApJ, 509, 802
- Casanova et al. (1995) Casanova, S., Montmerle, T., Feigelson, E.D., & André, P. 1995, ApJ, 439, 752
- Drake (2005) Drake, J. 2005, in Proceedings of the 13th Cool Stars and Stellar Systems Workshop, F. Favata & G. Hussain (eds.), ESA-SP 590, in press
- Durney et al. (1993) Durney, B.R., De Young, D.S., Roxburgh, I.W. 1993, SolPhys, 145, 2070
- Favata & Micela (2003) Favata, F. & Micela, G. 2003, Space Science Reviews, 108, 577
- Favata et al. (2003) Favata, F., Giardino, G., Micela, G., Sciortino, S., Damiani, F. 2003, A&A, 403, 187
- Favata et al. (2004) Favata, F., Micela, G., Baliunas, S.L., et al. 2004, A&A, 418, L13
- Favata et al. (2005) Favata F. et al. 2005, ApJS, COUP special issue
- Feigelson & Babu (1992) Feigelson, E.D., & Babu, G.J. 1992, ApJ, 397, 55
- Feigelson & DeCampli (1981) Feigelson, E.D., & DeCampli, W.M. 1981, ApJ, 243, L89
- Feigelson & Nelson (1985) Feigelson, E. D. and Nelson, P. I. 1985, ApJ, 293, 192
- Feigelson & Montmerle (1999) Feigelson, E. D. & Montmerle, T. 1999, ARA&A, 37, 363
- Feigelson et al. (1993) Feigelson, E.D., Casanova, S., Montmerle, T., & Guibert, J. 1993, ApJ, 416, 623
- Feigelson et al. (2002a) Feigelson, E. D., Broos, P., Gaffney, J. A., Garmire, G., Hillenbrand, L. A., Pravdo, S. H., Townsley, L., & Tsuboi, Y. 2002a, ApJ, 574, 258
- Feigelson et al. (2002b) Feigelson, E. D., Garmire, G. P., & Pravdo, S. H. 2002b, ApJ, 572, 335
- Feigelson et al. (2003) Feigelson, E. D., Gaffney, J. A., Garmire, G., Hillenbrand, L. A., & Townsley, L. 2003, ApJ, 584, 911
- Flaccomio et al. (2003a) Flaccomio, E., Damiani, F., Micela, G., Sciortino, S., Harnden, F. R., Murray, S. S., & Wolk, S. J. 2003, ApJ, 582, 382
- Flaccomio et al. (2003b) Flaccomio, E., Damiani, F., Micela, G., Sciortino, S., Harnden, F. R., Murray, S. S., & Wolk, S. J. 2003b, ApJ, 582, 398
- Flaccomio et al. (2005) Flaccomio, E., et al. 2005, ApJ, COUP special issue
- Fleming et al. (1995) Fleming, T.A., Schmitt, J.H.M.M., & Giampapa, M.S. 1995, ApJ, 450, 401
- Fleming et al. (1988) Fleming, T.A., Liebert, J., Giao, I.M., Maccacaro, M. 1988, ApJ, 331, 958
- Gagné et al. (1995) Gagné, M., Caillault, J.-P. & Stauffer, J. R. 1995, ApJ, 445, 280
- Garmire et al. (2000) Garmire, G., Feigelson, E. D., Broos, P., Hillenbrand, L. A., Pravdo, S. H., Townsley, L., & Tsuboi, Y. 2000, AJ, 120, 1426
- Geier et al. (1995) Geier, S., Wendker, H. J. & Wisotzki, L. 1995, A&A, 229, 39
- Getman et al. (2005a) Getman, K. V. et al. 2005a, ApJS, COUP special issue
- Getman et al. (2005b) Getman, K. V. et al. 2005b, ApJS, COUP special issue
- Giampapa et al. (1996) Giampapa, M.S., Rosner, R., Kashyap, V., Fleming, T.A., Schmitt, J.H.M.M., & Bookbinder, J.A. 1996, ApJ, 463, 707
- Gilliland (1986) Gilliland, R. L. 1986, ApJ, 300, 339
- Glassgold, Feigelson & Montmerle (2000) Glassgold, A. E., Feigelson, E. D., & Montmerle, T. 2000, in Protostars and Planets IV, 429
- Grevesse & Noels (1993) Grevesse, N., & Noels, A. 1993, in Orign and Evolution of the Elements, eds. N. Prantzos, E. Vangioni-Flam, and M. Casse (Cambridge: Cambridge Univ. Press), 14
- Grevesse et al. (1996) Grevesse, N., Noels, A., & Sauval, A. J. 1996, in Cosmic Abundances, eds. S. S. Holt and G. Sonneborn (San Francisco: ASP), 117
- Grosso et al. (2005) Grosso, N., et al. 2005, ApJS, COUP special issue
- Güdel (1997) Güdel, M., Guinan, E.F., Skinner, S.L. 1997, ApJ, 483, 947
- Gullbring et al. (1997) Gullbring, E., Barwig, H., Schmitt, J.H.M.M. 1997, A&A, 324, 155
- Haisch et al. (2001) Haisch, K.E., Lada, E.A., Pina, R.K., Telesco, C.M., & Lada, C.J. 2001, AJ, 121, 1512
- Hardi et al. (2004) Hardi, P., Gudiksen, B.V., Nordlund, A. 2004, ApJ, 617, L85
- Hayashi et al. (1996) Hayashi, M.R., Shibata, K., Matsumoto, R. 1996, ApJ, 468, L37
- Herbig & Terndrup (1986) Herbig G.H., Terndrup D.M. 1986, ApJ, 307, 609
- Herbst et al. (2002) Herbst, W., Bailer-Jones, C. A. L., Mundt, R., Meisenheimer, K., & Wackermann, R. 2002, A&A, 396, 513
- Hillenbrand (1997) Hillenbrand, L. A. 1997, AJ, 113, 1733
- Hillenbrand et al. (1998) Hillenbrand, L. A., Strom, S. E., Calvet, N., Merrill, K. M., Gatley, I., Makidon, R. B., Meyer, M. R., & Skrutskie, M. F. 1998, AJ, 116, 1816
- Hillenbrand & Carpenter (2000) Hillenbrand, L. A. & Carpenter, J. M. 2000, ApJ, 540, 236
- Hillenbrand & White (2004) Hillenbrand, L. A. & White, R. J. 2004, ApJ, 604, 741
- Iglesias & Rogers (1996) Iglesias, C. A., & Rogers, F.J. 1996, ApJ, 464, 943
- Isobe et al. (1990) Isobe, T., Feigelson, E. D., Akritas, M.G., & Babu, G.J. 1990, ApJ, 364, 104
- Isobe et al. (1986) Isobe, T., Feigelson, E. D., & Nelson, P. I. 1986, ApJ, 306, 490
- Isobe et al. (2003) Isobe, H.,Shibata, K., Yokoyama, T., Imanishi, K. 2003, PASJ, 55, 967
- Itoh et al. (1989) Itoh, N., Adachi, T., Nagakawa, M., Kohyama, Y., & Munakata, H. 1989, ApJ, 339, 354 (erratum 360, 741)
- Judge et al. (2003) Judge, P.G., Slomon, S.C., Ayres, T.R. 2003, ApJ, 593, 534
- Kastner et al. (2002) Kastner, J. H., Huenemoerder, D. P., Schulz, N. S., Canizares, C. R., & Weintraub, D. A. 2002, ApJ, 567, 434
- Kim & Demarque (1996) Kim, Y.-C., & Demarque, P. 1996, ApJ, 457, 340
- Kim et al. (1996) Kim, Y.-C., Fox, P.A., Demarque, P., & Sofia, S. 1996, ApJ, 461, 499
- Ku & Chanan (1979) Ku, W. H.-M. & Chanan, G. A. 1979, ApJ, 234, L59
- Küker & Rüdiger (1999) Küker, M., & Rüdiger, G. 1999, A&A, 346, 922
- Lamzin et al. (1996) Lamzin, S.A., Bisnovatyi-Kogan, G.S., Errico, L., et al. 1996, A&A, 306, 877
- LaValley et al. (1990) LaValley, M., Isobe, T. and Feigelson, E.D. 1990, Bulletin American Astronomical Society (Software Reports), 22, 917
- Luhman (1999) Luhman, K.L. 1999, ApJ, 525, 466
- Luhman et al. (2000) Luhman, K. L., Rieke, G. H., Young, E. T., et al. 2000, ApJ, 540, 1016
- Maggio et al. (1987) Maggio, A., Sciortino, S., Vaiana, G.S., et al. 1987, ApJ, 315, 687
- Matsumura & Pudritz (2003) Matsumura, S. & Pudritz, R. E. 2003, ApJ, 598, 645
- McCaughrean & Stauffer (1994) McCaughrean, M. J. & Stauffer, J. R. 1994, AJ, 108, 1382
- Messina et al. (2003) Messina, S., Pizzolato, N., Guinan, E.F., & and Rodono, M. 2003, A&A, 410, 671
- Micela & Marino (2003) Micela, G., & Marino, A. 2003, A&A, 404, 637
- Miller & Stone (1997) Miller, K.A., & Stone, J.M. 1997, ApJ, 489, 890
- Montesinos et al. (2001) Montesinos, B., Thomas, J.H., Ventura, P., &Mazzitelli, I. 2001, MNRAS, 326, 877
- Montmerle et al. (2000) Montmerle, T., Grosso, N., Tsuboi, Y., Koyama, K. 2000, ApJ, 352, 1097
- Mullan & MacDonald (2001) Mullan, D.J., MacDonald, J. 2001, ApJ, 559, 353
- Muzerolle et al. (2001) Muzerolle, J., Calvet, N., Hartmann, L. 2001, ApJ, 550, 944
- Neuhäuser (1997) Neuhäuser, R. 1997, Science, 267, 1363
- Neuhäuser et al. (1995) Neuhäuser, R., Sterzik, M.F., Schmitt, J.H.M.M., Wichmann, R., Krautter, J. 1995, A&A, 297, 391
- Ness et al. (2004) Ness, J.-U., Güdel, M., Schmitt, J.H.M.M., Audard, M., & Telleschi, A. 2004, A&A, 427, 667
- O’Dell (2001) O’Dell, C.R. 2001, ARA&A, 39, 99
- Orlando et al. (2004) Orlando, S., Peres, G.,& Reale, F. 2004, A&A, 424, 677
- Ossendrijver (2003) Ossendrijver, M. 2003, A&A Rev., 11, 287
- Palla & Stahler (1993) Palla, F., & Stahler, S.W. 1993, ApJ, 418, 414
- Palla & Stahler (1999) Palla, F., & Stahler, S.W. 1993, ApJ, 525, 772
- Pallavicini et al. (1981) Pallavicini, R., Golub, L., Rosner, R., Vaiana, G.S., Ayres, T., & Linsky, J.L. 1981, ApJ248, 279
- Peres et al. (2004) Peres, G., Orlando, S., & Reale, F. 2004, ApJ, 612, 472
- Pevtsov et al. (2003) Pevtsov, A.A., Fisher, G.H., Acton, L.W. 2003, ApJ, 598, 1387
- Pillitteri et al. (2004) Pillitteri, I., Micela, G., Sciortino, S., Damiani, F., & Harnden Jr., F.R. 2004, A&A, 421, 175
- Pizzolato et al. (2003) Pizzolato, N., Maggio, A., Micela, G., Sciortino, S., & Ventura, P. 2003, A&A, 397, 147
- Preibisch (1997) Preibisch, Th. 1997, A&A, 320, 525
- Preibisch & Zinnecker (2002) Preibisch, Th. & Zinnecker, H. 2002, AJ, 123, 1613
- Preibisch & Feigelson (2005) Preibisch, Th., & Feigelson, E.D. 2005, ApJS, COUP special issue
- Preibisch, Zinnecker, & Herbig (1996) Preibisch, Th., Zinnecker, H., & Herbig, G.H. 1996, A&A, 310, 456
- Preibisch et al. (2005) Preibisch, Th. et al. 2005, ApJS, COUP special issue
- Prialnik & Livio (1985) Prialnik, D., & Livio, M. 1985, MNRAS, 216, 37
- Robberto et al. (2004) Robberto, M., Song, J., Mora Carrillo, G., Beckwith, S.V.W., Makidon, R.B., Panagia, N. 2004, ApJ, 606, 952
- Rogers et al. (1996) Rogers, F.J., Swenson, F.J., & Iglesias, C.A. 1996, ApJ, 456, 902
- Romanova et al. (2004) Romanova, M.M., Ustyugova, G.V., Koldoba, A.V., Lovelace, R.V.E. 2004, ApJ, 616, L151
- Sanz-Forcada et al. (2003) Sanz-Forcada, J., Brickhouse, N.S., Dupree, A.K. 2003, ApJS, 145, 147
- Schmitt (1997) Schmitt, J.H.M.M. 1997, A&A, 318, 215
- Schmitt & Liefke (2004) Schmitt, J.H.M.M., & Liefke, C. 1993, A&A, 417, 651
- Schmitt et al. (1993) Schmitt, J.H.M.M., Zinnecker, H., Cruddace, R., & Harnden, F.R. 1993, ApJ, 402, L13
- Schmitt et al. (2005) Schmitt J.H.M.M., Robrade J., Ness J.-U., Favata F., Stelzer B. 2005, A&A, 432, L35
- Schrijver & Zwaan (2000) Schrijver, C.J., Zwaan, C. 2000, Solar and stellar magnetic activity, New York: Cambridge University Press
- Schrijver et al. (2004a) Schrijver, C.J., Sandman, A.W., Aschwanden, M.J., DeRosa, M.L. 2004, ApJ, 615, 512
- Schrijver et al. (2004b) Schrijver, C.J., Title, A.M. 2004, ApJ, 619, 1077
- Schulz et al. (2000) Schulz, N. S., Canizares, C. R., Huenemoerder, D., & Lee, J. C. 2000, ApJ, 545, L135
- Schulz et al. (2001) Schulz, N. S., Canizares, C., Huenemoerder, D., Kastner, J. H., Taylor, S. C., & Bergstrom, E. J. 2001, ApJ, 549, 441
- Schulz et al. (2003) Schulz, N. S., Canizares, C., Huenemoerder, D., & Tibbets, K. 2003, ApJ, 595, 365
- Siess, Forestini, & Bertout (1999) Siess, L., Forestini, M., & Bertout, C. 1999, A&A, 342, 480
- Siess, Dufour, & Forestini (2000) Siess, L., Dufour, E., & Forestini, M. 2000, A&A, 358, 593
- Skinner et al. (2003) Skinner, S., Gagné, M., & Belzer, E. 2003, ApJ, 598, 375
- Stassun et al. (2004a) Stassun, K.G., Ardila, D.R., Barsony, M., Basri, G., & Mathieu, R.D. 2004a, AJ, 127, 3537
- Stassun et al. (2004b) Stassun, K.G., Mathieu, R.D., Vaz, L.P.R., Stroud, N., & Vrba, F.J. 2004b, ApJS, 151, 357
- Stassun et al. (2005) Stassun, K.G., et al., ApJ, submitted
- Stelzer & Neuhäuser (2001) Stelzer, B., Neuhäuser, R. 2001, A&A, 377, 538
- Stelzer & Schmitt (2004) Stelzer, B., & Schmitt, J.H.M.M. 2004, A&A, 418, 687
- Stelzer et al. (2005) Stelzer, B., et al. 2005, ApJS, COUP special issue
- Thoul et al. (1994) Thoul, A.A., Bahcall, J.N., & Loeb, A. 1994, ApJ, 421, 828
- Vuong et al. (2003) Vuong, M. H., Montmerle, T., Grosso, N., Feigelson, E. D., Verstraete, L., & Ozawa, H. 2003, A&A, 408, 581
- Walsh & Ireland (2003) Walsh, R.W., & Ireland, J. 2003, A&A Rev., 12, 1
- Walter et al. (1988) Walter, F.M., Brown, A., Mathieu, R.D., Myers, P.C. 1988, AJ, 96, 297
- Wolk et al. (2005) Wolk, S., et al. 2005, COUP special issue
- Wuchterl & Tscharnuter (2003) Wuchterl, G., & Tscharnuter, W.M. 2003, A&A, 398, 1081
- Yamauchi et al. (1996) Yamauchi, S., Koyama, K., Sakano, M., Okada, K. 1996, PASJ, 48, 719
- Yi et al. (2001) Yi, S., Demarque, P., Kim, Y.-C., Lee, Y.W., Ree, C.H., Lejeune, T., & Barnes, S. 2001, ApJS, 136, 417
| Spectral type | O | B | A | F | G | K | M0–6.5 | all |
|---|---|---|---|---|---|---|---|---|
| detections | 2 | 11 | 3 | 1 | 8 | 133 | 441 | 598 |
| non-detections | 0 | 1 | 3 | 0 | 0 | 8 | 29 | 41 |
| 100% | 91.7% | 50.0% | 100% | 100.0% | 94.3% | 93.6% | ||
| confusion | 0 | 0 | 2 | 0 | 0 | 6 | 17 | 24 |
| 100% | 91.7% | 75% | 100% | 100% | 98.5% | 97.3% | ||
| In the lightly absorbed optical sample: | ||||||||
| detections | 2 | 11 | 2 | 1 | 7 | 117 | 414 | 554 |
| non-detections | 0 | 1 | 3 | 0 | 0 | 3 | 26 | 32 |
| 100% | 91.7% | 40.0% | 100% | 100% | 97.5% | 94.1% | 94.5% | |
| confusion | 0 | 0 | 2 | 0 | 0 | 3 | 15 | 19 |
| 100% | 91.7% | 66.7% | 100% | 100% | 100% | 97.4% | 97.7% | |
Note. — is the detection fraction. is the detection fraction if objects with non-detections due to X-ray confusion are removed from the sample, which gives the fraction of objects that are below the X-ray detection limit. The COUP undetected K6-star H97-9320, which lies far (2.7 mag) below the ZAMS in the HR-diagram, has been removed from the optical sample.

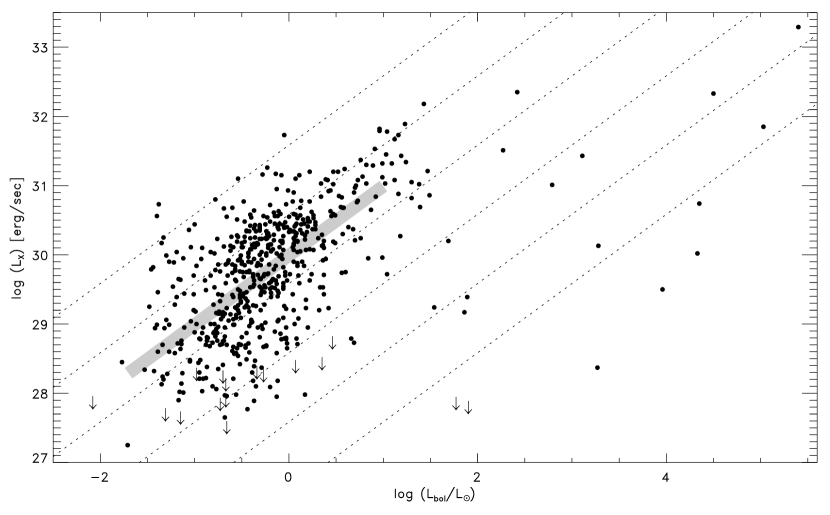
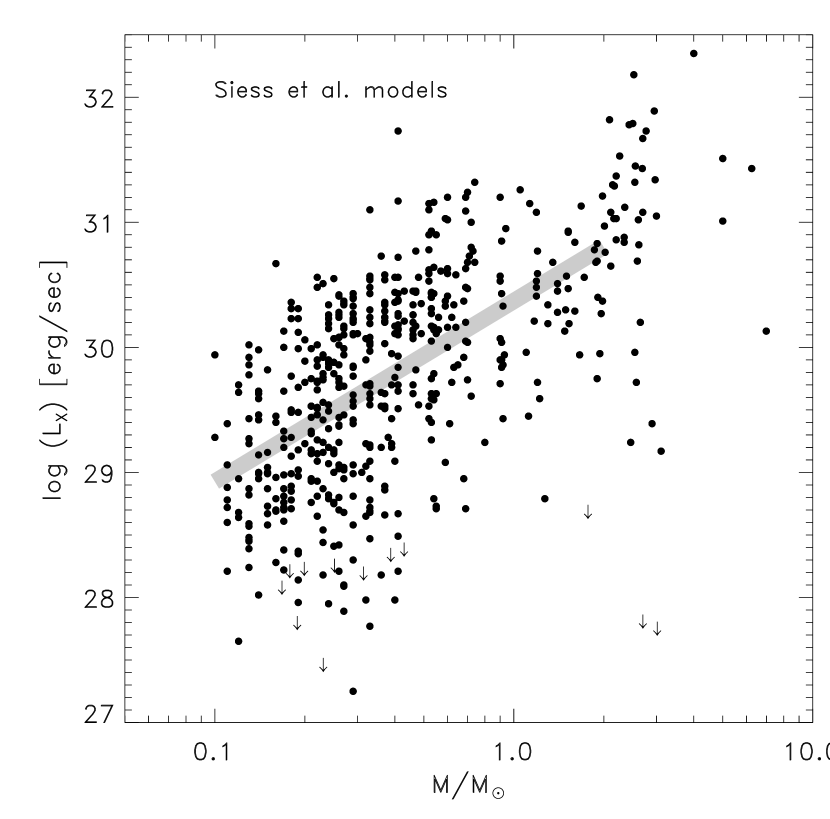


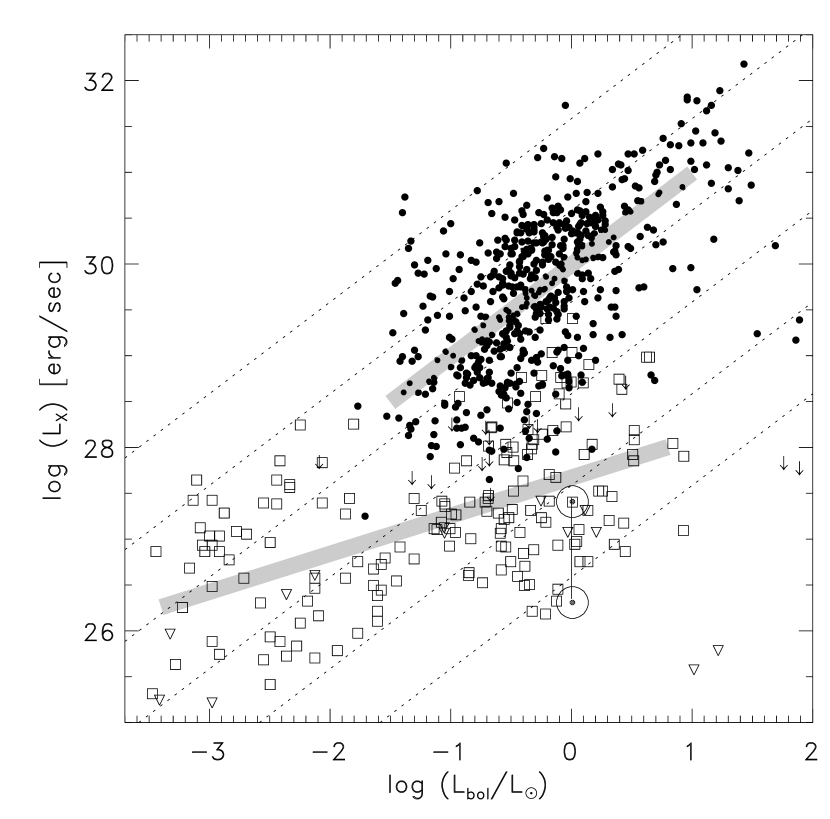
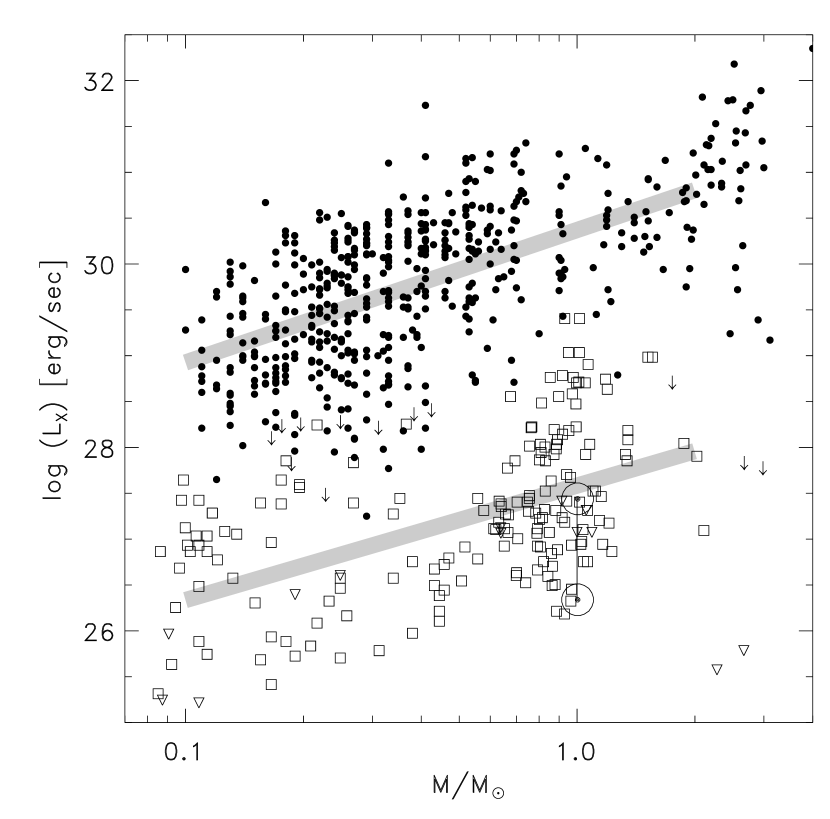


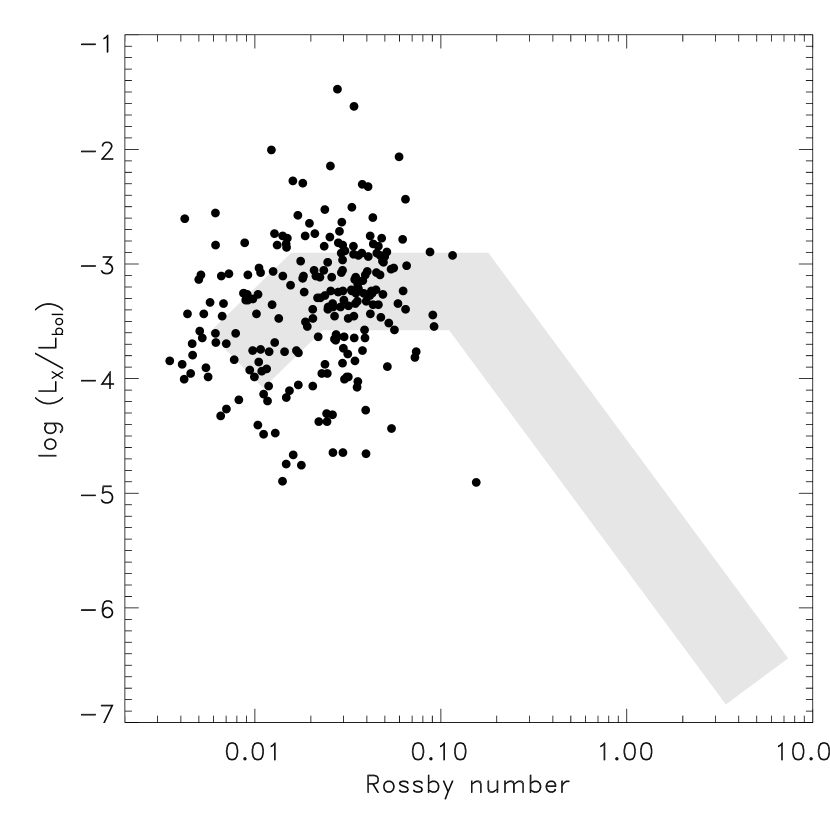


Right: Emission measure ratio of hot and cool plasma component versus the X-ray surface flux.