The INT/WFC survey of the Monoceros Ring: Accretion origin or Galactic Anomaly?
Abstract
We present the results of a wide-field camera survey of the stars in the Monoceros Ring, thought to be an additional structure in the Milky Way of unknown origin. Lying roughly in the plane of the Milky Way, this may represent a unique equatorial accretion event which is contributing to the Thick Disk of the Galaxy. Alternatively, the Monoceros Ring may be a natural part of the Disk formation process. With ten pointings in symmetric pairs above and below the plane of the Galaxy, this survey spans 90 degrees about the Milky Way’s equator. Signatures of the stream of stars were detected in three fields, (l,b) = (118,+16)∘ and (150,+15)∘ plus a more tentative detection at (150,-15)∘. Galactocentric distance estimates to these structures gave 17, 17, and 13 kpc respectively. The Monoceros Ring seems to be present on both sides of the Galactic plane, in a form different to that of the Galactic warp, suggestive of a tidal origin with streams multiply wrapping the Galaxy. A new model of the stream has shown a strong coincidence with our results and has also provided the opportunity to make several more detections in fields in which the stream is less significant. The confirmed detection at (l,b) = (123,-19)∘ at 14, kpc from the Galactic centre allows a re-examination revealing a tentative new detection with a Galactocentric distance of 21 kpc. These detections also lie very close to the newly discovered structure in Triangulum-Andromedae hinting of a link between the two. The remaining six fields are apparently non-detections although in light of these new models, closer inspection reveals tentative structure. With the overdensity of M-giant stars in Canis Major being claimed both as a progenitor to the Monoceros Ring and alternatively a manifestation of the Milky Way warp, much is still unknown about this structure and its connection to the Monoceros Ring. Further constraints are needed for the numerical simulations to adequately resolve the increasingly complex view of this structure.
keywords:
Galaxy: formation – Galaxy: structure – galaxies: interactions1 Introduction
The formation and evolution of galaxies remains one of the big questions in astronomy. In the currently favoured CDM model, galaxies are built up over time via the accretion of smaller systems (e.g. Searle & Zinn, 1978; White & Rees, 1978; White, 1978; Abadi, Navarro, Steinmetz, & Eke, 2003a, b). The picture is not wholly satisfactory and some parts of the Milky Way may have formed in an initial collapse of baryonic material, somewhat akin to the model of galaxy formation proposed by Eggen, Lynden-Bell, & Sandage (1962).
One firm prediction of the CDM model is that this accretion of smaller systems should still be ongoing and that the Milky Way Halo should contain a large number of satellite systems. It has been suggested that, given the model, there are too few satellites actually within the Milky Way Halo (Klypin, Kravtsov, Valenzuela, & Prada, 1999), although the extent of this discrepancy has been a matter of some debate. Many attempts have been made to resolve this issue (e.g. Moore, 2001) by correcting the measured velocity dispersion of the local satellites to a velocity dispersion of the dark matter components, while more recently Susa & Umemura (2004) used numerical methods to highlight a scenario whereby these low mass systems are evaporated at the Epoch of Re-ionization. In the meantime, more and more surveys are probing the Halo of the Milky Way revealing structures which may point to the formation history of our galaxy (see Freeman & Bland-Hawthorn, 2002).
The tidal dismemberment of a dwarf galaxy as it falls through the Milky Way Halo is a slow process, with extensive streams of tidal debris existing for long periods of time (Ibata & Lewis, 1998; Johnston et al., 1999). While ancient remnants have been identified, via phase-space analysis, in our own Galactic neighbourhood (Helmi et al., 1999; Brook, Kawata, Gibson, & Flynn, 2003), more extensive surveys of the Galactic Halo, such as the Spaghetti Survey (Morrison et al., 2000) and utilizing 2MASS (Majewski, Skrutskie, Weinberg, & Ostheimer, 2003) have concluded that there is only a single, major on-going accretion event, that of the Sagittarius dwarf galaxy (Ibata, Gilmore, & Irwin, 1994). While this accretion event is adding mass to the Galactic Halo and provides an important probe of the shape of the dark matter potential (e.g. Ibata et al., 2001; Majewski et al., 2004), the lack of other other major accretion events is somewhat disconcerting given the predictions from CDM.
As will be discussed in detail in 2, the recently discovered Monoceros Ring (MRi) can be interpreted as an additional on-going accretion event within the Milky Way. Investigating the density and extent of this structure is important when trying to fully understand the impact this type of event is having on the evolution of our galaxy both in the past and into the future. If the MRi is instead the outermost edge of the Milky Way, mapping the outer reaches of the Disk will provide insight into the Milky Way’s past. To this end, we have used the Isaac Newton Telescope Wide Field Camera to continue a campaign to detect this stellar population around the Galactic plane mapping out the extent of the MRi. This paper presents the results of a wide-field camera survey of the extensive stellar population thought to represent a continuation of the previous work in this field. The layout of the paper is as follows; 2 summarises the extant knowledge of the MRi and the associated population of stars while 3 describes the observational procedure and data reduction. 4 describes the analysis procedure, and the conclusions of this study are presented in 5.
2 The Monoceros Ring
The first sign of a new structure in the Galaxy, the Monoceros Ring111The stream of stars at the edge of the Milky Way has received several names, including The One Ring (Ibata et al., 2003), the Monoceros Stream (Yanny et al., 2003) and the Galactic Anti-Centre Stellar Stream – GASS – (Majewski, Skrutskie, Weinberg, & Ostheimer, 2003). For the sake of simplicity, throughout this paper this stellar population is referred to as the Monoceros Ring (MRi), although this name does not imply we currently know the exact nature of this stellar population., came from a study of colour selected F-stars drawn from commissioning data from the Sloan Digital Sky Survey [SDSS, Newberg et al. (2002)]. Obtained in a narrow strip around the celestial equator these revealed two major stellar overdensities in the Galactic Halo, consistent with an intersection of the streams of tidal debris torn from the Sagittarius Dwarf galaxy (Ibata, Irwin, Lewis, & Stolte, 2001). Accompanying these, however, was an additional significant overdensity in the direction of the Galactic anti-centre, interpreted as being another tidal stream about the Galaxy, just past the edge of the stellar Disk, at a Galactocentric distance of kpc and with a thickness of kpc, covering over of sky within of the Galactic equator.
Given the results of the study of the SDSS, Ibata et al. (2003) searched for the signature of this stellar population in fields obtained for the Isaac Newton Telescope Wide Field Camera (INT/WFC) survey (see McMahon et al., 2001). Identifying the stream as a distinct population in colour-magnitude diagrams (CMDs), this study found the stars to be extensively distributed; over 100∘ of the sky within of the Galactic equator, suggesting that the stream completely rings the Galaxy. Main sequence fitting reveals that the Galactocentric distance to the stream varies between kpc and kpc, with an apparent scale-height of kpc. Ibata et al. (2003) suggested that this stream represents debris of an accreting dwarf galaxy, although pointed out that the extant data did not rule out alternatives such as an outer spiral arm or unknown warp/flare of the Galactic Disk. In fact, they favoured the interpretation of it being a perturbation of the disc, possibly the result of ancient warps.
Simultaneously, Yanny et al. (2003) presented an analysis of a larger SDSS catalog of Halo stars obtaining a number of radial velocities in several fields over the stream, finding a velocity dispersion of km/s, inconsistent with any known Galactic component. Furthermore, these kinematics indicate that the stream possesses a prograde orbit about the Milky Way with a circular velocity of km/s [Note: this revised value was presented in Yanny et al. (2004)]. Metallicity estimates from these spectra indicate the stars are relatively metal poor . Yanny et al. (2003) also concluded the stream represents a cannibalized dwarf galaxy undulating about the edge of the Galactic Disk.
Several other studies have focused upon this stream population; using the 2-Micron All Sky Survey (2MASS) Rocha-Pinto et al. (2003) identified M-giant stars beyond the Disk of the Milky Way, consistent with the population detected in the optical. Again, at a Galactocentric distance (RGC) of kpc, this arc of stars covers , with a higher metallicity than previously determined . Crane et al. (2003) extended this study, obtaining stellar velocities of M-giants selected from 2MASS. Confirming a velocity dispersion of km/s, this study concluded the stream orbits the Milky Way in a prograde fashion on an orbit with very little eccentricity. While this may seem problematic for accretion models preferring elliptical orbits, numerical simulations by Helmi et al. (2003) suggest that tidal streams in the plane of the Milky Way can possess quite circular orbits; these numerical studies, however, also suggest that the accretion event must be young, less than Gyr since its first perigalactic passage, or any coherent structure would have dissolved. Finally, Frinchaboy et al. (2004) noted five globular clusters which are apparently associated with the stellar stream, as well as outer, old stellar clusters, bolstering the argument that it represents an accreting dwarf galaxy.
Martin et al. (2004a) also employed the 2MASS catalogue to identify M-giants beyond the Disk of the Milky Way. By considering the projected density of these stars, this study uncovered north-south anisotropies in the density of M-stars, with arcs above and below the plane of the Galaxy. Significantly, Martin et al. (2004a) identified a strong overdensity of these stars, of them in roughly 20∘ of the sky at , the constellation of Canis Major (CMa). This is a similar number of M-stars to that seen in the Sagittarius dwarf galaxy and Martin et al. (2004a) similarly interpret this population of stars as a dwarf galaxy. It is probably the progenitor, with an original mass of , of the extensive stream of stars around the edge of the Disk of the Milky Way. Given its mass, if CMa does represent an equatorial accretion event, it will, when fully dissolved, increase the mass of the Thick Disk by .
Additional evidence for this accretion interpretation of the CMa dwarf comes from Bellazzini et al. (2004) who found the signature of the main body of the dwarf in the background to several Galactic open clusters, with the analysis of this population suggesting that it is somewhat metal rich with an age of Gyrs, although a blue plume indicates a younger population. This study also identified several globular and open clusters associated with the dwarf. Recently, Forbes, Strader, & Brodie (2004) have shown that the globular clusters associated with CMa possess their own age-metallicity relationship which is distinct from that of the Galactic population. Furthermore, the clusters are smaller than expected, if drawn from the Galactic population, strengthening the interpretation that they are of non-Galactic origin.
Momany et al. (2004), by re-analysing the 2MASS data claim the overabundance of M-giants in CMa is simply a signature of the warp in the Milky Way. In response, Martin et al. (2004b) used 2dF222The 2dF instrument on the Anglo-Australian Telescope is a multi-fibre spectrograph with the ability to obtain spectra for 400 stars in a single pointing, inside a two-degree field. data of the Canis Major region to highlight the velocity disparities between the Milky Way Disk stars and the M-giant overdensity stars. This has been repeated more recently by Martin et al. (2005) suggesting the dwarf galaxy CMa can now be tentatively accepted as a real entity despite the current debate. Connecting CMa to the MRi is more problematic due to gaps in the detection of the ring and poor kinematic knowledge. A recently completed 2dF kinematic survey (Martin et al., 2005) of the Canis Major region may yield results in this area although currently any general conclusions linking it with the MRi are speculative.
More information about Halo substructure has been recently discovered as Rocha-Pinto et al. (2004) have identified another structure in Triangulum-Andromedae (TriAnd) which extends much further out than the MRi. Currently it is not known whether the two are related, although interestingly the detection of the MRi by Ibata et al. (2003) resides at the edge of this new structure in TriAnd suggesting a connection.
The latest evidence supporting the interpretation of the Canis Major Dwarf galaxy has been presented by Martínez-Delgado et al. (2004), showing the colour-magnitude diagram of a region (0.5∘ x 0.5∘) centred on (l,b) = (240,-8)∘, the overdensity proposed by Martin et al. (2004b). An upper limit to the Heliocentric distance of the galaxy is found to be 5.30.2 to 8.10.4 kpc; this is comparable with previous estimates. By measuring the surface brightness and total luminosity of the dwarf galaxy an estimate of the mass range is found to be 1.0 M⊙ 5.5108. The tightness of the main sequence they found contradicts the claims that the Canis Major overdensity is the signature of the Galactic warp. Peñarrubia et al. (2004) have completed extensive modelling of the MRi and while not conclusively establishing a connection between Canis Major and the MRi, their results are highly suggestive of such a link. Peñarrubia et al. (2004) using all of the current information known about the MRi, undertook thousands of simulations, prograde and retrograde, in an attempt to find a model which best fitted the data. While some retrograde models were marginally acceptable, their preferred model was a prograde orbit which includes multiple wraps of the Milky Way. This allows for the scenario that the tidal stream has both near and far components. 4.3 discusses a field in which this phenomenon appears. If the dwarf galaxy has completed more than one orbit then the stream must be a much older structure than previously assumed [cf. Helmi et al. (2003)], raising the possibility that the newly discovered TriAnd structure (Rocha-Pinto et al., 2004) could be the distant arm of a multiply wrapped tidal stream.
The model of Peñarrubia et al. (2004) and the continuing work of those studying this new Galactic feature are slowly piecing together this structure, although currently there is no real coverage around the entire Galactic plane, these observations hopefully extend the knowledge of the MRi and it’s potential progenitor the Canis Major Dwarf.
3 Observations and Reduction
The data was obtained on the Isaac Newton Telescope Wide Field Camera (INT/WFC) at Roque de Los Muchachos in La Palma, Canary Islands. Mounted at the telescope prime focus, this covers 0.29 square degrees field per pointing, imaging onto four 4k2k CCDs. These possess 13.5m pixels, corresponding to a pixel scale of 0.33 arcsec per pixel.
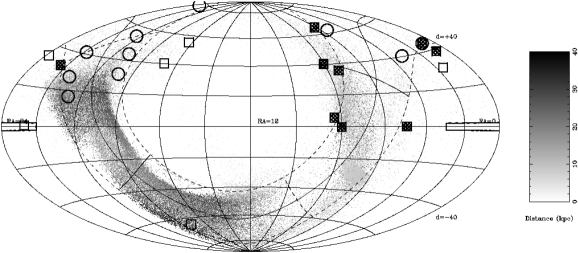
Nine survey regions were chosen, roughly equally spaced between l = . To aid in determining the location of the fields, the model of Martin et al. (2004a) (See Figure 1) was used to predict where we might expect the spread of debris from an equatorial accretion. For each Galactic longitude, two regions symmetrically placed above and below the Galactic plane, were imaged. Each target region is a composite of overlapping fields, the number of which depended on time available to observe in each region (details of the observations are summarised in Table 1 and presented graphically in Figure 1), but typically with a total area of square degrees. With the representative integration times, the limiting magnitudes are on average for these observations 23.3, 22.2, 23.8 and 22.8. Archival data of (123,-19)∘, taken from the M31 survey (Ibata et al., 2001; Ferguson et al., 2002), is used as the opposing field to (118,+16)∘.
De-biassing and trimming, vignetting correction, astrometry and photometry were all undertaken with the CASU data reduction pipeline (Irwin & Lewis, 2001). The flat fielding employed a master twilight flat generated over the entire observing run. Each star was individually extinction corrected using the dust_getval.c program supplied by Schlegel333http://www.astro.princeton.edu/schlegel/dust/data/data.html which interpolates the extinction using the maps presented by Schlegel, Finkbeiner, & Davis (1998). Observing several standard fields per night allows the calibration of the photometry to be determined, as described by (Irwin & Lewis, 2001), deriving the CCD zero-points. These are consistent to within a few percent on photometric nights. The data reduction pipeline produces a catalogue of all images in each colour-band. Rejecting non-stellar images, the catalogues can be cross-correlated and the colour for individual stars can be determined. Near the limiting magnitude, however, galaxies can appear stellar and so galactic contamination is expected for the faintest sources.
| Fields(l,b)∘ | No. of Regions per field | Exposure (s) | Filter | Average Seeing (arcsec) | Total Area () | Detection | Date |
|---|---|---|---|---|---|---|---|
| (61,15)∘ | 6 | - | , | - | 1.74 | No (+/-) | late 05/03 |
| (75,15)∘ | 7 | 600s | , | 1.3 | 2.03 | No (+/-) | 05/09/03 |
| (90,10)∘ | 7 | 900s | , | 1.0 | 2.03 | No (+/-) | 28-31/08/03 |
| (118,16)∘ | 11 | 900/1000s | , | 1.2 | 3.19 | Yes | 29/08-02/09/03 |
| (123,19)∘ | - | - | , | - | - | Yes | - |
| (150,15)∘ | 6 | 600s | , | 1.3 | 1.74 | Yes(+), Maybe(-) | 03-05/09/03 |
4 Analysis
4.1 Detecting the Monoceros Ring
As a first step each field was investigated by eye, looking for the presence of the MRi main sequence. In previous studies (Ibata et al., 2003) the MRi structure was observed as a coherent stellar population superimposed upon an overall Galactic CMD. Hence, we compare the observed and synthetic CMDs, as well as the North and South fields, to search for such a signal.
The synthetic CMDs were generated from the online models of the Milky Way by Robin, Reylé, Derrière & Picaud (2003)444http://www.obs-besancon.fr/www/modele. To avoid any artificial cuts in the data, the modelled fields are extended out to 50 kpc (Heliocentric distance, RHC) and include the entire magnitude range available to the model (-99,99) for each passband. The extinction parameter is set to zero, all ages/populations and luminosity classes are included. This creates a complete picture of the field of interest and allows any later cuts on magnitude to be made at our discretion. The (,) figures have been created using data straight from the model while the (,) figures converted the model (,) magnitudes via the INT/WFC colour corrections555http://www.ast.cam.ac.uk/wfcsur/technical/photom/colours.
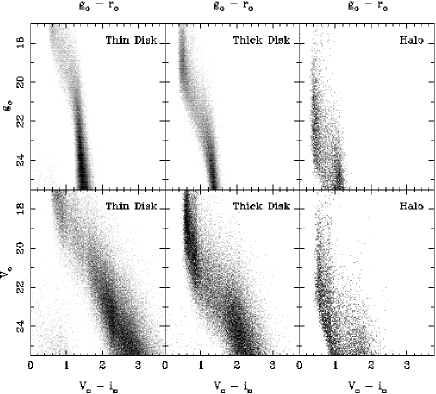
To understand the CMDs, requires that we know what Galactic features are present in the data. By deconstructing the model, the influence of each component of the galaxy in the CMD is presented. This can be seen in Figure 2, the top panels show the (61,-15)∘ field from the model being split into its various Galactic components. For and CMDs, this plot illustrates where the various components of the Galaxy lie on the CMD. The lower panels are from the model field (75,+15)∘, and show how a (,) CMD can be similarly deconstructed. Analysing Figure 2, shows that each component of the Milky Way occupies different regions of the CMD. In the following subsections the equations defining the separate Galactic structures as used in the synthetic galaxy model666 Each of the following equations is cited and presented as per the referenced papers. A slight modification has been made to the Thick Disk equation to account for a typographical error in the paper. are presented.
4.1.1 Thin Disk density profile
The youngest disc777Robin & Creze (1986): and are the Galactocentric cylindrical coordinates (pc), with as the axis ratio for the ellipsoidal components. A is a constant defined by Table 1 of Robin & Creze (1986).
| (1) |
with , and
Old discs:
| (2) |
with and The Thin Disk is quite tightly constrained in the , CMD but is quite broad in the , CMD, it turns redward at 19th magnitude in the , CMD, while for the , CMD it is not as well defined and blurs down to 20th magnitude.
4.1.2 Thick Disk density profile
| (3) |
The Thick Disk888Reylé & Robin (2001) equations have three parameters defining the density along the axis: , the scale height, , the local density and the distance above the plane where the density law becomes exponential. This third parameter is fixed by continuity of () and its derivative. It varies with the choice of scale height and local density following the potential. These variations are listed below999Robin et al. (1996),
| (4) |
where the scale height density is
| (5) |
and the local density is
| (6) |
From Table 1 of Robin et al. (1996) the scale height is = 760 50 pc, the local density = 5.6 1% and the scale length = 2.8 kpc. The Thick Disk in the , CMD is well constrained at the ends of the magnitude range (keeping in mind that these figures do not take into account any incompleteness) and has a redward trend around 21st magnitude. The Thick Disk in , is much more diffuse and the redward trend extends to 22nd magnitude.
4.1.3 Halo density profile
| (7) |
In the Halo 101010Robin et al. (2000) or spheroidal equations, is the local density, is the power law index and is the flattening. The best fit values for these parameters (Robin et al., 2000) are = 1.64E(-4) stars.pc-3, = 2.44 and = 0.76. The Halo in the , CMD seems to have a very faint trend redwards at 24th magnitude, however in the , CMD there is a distinct turn redward in the Halo around 22nd magnitude.
These figures illustrate why the Galactic component of the CMD does not introduce any strong main sequences into the CMD. Instead, they are smooth with overdensities at the extremes of the magnitude range, with each component introducing redward trends at different places in the CMD. Understanding the CMDs in this way allows for greater understanding of the data when interpreting the observations.
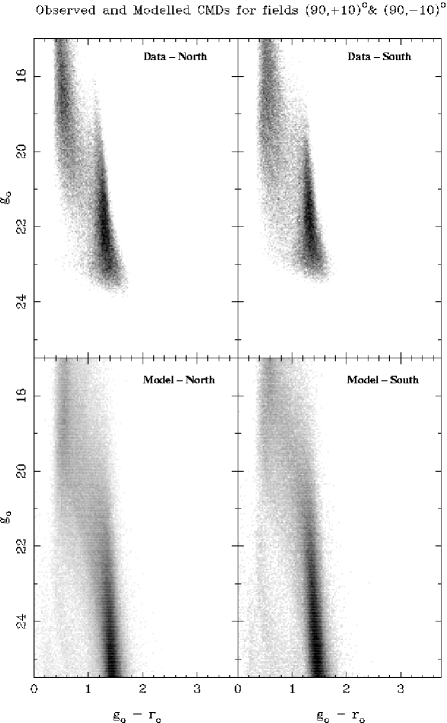
CMDs of the data were produced using the matched catalogues from the data-reduction pipeline, shown as Hess plots111111A Hess plot is a pixelated Colour-Magnitude diagram where the grayscale denotes the square root of the Colour-Magnitude diagram number density in Figures 3 to 7. The Galactic coordinate notation from here on will be written in the form (l, b)∘. In Figures 3 to 7, the top-left panel is the Northern field, the top-right panel is the Southern field, each containing the actual data from the observing run. The lower panels are solely synthetic CMD’s and are again North on the lower-left and South on the lower-right.
All previous detections of the MRi have shown it to be beyond the Disk of the galaxy. This means that the MRi main sequence should be in the area of CMD typically containing the Halo and Thick Disk stars. Since the density of stars here is intrinsically low, the MRi main sequence should contrast well against these weaker components. However, if the stream approaches close to the edge of the Thick Disk, there is the possibility of confusion between the two. All of the possible detections of the stream that result from this work are in this region between the Thick Disk and the Halo and so there remains some ambiguity over how to separate these two structures from the stream. Each of the detections represents large excursions from the synthetic galaxy model, typically 1 magnitude or greater, corresponding to a distance shift of 6 kpc according to our estimation. Comparisons with the model in this manner is unsuited towards minor deviations, but given the distances involved in a 1 magnitude difference this suggests the features represent more than just problems with the synthetic galaxy model. If this were the case then the model is indeed very inadequate in these regions. Since we do not expect this to be the case we proceed with this method. Ultimately, kinematic surveys of these regions will be needed to resolve some of the remaining uncertainties but in the meantime we have used careful comparison with the models of Robin, Reylé, Derrière & Picaud (2003) coupled with completeness and magnitude-error estimates to draw out any extra features from the Colour-Magnitude diagrams.
4.1.4 Magnitude Completeness
The magnitude completeness of the data was estimated using the overlap regions of the observations. Each field consists of several overlapping subfields (see Table 1). Stars in the overlap regions will appear in more than one subfield. So by dividing the number of stars that can be matched across subfields by the total number of stars in the overlap region (for a given magnitude bin), the completeness curve can be formed. Fitting the curve with the function,
| (8) |
where m is the magnitude of the star, mc is the magnitude at 50% completeness and is the width of the rollover from 100% completeness to 0% completeness. By applying the completeness curve of the data to the model makes for a more suitable comparison. Our method for determining completeness does not account for faint stars which lie close to bright stars and thus are excluded from our completeness estimate. The values used to model each field can be found in Table 2.
| Fields (l,b)∘ | mc ( or ) | mc ( or ) | |
|---|---|---|---|
| (61,15)∘ | 24.2 | 23.2 | 0.4 |
| (61,15)∘ | 24.5 | 23.5 | 0.4 |
| (75,15)∘ | 23.6 | 22.5 | 0.5 |
| (75,15)∘ | 22.8 | 21.8 | 0.5 |
| (90,10)∘ | 23.2 | 22.2 | 0.3 |
| (90,10)∘ | 23.2 | 22.2 | 0.3 |
| (118,16)∘ | 23.4 | 22.4 | 0.4 |
| (123,19)∘ | 24.0 | 23.0 | 0.5 |
| (150,15)∘ | 23.0 | 21.5 | 0.3 |
| (150,15)∘ | 23.2 | 22.0 | 0.3 |
With regards to the real data, the uncertainty in the magnitude increases with increasing magnitude. This explains why the structures in the real data loses coherency at the faintest extremes of the Hess plots. By plotting the magnitude against the error of the magnitude it can be fitted with the following function.
| (9) |
where f(x) is the error in the magnitude and x is the magnitude121212Parameters for these equations will be supplied upon request (bconn@physics.usyd.edu.au).
This allows a similar effect to be introduced into the model figures when making quantitative measurements. The completeness and magnitude error functions have not been applied when making initial comparisons between the model and the data in a qualitative sense. Comparing obvious structural differences with the model and finding the distance to any new structure is a qualitative approach and does not require the model to be corrected in this manner. Then, when attempting to find the signal-to-noise of our detections quantitatively, we have applied both corrections to the model adjusting it to match the data.
4.1.5 Estimating the Distance
Using the method employed by Ibata et al. (2003), we too have used the colour-transformation which converted the ridge-line of the SDSS S223+20 field [ Newberg et al. (2002), see Figure 12.] to a main sequence type overlay. By determining the offset of any new structure from the base position of this ridge-line we can estimate the distance. To do this we need to convert the SDSS (,) system to the Vega-normalized (,) and (,), this can be done by comparing overlapping INT and SDSS fields (SDSS fields taken from Early Data Release, Stoughton et al. (2002)). In particular, these conversions use a comparison field near the Galactic South Pole. The relevant colour conversions are:
for and ,
| (10) |
| (11) |
for and ,
| (12) |
| (13) |
The (,) conversion is taken from Windhorst et al. (1991)131313These conversions may have significant systematic errors and as such any distance estimate derived using this method should merely be taken as indicative in particular, the conversion from (,) to (,). The zero offset Heliocentric distance estimate is assumed to be 11 kpc (Newberg et al., 2002) and any deviation in magnitude required to align this main sequence style overlay is assumed to be solely due to distance variations. The Heliocentric distance is then calculated using Eqn.14 and the Galactocentric distance is found using simple trigonometry assuming the Sun is located 8.0 kpc from the Galactic centre.
| (14) |
Determining a value for the error associated with such a measurement is dependent on several factors. Most predominant of these is whether the fields have been correctly calibrated with regard to their photometry taking into account the dust extinction present within the fields (Schlegel, Finkbeiner, & Davis, 1998). Given however that the accuracy of the dust maps is 16%, this will dominate over the few percent calibration error in the photometric zero-points as derived by the CASU pipeline (Irwin & Lewis, 2001). Having understood the errors involved in both the determination of the photometry, extinction correction and the main-sequence style overlay, manually placing this overlay at the two extremes of an acceptable fit provides a range of distances over which this structure resides. The final value then represents the average of this estimate rounded to the nearest kiloparsec; the error in the fit is typically less than 1 kpc and thus is dominated by the 10% error which naturally resides in the original distance calculation. Given the large errors involved these distances can only be considered indicative of the true distance.
4.2 Individual Fields
4.2.1 Fields
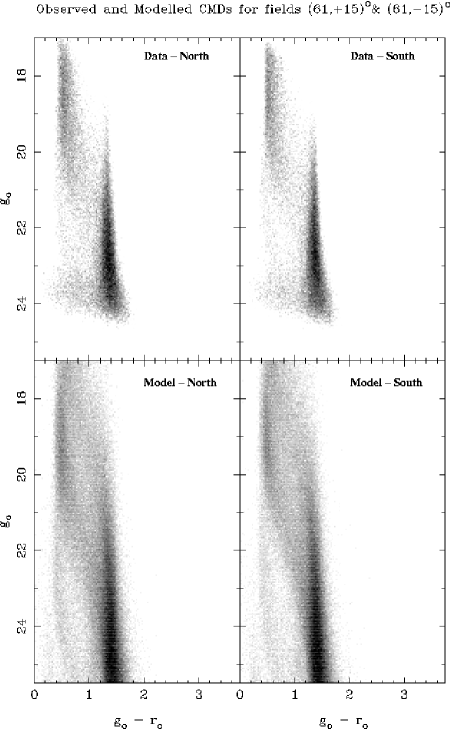
Presented in the top panels of Figure 3, the data is shown as a Hess plot. The lower panels were generated by the synthetic galactic model of Robin, Reylé, Derrière & Picaud (2003) to serve as comparison figures for the data. Note that the model fields have not been completeness corrected for these comparisons. When comparing with Figure 2, we can see each of the expected Galactic components present in the data. Thus the observed field matches the synthetic field to a high degree supporting our assumption that the synthetic fields will act as good comparisons to the data. In these fields, the Halo component is seemingly showing a redward trend brighter than the model, however the strength of this feature was deemed not sufficiently significant to infer a detection. 5.2.2 re-examines this field in light of the model produced by Peñarrubia et al. (2004).
4.2.2 Fields
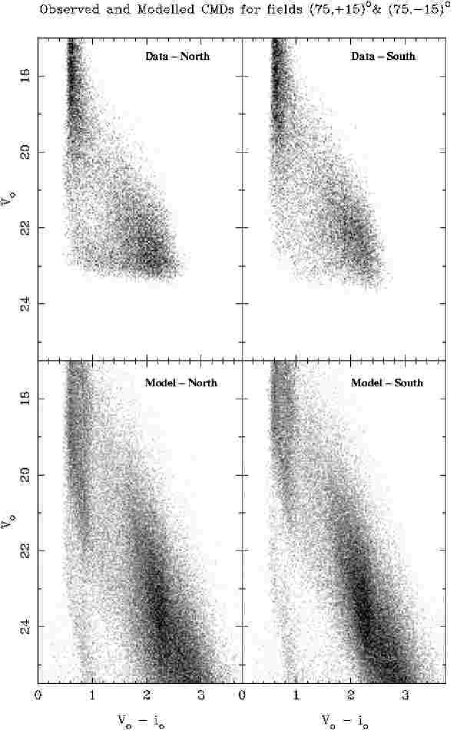
Figure 4 shows the data and the model for the fields (75,15)∘. These fields were observed using the and filters and this has the effect of changing the layout of the CMD. Studying Figure 2, each of the Galactic components in our data can again be easily identified . The field (75,+15)∘ also seems to have a Halo component which turns redward brighter than the model. Similarly with the fields (61,15)∘ this feature is not significant enough to convincingly label a detection. These fields too are revisited in 5.2.2 when comparing with the results of Peñarrubia et al. (2004).
4.2.3 Fields
4.2.4 Fields &
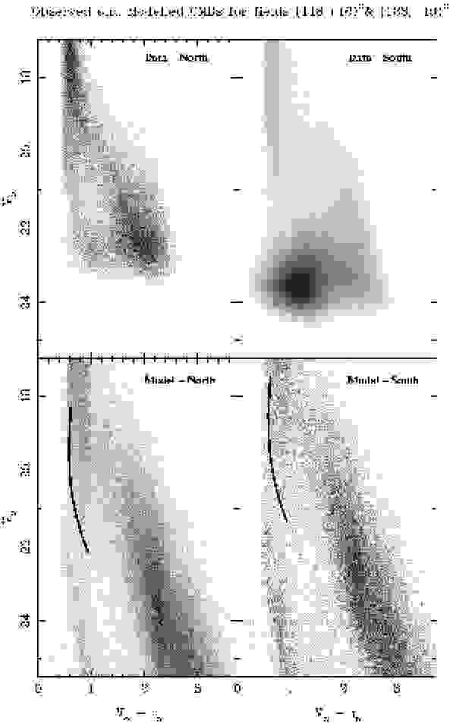
Figure 6 shows the data and the model for the fields (118,+16)∘ and (123,-19)∘. The (123,-19)∘ field is from the M31 survey (Ibata et al., 2001; Ferguson et al., 2002) with the confirmation of the MRi signature presented in Ibata et al. (2003). The (118,+16)∘ field has a Halo component in which the Main Sequence (MS) turns redward brighter than that of the model field. As from 4.2.2 the bulk Halo MS is expected to turn redward in this field at . The redward trend detected occurs at and reaches a value of at . Comparing this to the expected location of the Halo population in the model reveals that the (118,+16)∘ field is inside this population and thus is a potential detection of the MRi. Fitting a main sequence to the feature and overlaying it on the model, as can be seen in the lower left plot of Figure 6, an offset of +0.2 magnitudes or RHC 12 kpc is calculated which corresponds to RGC 17 kpc. This is further out than is predicted by the model shown in Figure 1. The field (118,+16)∘ is intended to be a comparison field on the symmetrically opposite side of the Galaxy. Both these fields have been observed in and and thus have the Galactic features as discussed for Figure 4. The MRi signature in (123,-19)∘ stands out clearly against the known Galactic components. The magnitude offset is -0.8 with distances to this feature being RHC 7.6 kpc and RGC 14 kpc. Note that the circular overdensity at is M31 in the background of this field.
4.2.5 Fields
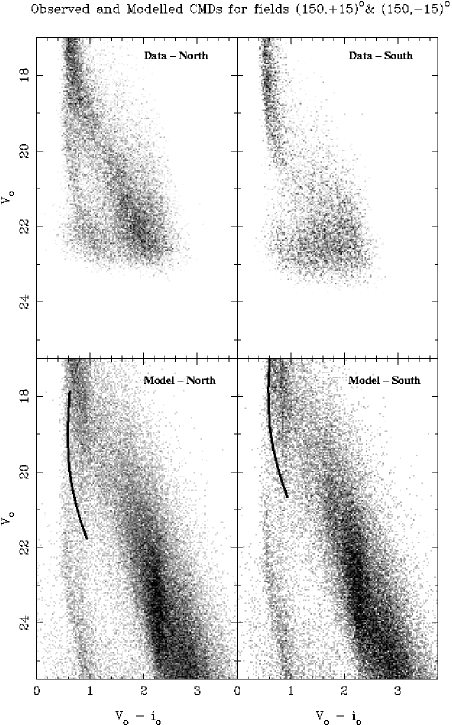
Figure 7 shows the data and the model for the fields (150,15)∘. These fields have been observed in and and thus have the Galactic features as discussed for Figure 4. Using the technique described in 4.2.4 of examining when the bulk Halo Main Sequence (MS) turns redward, in the Northern field this occurs at . The data MS turns redward at and reaches a value of at . Fitting a main sequence to this feature and overlaying it on the model using an offset of -0.4 magnitudes, which can be seen in the lower left plot of Figure 7, we calculate RHC 9 kpc, this corresponds to RGC 17 kpc which exceeds the model prediction in Figure 1 by 7 kpc. Comparing with the detection in field Mono-N (149,+20)∘, Ibata et al. (2003) shows similar findings. They also report an offset of -0.4 magnitudes corresponding to a Heliocentric distance of 9 kpc and a Galactocentric distance of 16 kpc. In all likelihood this represents two detections of the same stream in different passbands separated by a few degrees on the sky, given this, we have interpreted it as a detection of the MRi. The (150,-15)∘ field only vaguely resembles its synthetic field counterpart, however the strong vertical feature at seems to form a main sequence that is quite close to the edge of the Thick Disk in the current Galactic model. Determining whether this is in fact the edge of the Thick Disk is difficult considering that the Halo component is poorly defined and thus not readily available for comparison. Fitting a main sequence to this feature using an offset of -1.5, RHC 6 kpc and RGC 13 kpc.
4.3 A re-examination of field
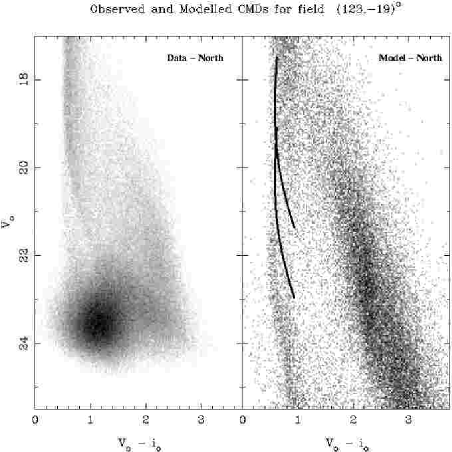
Detecting the stream by noting deviations from the synthetic CMDs as in the (118,+16)∘ and (150,15)∘ fields, rather than the obviously additional feature as seen in Figure 6 with regards to the (123,-19)∘ field, means applying this technique to the (123,-19)∘ field may yield a new detection. The redward trend of the Halo component begins at 22-22.5 in the model while in the data this occurs at 21-21.5, suggesting this feature is not of Galactic origins. Fitting a main sequence overlay with an offset of +0.8 to this, as can be seen in Figure 8, distance estimates of RHC 16 kpc and RGC21 kpc are obtained for this new structure.
If however, this is to believed, then there are two structures present in this field. Since this field is in the vicinity of the newly discovered TriAnd structure perhaps this is a detection of it in the background. The current distance estimate to the TriAnd structure is RHC15-30 kpc, in the region l 100∘ to 170∘ and b -15∘ to -60∘. This places both detections in this field on the edge of this structure. Although association between the MRi and TriAnd is still speculative, TriAnd may represent a wrapped tidal arm of the MRi. Pursuing this thought, a wrapped tidal arm would imply that the MRi is not a recent accretion event but rather the relic of a much older accretion. The model of Peñarrubia et al. (2004), also supports this view of wrapped tidal arms and this field in particular fits with their model. 5.2.1 discusses this in further detail. Clearly though, this is a tentative detection as the correspondence between the model and the data, in this region, is poor. This detection may also simply reveal a deficiency in the synthetic galaxy model.
4.4 Comparison: Data minus Model
Applying the completeness corrections and the appropriate magnitude error estimates to the model brings it as close to the real data as possible. By subtracting the corrected model from the data this minimises the residuals between the two. For those fields in which we found no “by-eye” detection, namely, (61,15)∘, (75,15)∘ and (90,10)∘, the residuals formed no coherent structures and have not been presented here. The field (150,-15)∘ is also not shown, as the differences between the real data and the model proved too great to draw any logical conclusions. The remaining fields (118,+16)∘, (123,-19)∘ and (150,+15)∘ are shown in Figures 9, 10 and 11. The same main sequence lines as drawn in the previous Hess plots have also been overlaid on these CMDs. The features as mentioned previously are present in these figures also, see 4.2.
This procedure allowed us to quantitatively determine an estimate of the significance of these features, found by dividing the number of stars in the feature by the Poisson noise due to the stars in the region. The feature in Figure 9, from (118,+16)∘, has a signal-to-noise ratio of 20. For field (123,-19)∘ (Figure 10), the estimated signal-to-noise value is 20, which is in accordance with Ibata et al. (2003). Finally for (150,+15)∘ (Figure 11), the signal-to-noise was found to be 12. While we may not know the origins of these features, these results confirm that they are significant contributors to the CMDs in these regions.
5 Discussion
5.1 Summary of Results
Using the Isaac Newton Telescope Wide Field Camera in La Palma, Canary Islands we have undertaken a survey of the Monoceros Ring (MRi) in the region of Galactic longitudes l = (61 - 150)∘ in symmetric pairs above and below the plane. Table 1 shows the fields observed. The MRi can be seen in many fields across the sky (Figure 12) and also in 2MASS distribution of M-giant stars (Rocha-Pinto et al., 2003). The origin of this structure is still poorly understood and a systematic survey around the Galactic plane is required to understand the size and extent of this structure.
Surveying the region of sky l= (61 - 150)∘ and through a re-examination of field (123,-19)∘, four tentative detections of the MRi have been found. Fitting main sequences to those CMDs which showed a deviation from the synthetic galaxy model has yielded distance estimates in those fields. The distance estimates both Heliocentric and Galactocentric can be seen in Table 3.
With detections in each of these cases being on both sides of the Galactic plane it suggests the stream is either very broad on the plane of the sky or represents more than one arm of the tidal debris wrapping around on themselves. Also, the detection at (150,+15)∘ is on the opposite side of the Galactic plane to the newest structure in the Milky Way, namely the TriAnd feature of Rocha-Pinto et al. (2004).
Are they both related to the MRi structure? The kinematics of most of the MRi detections are unknown, however with more detections of the MRi on both sides of the plane, the MRi structure is possibly much older than previously assumed. If indeed it is an accreted dwarf galaxy, then it has seemingly made several orbits around the galaxy.
5.2 Re-examination of the observations based on the model of Peñarrubia et al. (2004)
The hypothesis of multiply wrapped tidal arms is investigated by Peñarrubia et al. (2004) who have created an detailed model of the Monoceros tidal stream using all the data currently available. By testing thousands of models of tidal streams, in both prograde and retrograde directions around the Milky Way and correlating them against the current observations they refined the parameters for the tidal stream. The solution they favour is one where the accreting dwarf galaxy has made two orbits of the galaxy in the prograde direction leaving two concentric tidal streams.
5.2.1 Detections: Fields (118,+16)∘,(123,-19)∘ & (150,15)∘
Interestingly, Figure 7 of Peñarrubia et al. (2004) shows the location of the stream in Galactic coordinates and the corresponding Heliocentric distances to the stream around the Galactic equator, allowing for a direct comparison with our data. At (118,+16)∘ their model shows the stream around 17 kpc away and at the location (123,-19)∘ shows a region where the two streams cross, the inner ring being 17 kpc away and the outer ring 10 kpc away. (150,+15)∘ resides in a region where both rings are present but sparsely populated. The range of distances to the stream is 7 - 16 kpc. (150,-15)∘ lies predominantly on their inner ring and has a distance of 8 kpc. The detections correspond well with this model, excluding (150,-15)∘, which as stated previously does not resemble the expected CMD and is open to interpretation. For a full comparison of the distances found, see Table 3. It is encouraging that the model provides some support to our findings that two tidal streams are present in the (123,-19)∘ field.
5.2.2 Non-detections: Fields (61,15)∘, (75,15)∘ & (90,10)∘
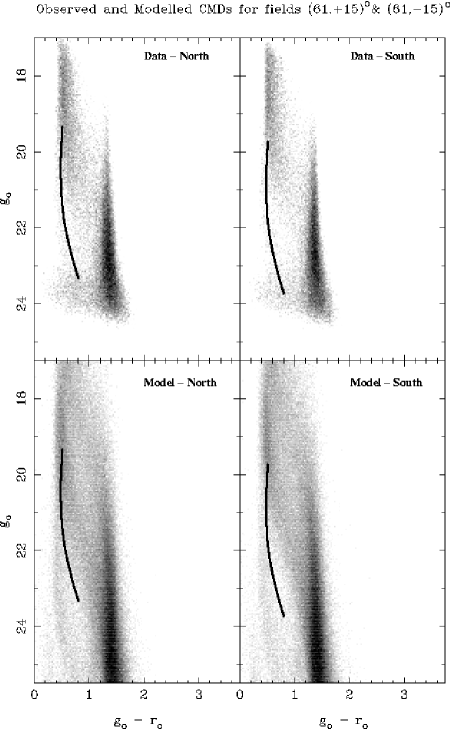
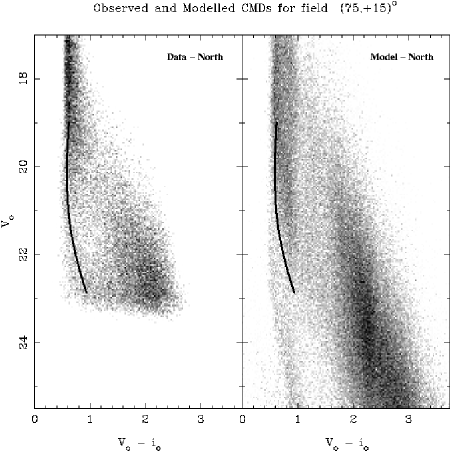
Considering those fields in which no “by-eye” detection was made, the results of Peñarrubia et al. (2004) allow some more tentative detections. For the (61,15)∘ field, the Northern field stream is located 14 kpc away (Heliocentric distance), in a region where their model shows both the near and far streams crossing in the plane of the sky [see Figure 7. of Peñarrubia et al. (2004)]. Fitting a main sequence to the Halo structure in this field, it should be first noted that it turns redward brighter than the model, in the same manner as the detections in the other fields and has a distance of 16 kpc. The Southern field, while in a region again where two streams are crossing, the distance to these structures is 21 kpc and fitting a main sequence to the Halo component here reveals a distance of 19 kpc. The main sequence overlays for these distance estimates can be seen in Figure 13. The (75,15)∘ fields, being close to the (61,15)∘ fields, has similar properties as described above. The stream in the model at (75,+15)∘ has a distance of 8 - 17 kpc. Fitting a main sequence to the Halo component of this field returns a distance of 15 kpc, this can be seen in Figure 14. It should be noted that in comparison with the model the location of the main sequence overlay seems coincident with the edge of the Thick Disk (see Figure 2). However, since the distances match those in the Peñarrubia et al. (2004) model it is being included in the list of tentative new detections. No kinematics are known about these regions and thus are needed to resolve definitively this ambiguity. The distance to the stream at (75,-15)∘ in the model is 20-31 kpc. Since there is no obvious feature to fit to in our data, it can be assumed that the stream is not present due to the distances involved. The remaining field in which we found no “by-eye” signature of the stream was (90,10)∘. The region (90,+10)∘ is associated with the inner and outer ring of the model and has a distance of 11 - 22 kpc. Our observations do not support the location of the stream in this part of the sky and no main sequence was fitted to any part of the corresponding CMD. (90,-10)∘ resides on the edge of the outer ring which has a corresponding distance 9 - 14 kpc and there is no obvious feature again to fit to, possibly due to being on the edge of the stream in this location hence a smaller number of stream stars or differences between the model and the true location of the stream. The subtraction figures for the (61,15)∘, (75,15)∘ & (90,10)∘, as seen with the (118,+16)∘,(123,-19)∘ & (150,15)∘ fields have not been shown. Due to the relative weakness of the structures we have identified and the slight differences between the model and the data, the signal-to-noise estimates of these tentative detections are not informative.
The Peñarrubia et al. (2004) model was constrained so that it accords with the current published knowledge of the MRi detections. The correlation with this new dataset is an encouraging sign that the tidal stream they have modelled and the tentative detections found here are indeed a real part of this new Milky Way structure.
5.3 Could the Monoceros Ring be a detection of the Galactic warp?
Recently, Momany et al. (2004) have claimed that the identification of the Canis Major Dwarf (CMa) galaxy is none other than a misinterpretation of the Galactic warp. Martin et al. (2004b) have refuted this claim illustrating how the CMa population differs from that of the warp. However, what certainty do we have that the MRi is also not just a misinterpretation of the Galactic warp?
Firstly, what signature would the warp have on the sky if the MRi detections were merely sampling the extent of the warp? In the synthetic models of Robin, Reylé, Derrière & Picaud (2003), the Sun is assumed to be located along a node, with the warp reaching a maximum projected angular extent above the plane at l = 90∘ and a maximum angular extent below the plane at l = 270∘, when viewed from the Solar neighbourhood. Thus all detections of the warp should be above the plane in the region l = 0∘ - 180∘ and below the plane in the region l = 180∘ - 360∘. The distance to the warp would be a minimum at each point of maximum height above the Disk and reach a maximum distance at l = 0∘, 180∘. Also, for any given line-of-sight the warp should only be detected once. Calculating the distance to the warp using the model from Robin, Reylé, Derrière & Picaud (2003), for the lines of sight corresponding to the INT/WFC fields, the projected distance to warp is greater than 30 kpc. Since this is greater than the expected extent of the Galactic Disk, the warp should not present itself in these fields.
In Figure 12, all of the detections of the MRi through CMD identification have been plotted in a top-down view of the galaxy, showing the coordinates of these detections. The quavers (notes with tails) are detections above the plane of the galaxy (b 0∘) and the crochets (notes without tails) are detections below the plane of the galaxy (b 0∘). The colours denote the different observers. The orange circle marks out the solar circle around the galaxy at 8 kpc and the black circle has a radius of 17.5 kpc. In this plot, Galactic longitude l is measured anti-clockwise from the line joining the Sun to the Galactic centre. Comparing our knowledge of how the warp signature should present itself with Figure 12, it is apparent that the detections of the MRi are not divided with those above the plane residing solely in the region l = 0∘-180∘ and those below at l = 180∘-360∘. Detections of the stream have occurred both above and below the plane at similar longitudes. The distances to the detections above the plane seem to lie along a great arc of radius 17.5 kpc, which is inconsistent with the modelled distance to the warp. This shows that the MRi is not a detection of the warp but a distinct feature of the Milky Way.
5.4 Conclusion
The on-going INT/WFC Survey of the Monoceros Ring has yielded several detections of the ring in the region l,b= (118,16)∘, (150, 15)∘ and a tentative detection at (150,-15)∘. Galactocentric distance estimates to these structures gave 17,17, and 13 kpc respectively. These are combined with a reexamination of the field presented by Ibata et al. (2003), (123,-19)∘, showing the position of the Halo is not in accordance with the model and possibly represents another detection of the ring. The Galactocentric distance to this feature is estimated at 21, kpc. This provides evidence that the ring may be wrapped around the galaxy more than once. This is also supported by the model of Peñarrubia et al. (2004).
In light of claims by Momany et al. (2004), that the recently discovered Canis Major Dwarf galaxy was in fact a misinterpretation of the Galactic warp, it seemed necessary to see whether the MRi could also be confused with the warp. The strongest evidence that the MRi is not the warp is that with this survey we have shown that the MRi can be detected on both sides of the Galactic plane at similar Galactic longitudes. Considering the warp cannot have this structure the MRi can be ruled out as a result of the warp.
All the detections have been found by comparing the data with the synthetic galactic model of Robin, Reylé, Derrière & Picaud (2003). This requires the assumption that the major components of the Milky Way have smooth distributions and that major excursions from the expected location of these features must represent something new. Our detections all represent major differences with the synthetic model, typically of the order of 1 magnitude or more which corresponds to a distance variation of 6 kpc (Heliocentrically). The distances to the detections have been calculated using a main-sequence style overlay modeled on the ridge line of the SDSS S223+20 detection. Given an offset from this original detection we can determine a distance. While there may be significant systematic errors in the colour conversions, especially from (,) to (,) we have included the upper and lower limits of all the distances derived to demonstrate the narrowness of the main sequences and the intrinsic errors of this method.
Taking into account the recent paper by Peñarrubia et al. (2004), the observations have been re-examined and the distances and locations of the MRi stream favourably match with their model. Comparing the CMDs of the remaining fields reveal several more tentative detections, namely in (61,15)∘ & (75,+15)∘. These have Heliocentric distances of 16, 19 & 15 kpc and Galactocentric distances of 14, 17 & 15 kpc respectively. Each of these features had been considered earlier in the analysis of the data, however they were deemed to weak to be significant. This model provides support for the authenticity of these detections. Importantly, the model of Peñarrubia et al. (2004) also confirms one of our non-detections, (75,-15)∘ in which the distance to the stream is too great to be detected. The non-detections in the fields (90,10)∘, seemingly do not correspond to the predictions of the model, although a deeper survey of this region may be needed to resolve this discrepancy. It is unknown whether the low Galactic latitude of this field is a factor in the non-detection of the stream.
Both detections and non-detections support a complex picture of the MRi. In particular, those detections above the plane suggest the MRi has an extended stream tracing an arc 17 kpc from the Galactic centre, while the detections below the plane, reveal a tentative detection of the TriAnd region in the background of the (123, -19)∘ region and also the presence of a foreground stream if we link the INT/WFC detections and those of Newberg et al. (2002) & Ibata et al. (2003) (Figure 12). Obviously, the MRi is a very complex structure and additional observations are needed to unravel its origins, so to this end a kinematic survey of the region surrounding the Canis Major overdensity (Martin et al., 2005) has been conducted with the Two Degree Field (2dF) spectrograph and so too a Wide- Camera survey using the Anglo-Australian Observatory Wide Field Imager (AAO/WFI) to complete the survey of the MRi. These results are still being analysed and will form the basis of a forthcoming article.
| Fields(l,b)∘ | Magnitude offsets | RGC (kpc) | RHC (kpc) | Range RHC141414 Martin et al. (2004a) (kpc) | Peak RHC (kpc) | Range RHC151515 Peñarrubia et al. (2004) (kpc) | Peak RHC(kpc) |
|---|---|---|---|---|---|---|---|
| (61,15)∘ | +0.8 | 14 | 16 | 9-11, 14-19 | 9, 16 | 14-22 | 17 |
| (61,15)∘ | +1.2 | 17 | 19 | 7-10, 16-21 | 8, 18 | 21-34 | 27 |
| (75,15)∘ | +0.7 | 15 | 15 | 13-20 | 18 | 8-17 | 15 |
| (75,15)∘ | - | - | - | 6-11, 14-21 | 9, 16 | 20-31 | 24 |
| (90,10)∘ | - | - | - | 5-15 | 14 | 11-22 | 18 |
| (90,10)∘ | - | - | - | 5-9, 11-24 | 7, 15 | 9-14 | 12 |
| (118,16)∘ | +0.2 | 17 | 12 | 5-12 | 8 | 16-22 | 17 |
| (123,19)∘ | -0.8,+0.8 | 14,21 | 8,16 | 2-13 | 10 | 7-12, 15-22 | 10, 17 |
| (150,+15)∘ | -0.4 | 17 | 9 | 5-8 | 7 | 7-16 | 10 |
| (150,-15)∘ | -1.5 | 13 | 6 | 12-21 | 15 | 2-12 | 8 |
6 Acknowledgements
BCC would like to thank his wife, LLL, for kindly supplementing his scholarship income, The University of Sydney for the University Postgraduate Award and the Cambridge Astronomical Survey Unit at Cambridge University and Mike Irwin for their hospitality during my week there. BCC would also like to thank Jorge Peñarrubia, for access to his Monoceros Ring model and the anonymous referee for their many helpful suggestions. GFL acknowledges the support of the Discovery Project grant DP0343508. The research of AMNF has been supported by a Marie Curie Fellowship of the European Community under contract number HPMF-CT-2002-01758. GFL would also like to thank Triple J for their chillout session on Sunday mornings which drowns out his fighting children and also their Three Hours of Power in case they choose to fight between the hours of 11 and 1 at night.
References
- Abadi, Navarro, Steinmetz, & Eke (2003a) Abadi, M. G., Navarro, J. F., Steinmetz, M., & Eke, V. R. 2003a, ApJ, 597, 21
- Abadi, Navarro, Steinmetz, & Eke (2003b) Abadi, M. G., Navarro, J. F., Steinmetz, M., & Eke, V. R. 2003b, ApJ, 591, 499
- Bellazzini et al. (2004) Bellazzini, M., Ibata, R., Monaco, L., Martin, N., Irwin, M. J., & Lewis, G. F. 2004, MNRAS, 354, 1263
- Brook, Kawata, Gibson, & Flynn (2003) Brook, C. B., Kawata, D., Gibson, B. K. & Flynn, C. 2003, ApJ, 585, L125
- Crane et al. (2003) Crane J. D., Majewski S. R., Rocha-Pinto H. J., Frinchaboy P. M., Skrutskie M. F. & Law D. R. 2003, ApJ, 594, L119
- Eggen, Lynden-Bell, & Sandage (1962) Eggen, O. J., Lynden-Bell, D., & Sandage, A. R. 1962, ApJ, 136, 748
- Ferguson et al. (2002) Ferguson, A. M. N., Irwin, M. J., Ibata, R. A., Lewis, G. F., & Tanvir, N. R. 2002, AJ, 124, 1452
- Forbes, Strader, & Brodie (2004) Forbes D. A., Strader J., Brodie J. P., 2004, AJ, 127, 3394
- Frinchaboy et al. (2004) Frinchaboy, P. M., Majewski, S. R., Crane, J. D., Reid, I. N., Rocha-Pinto, H. J., Phelps, R. L., Patterson, R. J., & Muñoz, R. R. 2004, ApJ, 602, L21
- Freeman & Bland-Hawthorn (2002) Freeman K., Bland-Hawthorn J., 2002, ARA&A, 40, 487
- Helmi et al. (2003) Helmi A., Navarro J. F., Meza A., Steinmetz M. & Eke V. R. 2003, ApJ, 592, L25
- Helmi et al. (1999) Helmi A., White S. D. M., de Zeeuw P. T. & Zhao H. 1999, Natur, 402, 53
- Ibata, Gilmore, & Irwin (1994) Ibata, R. A., Gilmore, G., & Irwin, M. J. 1994, Nature, 370, 194
- Ibata et al. (2001) Ibata, R. A., Irwin, M. J., Lewis, G. F., Ferguson, A. M. N., & Tanvir, N. 2001, Nature, 412, 49
- Ibata et al. (2003) Ibata R. A., Irwin M. J., Lewis G. F., Ferguson A. M. N.& Tanvir N. 2003, MNRAS, 340, L21
- Ibata, Irwin, Lewis, & Stolte (2001) Ibata, R. A., Irwin, M. J., Lewis, G. F. & Stolte, A. 2001, ApJ, 547, L133
- Ibata & Lewis (1998) Ibata R. A. & Lewis G. F. 1998, ApJ, 500, 575
- Ibata et al. (2001) Ibata R. A., Lewis G. F., Irwin M. J., Totten E. & Quinn T. 2001, ApJ, 551, 294
- Irwin & Lewis (2001) Irwin M. J. & Lewis J. 2001, NewAR, 45, 105
- Johnston et al. (1999) Johnston K. V., Zhao H., Spergel D. N. & Hernquist L. 1999, ApJ, 512, L109
- Klypin, Kravtsov, Valenzuela, & Prada (1999) Klypin, A., Kravtsov, A. V., Valenzuela, O. & Prada, F. 1999, ApJ, 522, 82
- Majewski, Skrutskie, Weinberg, & Ostheimer (2003) Majewski, S. R., Skrutskie, M. F., Weinberg, M. D., & Ostheimer, J. C. 2003, ApJ, 599, 1082
- Majewski et al. (2004) Majewski S. R., et al., 2004, AJ, 128, 245
- Martin et al. (2004a) Martin, N. F., Ibata, R. A., Bellazzini, M., Irwin, M. J., Lewis, G. F. & Dehnen, W. 2004, MNRAS, 348, 12
- Martin et al. (2004b) Martin, N. F., Ibata, R. A., Conn, B. C., Lewis, G. F., Bellazzini, M., Irwin, M. J., & McConnachie, A. W. 2004, MNRAS, 355, L33
- Martin et al. (2005) Martin, N. F., Ibata, R. A., Conn, B. C., Lewis, G. F., Bellazzini & M., Irwin, M. J. 2005, MNRAS, submitted
- Martínez-Delgado et al. (2004) Martínez-Delgado, D., Butler, D. J., Rix, H. W., Franco, Y. I., & Peñarrubia, J. 2004, astro-ph/0410611
- McMahon et al. (2001) McMahon R. G., Walton N. A., Irwin M. J., Lewis J. R., Bunclark P. S., Jones D. H., 2001, NewAR, 45, 97
- Momany et al. (2004) Momany Y., Zaggia S. R., Bonifacio P., Piotto G., De Angeli F., Bedin L. R., Carraro G., 2004, A&A, 421, L29
- Moore (2001) Moore B., 2001, AIPC, 586, 73
- Morrison et al. (2000) Morrison, H. L., Mateo, M., Olszewski, E. W., Harding, P., Dohm-Palmer, R. C., Freeman, K. C., Norris, J. E. & Morita, M. 2000, AJ, 119, 2254
- Newberg et al. (2002) Newberg H. J. et al. 2002, ApJ, 569, 245
- Peñarrubia et al. (2004) Peñarrubia J., Martinez-Delgado D., Rix H.W., Gomez-Flechoso M.A., Mun J., Newberg H., Bell E.F., Yanny B., Zucker D. & Grebel E.K 2004, astro-ph/0410448
- Reylé & Robin (2001) Reylé, C., & Robin, A. C. 2001, A&A, 373, 886
- Robin & Creze (1986) Robin, A., & Creze, M. 1986, A&A, 157, 71
- Robin et al. (1996) Robin, A. C., Haywood, M., Creze, M., Ojha, D. K., & Bienayme, O. 1996, A&A, 305, 125
- Robin et al. (2000) Robin, A. C., Reylé, C., & Crézé, M. 2000, A&A, 359, 103
- Robin, Reylé, Derrière & Picaud (2003) Robin, A. C., Reylé, C., Derrière, S. & Picaud, S. 2003, A&A, 409, 523
- Rocha-Pinto et al. (2004) Rocha-Pinto, H. J., Majewski, S. R., Skrutskie, M. F., Crane, J. D., & Patterson, R. J. 2004, ApJ, 615, 732
- Rocha-Pinto et al. (2003) Rocha-Pinto H. J., Majewski S. R., Skrutskie M. F. & Crane J. D. 2003, ApJ, 594, L115
- Schlegel, Finkbeiner, & Davis (1998) Schlegel D. J., Finkbeiner D. P. & Davis M. 1998, ApJ, 500, 525
- Searle & Zinn (1978) Searle, L. & Zinn, R. 1978, ApJ, 225, 357
- Stoughton et al. (2002) Stoughton, C., et al. 2002, AJ, 123, 485
- Susa & Umemura (2004) Susa H., Umemura M., 2004, ApJ, 610, L5
- White (1978) White, S. D. M. 1978, MNRAS, 184, 185
- White & Rees (1978) White, S. D. M. & Rees, M. J. 1978, MNRAS, 183, 341
- Windhorst et al. (1991) Windhorst, R. A., et al. 1991, ApJ, 380, 362
- Yanny et al. (2003) Yanny B. et al. 2003, ApJ, 588, 824
- Yanny et al. (2004) Yanny B., et al., 2004, ApJ, 605, 575