Measuring Galaxy Environments with Deep Redshift Surveys
Abstract
We study the applicability of several galaxy environment measures (-nearest-neighbor distance, counts in an aperture, and Voronoi volume) within deep redshift surveys. Mock galaxy catalogs are employed to mimic representative photometric and spectroscopic surveys at high redshift . We investigate the effects of survey edges, redshift precision, redshift-space distortions, and target selection upon each environment measure. We find that even optimistic photometric redshift errors smear out the line-of-sight galaxy distribution irretrievably on small scales; this significantly limits the application of photometric redshift surveys to environment studies. Edges and holes in a survey field dramatically affect the estimation of environment, with the impact of edge effects depending upon the adopted environment measure. These edge effects considerably limit the usefulness of smaller survey fields (e.g. the GOODS fields) for studies of galaxy environment. In even the poorest groups and clusters, redshift-space distortions limit the effectiveness of each environment statistic; measuring density in projection (e.g. using counts in a cylindrical aperture or a projected -nearest-neighbor distance measure) significantly improves the accuracy of measures in such over-dense environments. For the DEEP2 Galaxy Redshift Survey, we conclude that among the environment estimators tested the projected -nearest-neighbor distance measure provides the most accurate estimate of local galaxy density over a continuous and broad range of scales.
Subject headings:
methods:data analysis, methods:statistical, galaxies:high-redshift, galaxies:statistics, surveys, large-scale structure of universe1. Introduction
The observed properties of galaxies have long been known to depend upon the environment in which they are located. For instance, red, non-starforming galaxies (e.g. local ellipticals and lenticulars) are systematically over-represented in highly over-dense environments such as clusters (e.g. Davis & Geller, 1976; Dressler, 1980; Postman & Geller, 1984; Balogh et al., 1998). Recent studies have shown that the observed correlations between galaxy properties and environment are not limited to the cores of rich clusters, but extend to less dense domains including the outer regions of clusters, galaxy groups, and the field (e.g. Balogh et al., 1999; Carlberg et al., 2001; Blanton et al., 2003; Balogh et al., 2004; Croton et al., 2005).
There are a variety of physical processes that can readily explain these observational trends, including the action of dynamical friction, tidal stripping, or gas pressure in dense environments. These mechanisms, in combination with the hierarchical model of galaxy formation (Kauffmann et al., 1993; Somerville & Primack, 1999; Cole et al., 2000), in which galaxies form in less dense environments and are then accreted into larger groups and clusters, are generally consistent with the current observations. From the empirical evidence, however, it remains uncertain in what environment(s), by what mechanisms, and on what time-scales galaxies evolve from a field-like population to a cluster-like population. Still, the strong correlation of local galaxy density with galaxy properties over a broad range of environment does indicate that it plays an important role in galaxy formation and evolution.
To study galaxy properties spanning a broad and continuous range of local environment requires a thorough census of the 3-dimensional galaxy distribution over a large volume. Such data sets are only collected via large, systematic redshift surveys. For the nearby galaxy population, wide-field spectroscopic and photometric surveys (e.g. 2dFGRS, Colless et al. 2001 and SDSS, York et al. 2000) have provided excellent data sets for studying galaxy environments ranging from voids to rich clusters. Recent results from these large surveys have found that galaxy environments correlate strongly with the colors, luminosities, and morphologies of local galaxies (e.g. Balogh et al., 2004; Hogg et al., 2003; Blanton et al., 2003; Hogg et al., 2004).
With the advent of new high-redshift surveys (e.g. the VLT-VIMOS Deep Survey (VVDS), Le Fevre et al. 2003, 2004 and the DEEP2 Galaxy Redshift Survey (DEEP2), Davis et al. 2003; Faber et al. 2005), studies of galaxy environment will be able to extend beyond the local universe. Such deep, high-redshift surveys will provide a representative snap-shot of the galaxy population and corresponding local densities when the universe was half its present age, thereby permitting an investigation into the influence of environment upon galaxy evolution and formation. That is, extending environment studies to higher redshift will enable a determination of whether the correlations among galaxy properties observed in the local universe are the result of physical processes acting over the entire lifetime of the galaxy or whether the correlations were established during the early formation of the galaxy.
While redshift surveys have grown in scale and studies of galaxy environment have increased in prevalence, few published tests have detailed the degree to which environment measures are affected by survey limitations. For instance, the confined sky coverage of surveys introduces geometric distortions (or edge effects) which bias local density measures near boundaries or holes in the survey field. Environment statistics can also be impacted by the redshift precision and target selection requirements of a given survey. Mock galaxy catalogs provide an excellent means for testing the biases introduced to a given density measure by effects such as these.
In this paper, we test the applicability of several popular density estimators within deep redshift surveys utilizing the mock galaxy catalogs of Yan et al. (2004). In particular, we investigate the effects of redshift precision, survey field edges, redshift-space distortions, and target selection. We also devote specific attention to the DEEP2 survey with the goal of identifying the optimal density measure for use within the survey. Within this study, we do not consider global measures of environment trends (such as correlation functions), but instead focus on measures which can estimate environmental properties of individual objects. The outline of the paper is as follows. In the next section, we present the mock galaxy catalogs used to test environment measures at high redshift. Subsequently (§3), we describe the environment measures to be tested. In §4, we examine the significance of redshift precision in determining local galaxy densities. In §5, we conduct a detailed analysis of edge effects with respect to each environment parameter. In §6 and §7, we then address the influence of redshift-space distortions and target selection on the various environment estimators. In §8, the roles of completeness and the survey selection function are discussed. Finally in §9 and §10, we conclude with a summary of the applicability of each environment measure at high redshift and a discussion of the suitability of current deep surveys to measuring local galaxy densities.
2. Simulating Deep Redshift Surveys
Beginning with the Center for Astrophysics Redshift Survey (Davis et al., 1982), large redshift surveys have played a major role in studying galaxy properties, measuring cosmological parameters, and studying the large-scale structure of the universe. With improvements to astronomical instruments, local redshift surveys have ballooned in size and surveys at high redshift have become possible. At present, high- surveys take two forms: (a) obtaining precise redshifts using spectroscopic observations of galaxies (e.g. DEEP2 and VVDS) and (b) using deep photometry in many passbands to make less precise photometric redshift estimates (e.g. COMBO-17, Wolf et al., 2003). Each of these has its advantages and disadvantages.
Even utilizing highly-multiplexed, multi-object spectrographs (e.g. DEIMOS, Faber et al. 2003) on large-aperture telescopes, a deep spectroscopic redshift survey requires a vast amount of telescope time and is invariably limited in the number of galaxies for which it can measure redshifts. Slit or fiber collisions constrain the number of objects able to be targeted during a given exposure while the forest of OH sky lines in the optical and infrared plus instrument defects and limited signal-to-noise cause redshifts to be missed for some percentage of targeted objects. Spectroscopic surveys benefit from a higher level of redshift precision which permits studies of kinematics within galaxies and galaxy groups, while also measuring spectral properties such as emission-line equivalent widths. On the other hand, using an imager with a large field-of-view and observing in many passbands, less precise photometric redshifts can be obtained for nearly all galaxies above a given magnitude limit in the targeted field. For this reason, photometric surveys are often able to build larger samples and are ideal for measuring the galaxy luminosity function or galaxy-galaxy lensing for which a high level of velocity accuracy is not necessary.
In this paper, we employ the simulated galaxy catalogs of Yan et al. (2004) to model both photometric and spectroscopic surveys at . The simulations and all work in this paper employ a CDM cosmology with , , , and . The mock catalogs are derived from N-body simulations by populating dark matter halos with galaxies according to a halo occupation distribution (HOD) function (Peacock & Smith, 2000; Seljak, 2000) which describes the probability distribution of the number of galaxies in a halo as a function of the host halo mass. The luminosities of galaxies are then assigned according to the conditional luminosity function (CLF) introduced by Yang et al. (2003), which describes the luminosity function in halos of mass . Models for the HOD and the CLF are constrained from the 2dFGRS luminosity function (Madgwick et al., 2002) and two-point correlation function (Madgwick et al., 2003). By assuming that the manner in which dark matter halos are populated with galaxies does not evolve from to (Yan et al., 2003), the mock catalogs are built using simulation outputs at corresponding redshifts. The simulated galaxy catalogs show excellent agreement with the lower-z DEEP2 correlation function (Coil et al., 2004) and the COMBO-17 luminosity function (Wolf et al., 2003); they therefore should provide a realistic data set for studying measures of the environment of galaxies at . For further details regarding the construction of the mock catalogs, refer to Yan et al. (2003).
From the volume-limited mock catalogs, we are able to mimic a typical photometric redshift survey by selecting all galaxies above a given magnitude limit and applying to each galaxy redshift a random offset drawn from a Gaussian distribution with standard deviation . We utilize the DEEP2 survey as a model high-redshift spectroscopic survey. The volume-limited mock catalogs are selected according to the DEEP2 magnitude limit of and passed through the DEEP2 target-selection and slitmask-making code, which is able to place approximately 60% of available targets on slitmasks for spectroscopy (Davis et al., 2004). Finally, 30% of objects are randomly rejected to reflect a conservative redshift success rate of . The 12 mock catalogs cover fields of in area with a total of DEEP2 slitmasks tiling the 1 square degree. To simulate larger survey fields, we tiled multiple mock catalogs without overlap or discontinuity. Such large-field mocks were essential for studying edge-effects (§5) and for building large sample sizes.
In each mock catalog, we have a complete tally of the total galaxy distribution down to a luminosity of , along with subsets of objects which pass the DEEP2 target-selection criteria, were placed on a slitmask for observation, and yielded a successful redshift. Such a census enables detailed study of the survey selection function and the manner in which slitmask-making and target-selection affect environment statistics. Throughout this paper, we utilize several subsets drawn from the mock catalogs as described in Table 1. Note that for each mock galaxy, the simulations provide accurate positions in both real-space and redshift-space.
the mock galaxy catalogs
| Sample | Description |
|---|---|
| volume-limited | full mock galaxy catalog; |
| magnitude-limited | |
| DEEP2-selected | ; |
| passed DEEP2 target-selection and | |
| slitmask-making criteria; random | |
| redshift success rate; high redshift | |
| precision |
Note. — We present a list of commonly used subsamples
drawn from the mock galaxy catalogs of Yan et al. (2004).
3. Environment Measures
The environment of a galaxy is typically defined in terms of the density of galaxies located in its immediate vicinity. However, a variety of density measures are often employed in estimating environment. For example, many previous analyses have focused on the identification of predefined groups or clusters of galaxies, which can be contrasted to those galaxies not inhabiting these over-dense regions – that is, the field population (e.g. Kuntschner et al., 2002; van den Bergh, 2002; Lewis et al., 2002; Christlein, 2000). Another approach is to instead derive a continuous measure of the galaxy density distribution, such as by measuring the distance to the -nearest neighbor (e.g. Gómez et al., 2003; Mateus & Sodré, 2004) or by directly smoothing the observed galaxy distribution on a fixed scale (e.g. Hogg et al., 2003; Beuing et al., 2002; Kauffmann et al., 2004). The underlying theme in each of these methods is that one requires a measure of the local number density of galaxies at the position of each galaxy in the sample.
In our analysis, we focus on density estimators that do not rely on identifying galaxy groups or clusters in any way. Lumping galaxies into predefined classifications provides a poorly sampled range of galaxy environments especially when compared to continuous measures of environment. At high redshift, where dense regions are commonly under-sampled and clusters and groups are less numerous, a more continuous definition of environment is all the more desirable. Still, identifying galaxies in groups at high is possible and has been tested in a separate paper (Gerke et al., 2005). In this analysis, we compare three popular density estimates: -nearest-neighbor distance, counts in an aperture, and the Voronoi volume. This set of measures is in no way presumed to be complete. Other promising methods for measuring local galaxy density, including using a Gaussian kernel to smooth the galaxy distribution over a given scale (e.g. Hogg et al., 2003; Balogh et al., 2004), are not discussed in this work.
3.1. -Nearest-Neighbor Distance, and
As first employed by Dressler (1980), the local galaxy density can be estimated using the distance to the -nearest, spectroscopically-observed neighbor of a given galaxy. Often, redshift information is simply employed to exclude foreground and background sources – by restricting neighbors to a given velocity interval – and the nearest-neighbor distance is measured in projection. Commonly, the projected -nearest-neighbor distance, , is expressed as a surface density, . Measuring nearest-neighbor distances in projection is particularly useful when studying the density of galaxies in groups and clusters (e.g. Dressler, 1980; Lewis et al., 2002), where the appropriate velocity interval by which to exclude background and foreground galaxies may be selected according to the velocity dispersion of the group or cluster. In this manner, one may confidently exclude galaxies not associated with the group or cluster; furthermore, as shown in §6, measuring in projection minimizes the impact of redshift-space distortions.
For less dense environments or poorly sampled groups, there may be few neighbors within the selected velocity interval, causing to reflect the distance to other structures rather than the local density. In environments where working in projection is problematic, an alternative is to compute the -nearest-neighbor distance in 3-dimensions by searching in spherical apertures for the -nearest, spectroscopically-observed neighbor. Similar to its projected counterpart, the 3-dimensional (3-d) -nearest-neighbor distance, , is often expressed as a number density, . Throughout this paper, all -nearest-neighbor distances are quoted in units of comoving Mpc and the symbols and are employed to denote the 3-dimensional and projected -nearest-neighbor distances, respectively.
To study the effectiveness of the 3-d and projected -nearest-neighbor distance measures at tracing the local density of galaxies in different environments, we compute both and for a DEEP2-selected sample consisting of 12,636 galaxies as drawn from a mock catalog. In Figure 1, we compare the values of and for each galaxy in the sample as measured using the redshift-space galaxy positions to the measured value of as computed using the real-space positions for each galaxy, which should reflect the true local environment. We find that at high densities, where redshift-space distortions are greater, the projected -nearest-neighbor distance is superior at tracing the real-space density of galaxies but still suffers greatly from peculiar velocities. On scales corresponding to intermediate- and low-density environments, the 3-d measure of is a slightly more accurate estimate of the true galaxy distribution. For a DEEP2-selected mock catalog, of the observed sample resides in the regime where the 3-d -nearest-neighbor distance saturates and loses sensitivity.
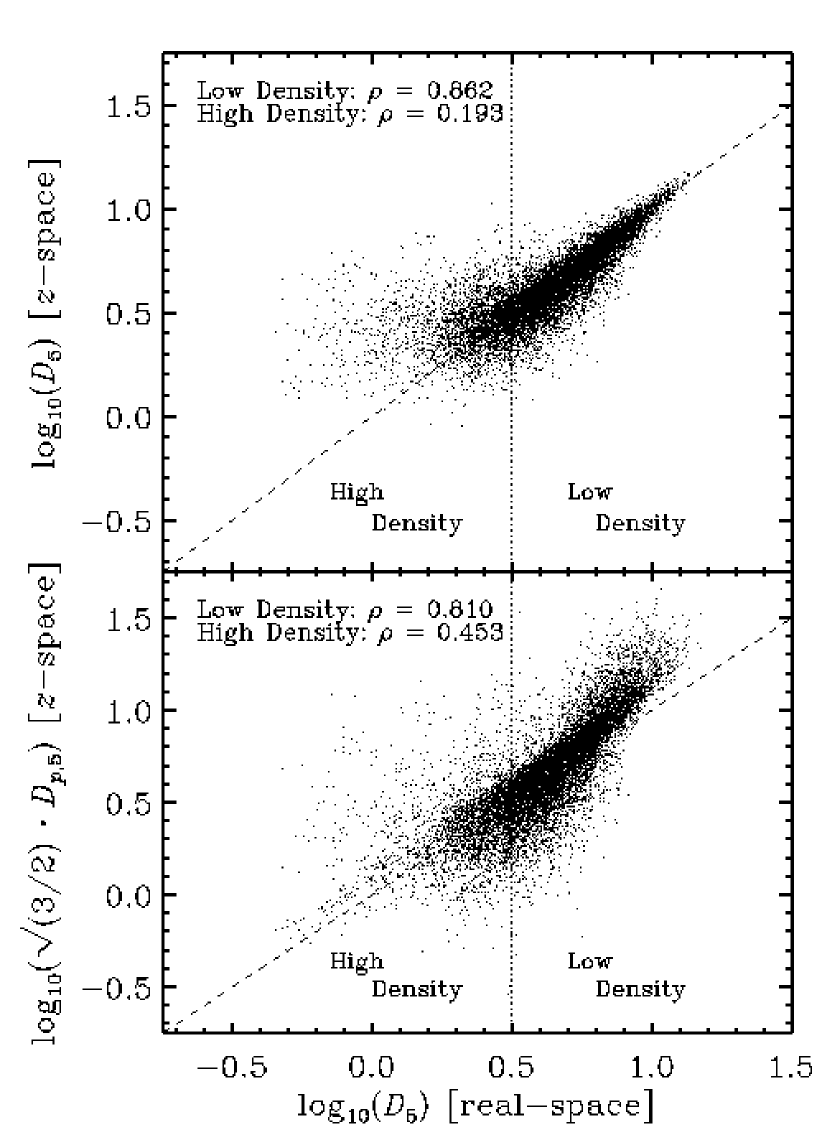
In addition to a lack of sensitivity on given scales, the behavior of the projected and the 3-d -nearest-neighbor distances depends upon the choice of . A measure of the -nearest-neighbor distance effectively smoothes the galaxy distribution in a non-linear fashion according to the adopted value of . If is chosen to be much larger than the richness of typical groups in the sample, then the -nearest-neighbor distances for galaxies in these groups will be pushed to erroneously high values, as it will reflect the distance to the next-nearest structure. In this work, we study both the projected and the 3-d methods for computing the -nearest-neighbor distance employing a variety of values for . We limit most discussion to values of which correspond to the sizes of small groups detected in the DEEP2 survey (Gerke et al., 2005) and to the typical sizes of groups in the mock catalogs (see Fig. 2). For these values of , the sensitivity of the -nearest-neighbor measure is rather independent of . In under-dense environments, the dependence on is very weak, while in dense environments the strong clustering of groups (Padilla et al., 2004; Coil et al., 2005) arranges to curb for . Also, in galaxy groups, redshift-space distortions are a much greater source of error in than small variations in the choice of .
For the projected -nearest-neighbor distance measure, we test the sensitivity of using line-of-sight velocity intervals ranging from to . As shown in Table 2, using a larger velocity interval by which to exclude foreground and background sources increases the accuracy of in dense environments but also sacrifices sensitivity at low densities. We find that for a DEEP2-selected sample, a velocity interval of is best suited for a broad range of environments. Compared to photometric redshift errors (in the best datasets, ), the sizes of the tested line-of-sight velocity windows are small. However, larger velocity intervals sacrifice sensitivity on small scales and provide poorer measures of the local density about each galaxy; a window large enough not to be dominated by photometric redshift errors is also large compared to the typical length-scales of large-scale structure (e.g. the correlation length and typical void sizes), and thus provides a poor measure of environment.

| 3 | 750 | 0.454 | 0.786 | |
| 3 | 1000 | 0.540 | 0.744 | |
| 3 | 1500 | 0.598 | 0.659 | |
| 3 | 2000 | 0.600 | 0.602 | |
| 5 | 750 | 0.384 | 0.831 | |
| 5 | 1000 | 0.451 | 0.808 | |
| 5 | 1500 | 0.496 | 0.736 | |
| 5 | 2000 | 0.505 | 0.673 |
Note. — For a range of velocity intervals from to , we compute the projected -nearest-neighbor distance for the galaxies in a DEEP2-selected mock catalog where is the velocity window over which to exclude foreground and background interlopers. Each set of values are correlated against the real-space distances computed for the same mock catalog, as illustrated in Figure 1. We present the Spearman ranked correlation coefficients, , in the low density and high density regimes. For , the division between the low and high density regimes is made at , while for the distinction is drawn at .
3.2. Counts in an Aperture,
Another method for estimating the local galaxy density is to count galaxies within a fixed metric aperture. For example, Hogg et al. (2003) count spectroscopically-observed galaxies in the SDSS within spheres of radii comoving Mpc centered on each spectroscopically-observed galaxy. In high-redshift surveys where the survey field may cover square degree or less, such a large spherical aperture will be dramatically affected by the survey edges (see §5). For instance, within a field (i.e. comoving Mpc on a side at ), 81% of spherical apertures with a radius of comoving Mpc will fit within the surveyed field, while for apertures of radius and comoving Mpc only 49% and 25% of the field, respectively, will be unaffected by edges. Furthermore, local studies indicate that larger apertures do not provide any advantage or additional information worth this high price. Both observational and theoretical studies, suggest that galaxy properties are more closely related to dark matter halo mass and small-scale environment than the large-scale environment of the galaxy (e.g. Lemson & Kauffmann, 1999; Blanton et al., 2004).
While choosing smaller spherical apertures would reduce the amount of survey volume affected by edges, apertures smaller than approximately along the line-of-sight will not be sensitive to galaxy groups or clusters. The counts in an aperture measure effectively smooths the data on some adopted scale, thereby losing sensitivity on smaller and larger scales. In our analysis, we employ a series of cylindrical apertures measuring 1–2 comoving Mpc transverse (radius) and along the line-of-sight. The dimensions of our cylindrical apertures are chosen to match the typical sizes of halos in the simulations (Yan et al., 2004).
3.3. The Voronoi Volume,
The Voronoi volume is a geometric measure that has seen use from engineering and biology to astronomy (Ramella et al., 2001; Marinoni et al., 2002). Unlike counts in an aperture, the Voronoi volume does not smooth the galaxy distribution in any way. It provides a continuous, adaptive measure of galaxy density on all scales by measuring a unique volume about each spectroscopically-observed galaxy.
As illustrated in Figure 3, the Voronoi partition of space is the three-dimensional analogue of the two-dimensional Dirichlet tessellation, in which a plane containing a set of data points is divided into a set of polygons, each containing one of the points. A Voronoi polyhedron is the unique three-dimensional convex region of space surrounding a data point (the seed), such that within the polyhedron every point is closer to the seed than to any other data point. The faces of the Voronoi polyhedron are defined by the perpendicular bisecting planes of the vectors connecting the seed to its neighbors, where a seed’s neighbors are those points connected to it by the Delaunay complex – the set of tetrahedra whose vertices are at the data points and whose unique, circumscribing spheres contain no other data points. The Voronoi partition and Delaunay complex are thus geometrical duals of one another.
Computing the Voronoi partition for a galaxy redshift survey provides a natural way to measure the local density of galaxies, since the volume of a galaxy’s Voronoi polyhedron will vary inversely with the distance to its closest neighbors. For this reason, the Voronoi volume associated with each galaxy serves as a natural parameterization of that galaxy’s environment. Galaxies in dense regions will have small Voronoi volumes, while isolated galaxies will have larger volumes. Our methods for computing the Voronoi partition are identical to those of Marinoni et al. (2002), and we refer the reader to that work for computational details and for further discussion of the usefulness and historical context of the Voronoi partition and Delaunay complex. In this paper, we will employ the symbol to denote the Voronoi volume of a given galaxy and all Voronoi volumes are measured in units of comoving .

4. Redshift Precision and Target Selection Rate: Photometric versus Spectroscopic Surveys
As discussed in §2, photometric and spectroscopic redshift surveys differ in the precision with which they are able to measure galaxy redshifts. To test the significance of redshift precision in measuring local galaxy environment, we have produced a variety of mock surveys with differing characteristics. First, we simulate two photometric redshift surveys which mimic the varying precisions of the COMBO-17 photometric redshift survey quoted in the literature. Our first simulated photometric redshift survey adopts a magnitude limit of and redshift uncertainty of which reaches equally deep and is more precise than the COMBO-17 specifications of , as given by Wolf et al. (2003). In addition, we simulate a photometric redshift survey with the same magnitude limit of and a redshift precision of as specified for COMBO-17 by Taylor et al. (2004). Both magnitude-limited samples are drawn from the same volume-limited mock catalog and include 22,961 galaxies covering a field. Note that our assumed redshift uncertainties are lower limits to the redshift precision for the COMBO-17 survey. As discussed by Bell et al. (2004), the photometric redshift precision for COMBO-17 depends strongly on the galaxy type and redshift; galaxies such as starbursts which lack a strong 4000Å-break yield redshifts with much greater uncertainties , while at higher redshifts K-correction uncertainties introduce systematic redshift errors.
Running the same volume-limited galaxy catalog through the DEEP2 target-selection and slitmask-making software and assuming a conservative redshift success rate (see §2), we also produce a mock spectroscopic sample with redshift precision of , mimicing the DEEP2 redshift survey. This DEEP2-selected spectroscopic sample includes 9,302 galaxies covering the same 1 square degree field (sampling of galaxies to the magnitude limit). To simulate the VVDS “deep survey” in the CDF-S (Le Fevre et al., 2004), we randomly select 25% of objects to the same magnitude limit. This “VVDS-selected” sample is an optimistic simulation of VVDS, assuming a 100% redshift success rate (Vanzella et al., 2004) and ignoring differences in the bandpass used. Lastly, as a comparison sample, we select the full magnitude-limited mock (22,961 galaxies at ) assigning redshifts according to the real-space positions of the galaxies as defined in the mock simulations. Each environment estimator (-nearest-neighbor distance, Voronoi volume, and counts in an aperture) is then computed on the photometric, spectroscopic, and real-space galaxy samples.
For this comparison, we restrict our analysis to the redshift range and to only those galaxies at transverse distances of greater than comoving Mpc from the nearest edge in the survey volume. These restrictions make edge effects in both the redshift and transverse directions negligible, but do not introduce any selection biases (see §5). Note that the mock catalogs are not subject to interior edges; that is, the simulations cover a contiguous 1 square degree of sky with no holes.
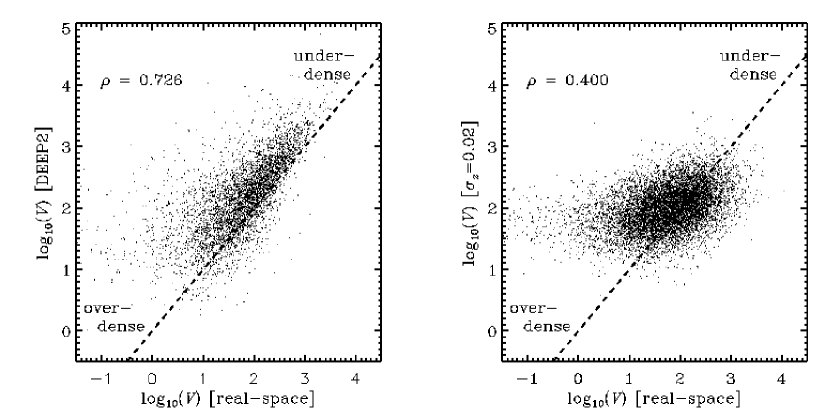
We find that the precision of even the best photometric redshifts is not sufficient to measure local galaxy environments. Figure 4 shows the comparison between Voronoi volumes, , as measured using the real-space galaxy positions compared to those calculated using the observed redshifts for two representative surveys. Even assuming redshift errors as small as , the environment measured in a photometric redshift survey is insensitive for all but the very lowest density environments; the Spearman ranked correlation coefficient between the real-space and photometric measures of Voronoi volumes is . For the spectroscopic survey, redshift-space distortions introduce some scatter at high densities, but the overall distribution of environments is well measured. In all, the Voronoi volumes measured from the observed spectroscopic redshift distribution trace the real-space Voronoi volumes with much greater precision, yielding a correlation coefficient of . Very similar results are observed for the , , and environment estimators.
In Table 3, we expand our analysis to a better sampled range of redshift uncertainties. Even if the precision of photometric redshifts is greatly improved – by a factor of 2 or 4 – we find that low-resolution spectroscopic surveys with galaxy sampling comparable to DEEP2 provide a significantly better trace of the 3-dimensional galaxy environment. It is only at very high redshift precisions and when measuring densities in projection that photometric redshift surveys are able to rival their spectroscopic counterparts as probes of galaxy environment.
Among the spectroscopic redshift surveys simulated, the greater sampling and improved redshift precision of the DEEP2 survey prove significantly superior to the VVDS in tracing the real-space density of galaxies. On the other hand, at precisions better than the uncertainty in DEEP2 redshifts, redshift-space distortions dominate the ability to measure local densities and thereby limit any advantage of improved redshift measurements (see Table 3). Note that the galaxy samples in Table 3 transition from a magnitude-limited sample at low redshift precision to mimic photometric or grism spectroscopic redshift surveys to a sample selected using the DEEP2 target-selection and slitmask-making procedures or a VVDS-like selection to simulate higher-resolution spectroscopic surveys, which have superior redshift precision but lower sampling rates.
| Sample | ||||
|---|---|---|---|---|
| 0.05 | 0.307 | 0.310 | 0.389 | |
| 0.02 | 0.400 | 0.396 | 0.473 | |
| 0.01 | 0.494 | 0.478 | 0.575 | |
| 0.005 | 0.596 | 0.579 | 0.688 | |
| 0.0025 | 0.675 | 0.677 | 0.803 | |
| VVDS-selected | 0.001 | 0.640 | 0.655 | 0.689 |
| DEEP2-selected | 0.0025 | 0.611 | 0.625 | 0.704 |
| DEEP2-selected | 0.001 | 0.691 | 0.716 | 0.785 |
| DEEP2-selected | 0.0001 | 0.726 | 0.749 | 0.802 |
| DEEP2-selected | 0 | 0.726 | 0.751 | 0.801 |
Note. — For a range of redshift precisions we compute the -nearest-neighbor distance , Voronoi volume , and the projected -nearest-neighbor distance , for the galaxies in a mock catalog. As described in the main text, three samples are selected from the same mock catalog according to (a) the DEEP2 target-selection and slitmask-making procedure [DEEP2-selected], (b) a magnitude limit of , and (c) a 25% random sampling to the same magnitude limit of [VVDS-selected]. Restricting to the redshift range and more than comoving Mpc removed from a field edge, the magnitude-limited sample contains 9,310 galaxies while the DEEP2-selected and VVDS-selected samples include 4,538 and 2,375 of those galaxies, respectively. For each sample and redshift precision, we (rank) correlate estimates of , , and with similar measures computed on a magnitude-limited sample using the real-space galaxy positions. Note that corresponds to the redshift precision of the DEEP2 survey and that surveys reflecting the COMBO-17, VVDS, and DEEP2 attributes have been highlighted in bold font in the table.
5. Edge Effects
When measuring galaxy densities within any survey, one must always be careful of edge effects introduced by the limited area of sky covered in the survey. Even using the largest optical telescopes and an instrument with a generous field-of-view, a deep redshift survey is limited in its ability to cover large regions. Furthermore, to minimize the effects of cosmic variance on the data set, a high-redshift survey is likely to spread the sky coverage over several fields. This limits the amount of contiguous sky coverage and increases the proportion of the survey area that is near an edge. In addition to the edges created by the chosen geometry of the survey field(s), edges and holes can be created in the data set by effects such as bright stars in a field or problematic regions in photometric detection which prohibit any galaxies from being targeted there. To start, we will restrict our discussion to survey edges in the plane of the sky, but later discussion will address edges in the line-of-sight direction.
The general effect of edges on each density estimator is to push the measurement towards lower density. To quantify the degree to which each environment measure is affected by edges we compute each measure on a large DEEP2-selected spectroscopic mock galaxy catalog covering a wide field, . From the center of this larger simulation we extract a smaller rectangular survey field, covering , and rerun each environment measure on this data set. For every galaxy in the smaller survey field, we then have measurements of environment unaffected by edges (when measured on the larger sample) and measurements in which survey edges play a greater role (when measured on the smaller field). Trimming to the redshift range , the smaller sample consists of 2,803 galaxies. In the following subsections, we discuss how each environment measure is affected by the edges of the survey region on the plane of the sky. Note that we also ran tests incorporating holes and irregular survey edges with very little change in the relative results for the tested environment measures.
For each galaxy in the studied sample, we express the difference in a given environment measure due to survey edges as a fraction of the width of the distribution for that measure. Specifically, we define the percent change in environment measure for galaxy by
| (1) |
where is the measure of for galaxy computed on the smaller mock, is similarly computed on the wide-field mock, and is a measure of the Gaussian width of the logarithmic distribution of environment measure as calculated in the larger simulation. Quantifying the change in each environment measure in this fashion enables the role of edge effects to be compared between different environment estimators in a uniform manner.
5.1. Survey Edges and -Nearest-Neighbor Distance
The -nearest-neighbor distance environment measure – in both projection and 3-dimensions – is affected by edges in a predictable manner. Any galaxy with an edge located closer than the measured -nearest-neighbor distance must be affected by the survey edges. However, to remove all such galaxies based on this criterion ( or ) biases the sample towards over-dense environments by excluding less-dense regions over a greater volume than more-dense regions. To avoid such biasing of the sample, a simple cut in edge distance can be made – excluding all galaxies within some distance of the nearest edge. This cut introduces no environment-dependent bias, but does allow some contamination to the sample at under-dense environments depending on the severity of the cut. In our simulations, we find that removing all galaxies within comoving Mpc of a survey edge creates a catalog with minimal contamination (roughly 5% of the sample has ) and still retains 65% of the data set. Relaxing the constraint to comoving Mpc, the level of contamination in the sample doubles to with while the percentage of the sample retained increases to .
As illustrated in Figure 5, we find that edge-effects show a clear dependence on ; the level of contamination due to survey edges in the plane of the sky increases by roughly a factor of two for relative to . Also, for a fixed value of , the projected -nearest-neighbor distance is slightly more robust to edge-effects in the regime where sample size is maximized ( in Figure 5).

5.2. Survey Edges and Counts in an Aperture
For an aperture of fixed comoving size, the edge effects upon the counts in an aperture density measurement are easily understood and cleaned from the sample. Only galaxies located within of an edge are affected, where is the transverse diameter of the chosen aperture. Thus, by removing any galaxies within of an edge, the sample is entirely devoid of edge-affected galaxies. Such a trimming of the data set does not introduce a selection effect, that is, there is no bias towards environments of a given sort.
In our simulated spectroscopic data set of 2,803 galaxies, of the sample are positioned within of a survey edge using a cyclindrical aperture of comoving Mpc. However, only for a scant of the sample did we find when comparing measurements of made on the smaller simulation to those made on the wide-field sample. One possible means for salvaging some edge-affected galaxies would be to scale the measured counts in each aperture by the amount of the aperture contained within the survey area. Due to the low rate at which is perturbed by survey edges, however, such a correction actually causes an overestimate of for the majority of galaxies near the edge of the survey field.
5.3. Survey Edges and Voronoi Volumes
Due to the geometrical complexity of the Voronoi tesselation, understanding the effects of edges on the calculated Voronoi volumes is less straightforward than for the previously discussed density measures. For galaxies very close to exterior edges in the survey field, Voronoi volumes can be unbounded and such galaxies should be consequently discarded from the sample. On a more subtle level, edge effects – including interior edges – will also cause volumes to be increased in size while the volumes still remain bounded. Some of these edge-affected volumes can be detected as having Voronoi vertices outside of the survey field. However, many other edge-affected Voronoi volumes are not detectable in such a manner.
As illustrated in Figure 6, even excluding galaxies located near a survey edge (e.g. within comoving Mpc), the distribution of Voronoi volumes is still greatly affected by edges with a bias towards large volumes being pushed to even larger values (see Fig. 6). It is possible to minimize this effect by retaining only galaxies with below some limit. In our simulations, by truncating at , the amount of contamination due to edge effects can be reduced to approximately 20% of the sample with . While making such cuts according to distance to the nearest edge and Voronoi volume effectively reduces the number of edge-affected galaxies in the sample, it also restricts the dynamic range of the Voronoi measure and considerably reduces the size of the sample. For our simulated spectroscopic sample of 2,803 galaxies, the Voronoi volume density measure was the most dramatically affected by edges with of the sample being corrupted, that is, having .

5.4. Effects of Finite Redshift Range
As a secondary effect, the finite redshift range probed by any survey imposes edges in the line-of-sight direction. The role of these edges is more easily handled by restraining all scientific analysis to a limited, well-sampled range of redshifts. In the DEEP2 survey, the ability to measure redshifts at or decreases significantly as the [OII] emission-line doublet leaves the observed optical window. In a DEEP2-selected mock catalog, we find that by restricting our sample to those galaxies at , less than 1% of the sample has a -neareast-neighbor distance, , greater than the distance to the or edge. Similar contamination rates are found for the other environment estimators.
A second concern for spectroscopic redshift surveys is the possibility of missing redshifts over specific wavelength intervals, especially in the far-optical and near-infrared where OH sky lines can dominate the spectrum. At where optical surveys often rely upon a singular spectral feature (e.g. the [OII] doublet at ) for redshift measurements, a hole in wavelength coverage translates directly into a hole in the survey’s redshift sampling. For the DEEP2 survey, the high-resolution of the DEIMOS data minimizes this effect, as the sky lines are then narrower than the components and spacing of the [OII] doublet. In truth, the DEEP2 redshift distribution exhibits no significant cross-correlation with a sky spectrum mapped to redshift according to either the central wavelength of the [OII] doublet or the wavelengths of either subcomponent (Newman et al., 2005). However, for lower resolution surveys such as the VVDS, windows of redshift insensitivity may be a concern that must be addressed in measuring galaxy densities.
6. Redshift-Space Distortions
While spectroscopic redshift surveys are able to measure galaxy redshifts with great precision, redshift measurements by nature are measurements of velocity and not distance. Accordingly, converting differences in redshift to relative line-of-sight distances is subject to the peculiar velocities of the galaxies. Such peculiar motions are greatest in dense regions such as groups or clusters where the velocity dispersion of the group causes the inter-member spacing to be larger in redshift space than in real space. Due to this environmental dependency of redshift-space distortions, it is essential to understand the manner in which they affect a given galaxy density measure.
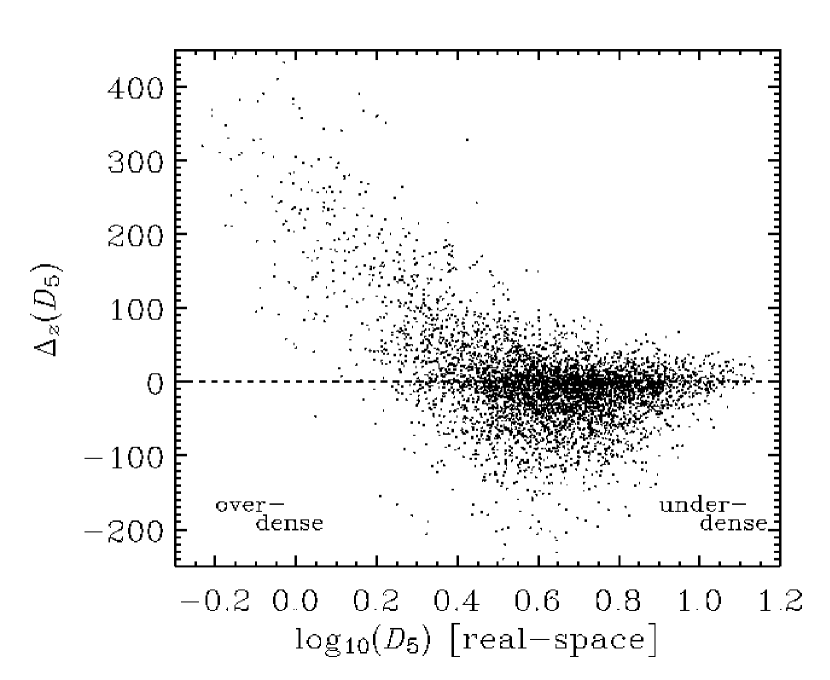
Within a mock DEEP2-selected spectroscopic galaxy catalog covering , we compute each environment measure using the both real-space positions of the galaxies and the observed redshift-derived positions. Restraining our analysis to galaxies at edge distances greater than comoving Mpc and within the redshift range , we quantify the effect of redshift-space distortions on each environment estimator by calculating the change in each measure as computed on the real-space mock relative to the corresponding measure derived from the observed spectroscopic mock. As in §5, we express the difference in a given environment measure as a fraction of the width of the real-space distribution for that environment measure. For example, the percent change in environment measure for galaxy is given by
| (2) |
where is the measure of for galaxy computed from the redshift-derived position and is similarly computed from the real-space position. The width, , is determined via a Gaussian fit to the logarithmic distribution of environment measure for all galaxies in the real-space simulation. Here, can be measured on the real-space distribution of or the redshift-space distribution with negligible difference for the DEEP2-selected sample.
As illustrated in Figure 7, the Voronoi volume and the 3-dimensional - or -nearest-neighbor distances are similarly affected by redshift-space distortions. For each measure, the effects of redshift-space distortions are non-negligible and as shown in Figure 8 are greatest in over-dense environments. In comparison to the and 3-d measures, the counts in an aperture density estimator, , and projected -nearest-neighbor measure, , are less affected by the “fingers-of-god” due to their effective smoothing in the redshift direction; by definition, the projected estimators, and forfeit sensitivity in the redshift direction, which reduces their susceptability to redshift-space distortions. For nearly 80% of the sample, is unaffected by peculiar motions when using a cylindrical aperture with a length of and diameter of comoving Mpc. The sensitivitity of to redshift-space distortions is somewhat dependent upon the choice of the aperture size in the line-of-sight direction such that a smaller aperture is more adversely affected. For more than 90% of galaxies in our sample, we find , again using an aperture with length of . Similar results are found for the projected -nearest-neighbor distance measure; more than 80% of the sample meets the criterion for and using a velocity interval of to exclude foreground and background sources.

7. Target Selection and Observation
There are inevitable trade-offs between the number density of sources targeted for observation and the area of sky covered in a redshift survey. Clustering of high-redshift galaxies and fiber or slit collisions on multi-object spectrographs conspire to limit the fraction of target objects which a survey can observe at one time. Furthermore, not every object targeted will successfully yield a redshift, generally due to finite signal-to-noise and instrumental effects.
The DEEP2 redshift survey will target galaxies covering square degrees of sky, over 80 nights on the Keck II telescope (Davis et al., 2004; Faber et al., 2005). This impressive survey, however, will only target approximately 60% of available high-redshift galaxies in its four fields and successfully measure redshifts for about 75% of targeted galaxies. The DEEP2 survey is designed with the goals of studying large-scale structure and galaxy properties at high redshift. Thus, the survey design attempts to maximize the number of redshifts obtained, to sample the galaxy distribution over a broad range of length scales, and to minimize the effects of cosmic variance. Due to slit collisions on DEIMOS slitmasks, the DEEP2 survey systematically under-samples regions of sky with a high surface density of galaxies (see Figure 9). It is critical for a study of galaxy environments to understand how this bias may affect the environment measured used.

While the detailed effects of target selection and redshift incompleteness are clearly specific to each survey, the goal of this section is to understand how a given environment measure is affected by the limited sampling common to all deep redshift surveys. In this work, we adopt the DEEP2 survey as a representative high-redshift, spectroscopic survey. As discussed in §2, the DEEP2 survey targets all galaxies at according to a probabilistic algorithm which preferentially selects high- galaxies. Applying the DEEP2 target-selection and slitmask-making algorithms to a magnitude-limited mock catalog covering , the simulated survey targets and successfully measures redshifts for 2,839 of the 5,866 galaxies in the field and with (assuming a redshift success rate of ). To study the combined effects of target selection, slitmask making, and redshift success, we compute each environment measure on the DEEP2-selected sample and on the full magnitude-limited sample.
As illustrated in Figure 10, the counts in an aperture measure, , shows no indication of an environment-dependent bias in the DEEP2 target selection. If DEEP2 severely under-samples dense environments, then we would expect to see a saturation in the observed value of at high densities relative to the estimation of computed on the magnitude-limited sample. Instead, we find a linear relation extending to dense environments which follows the overall completeness of the DEEP2-selected mock catalog.

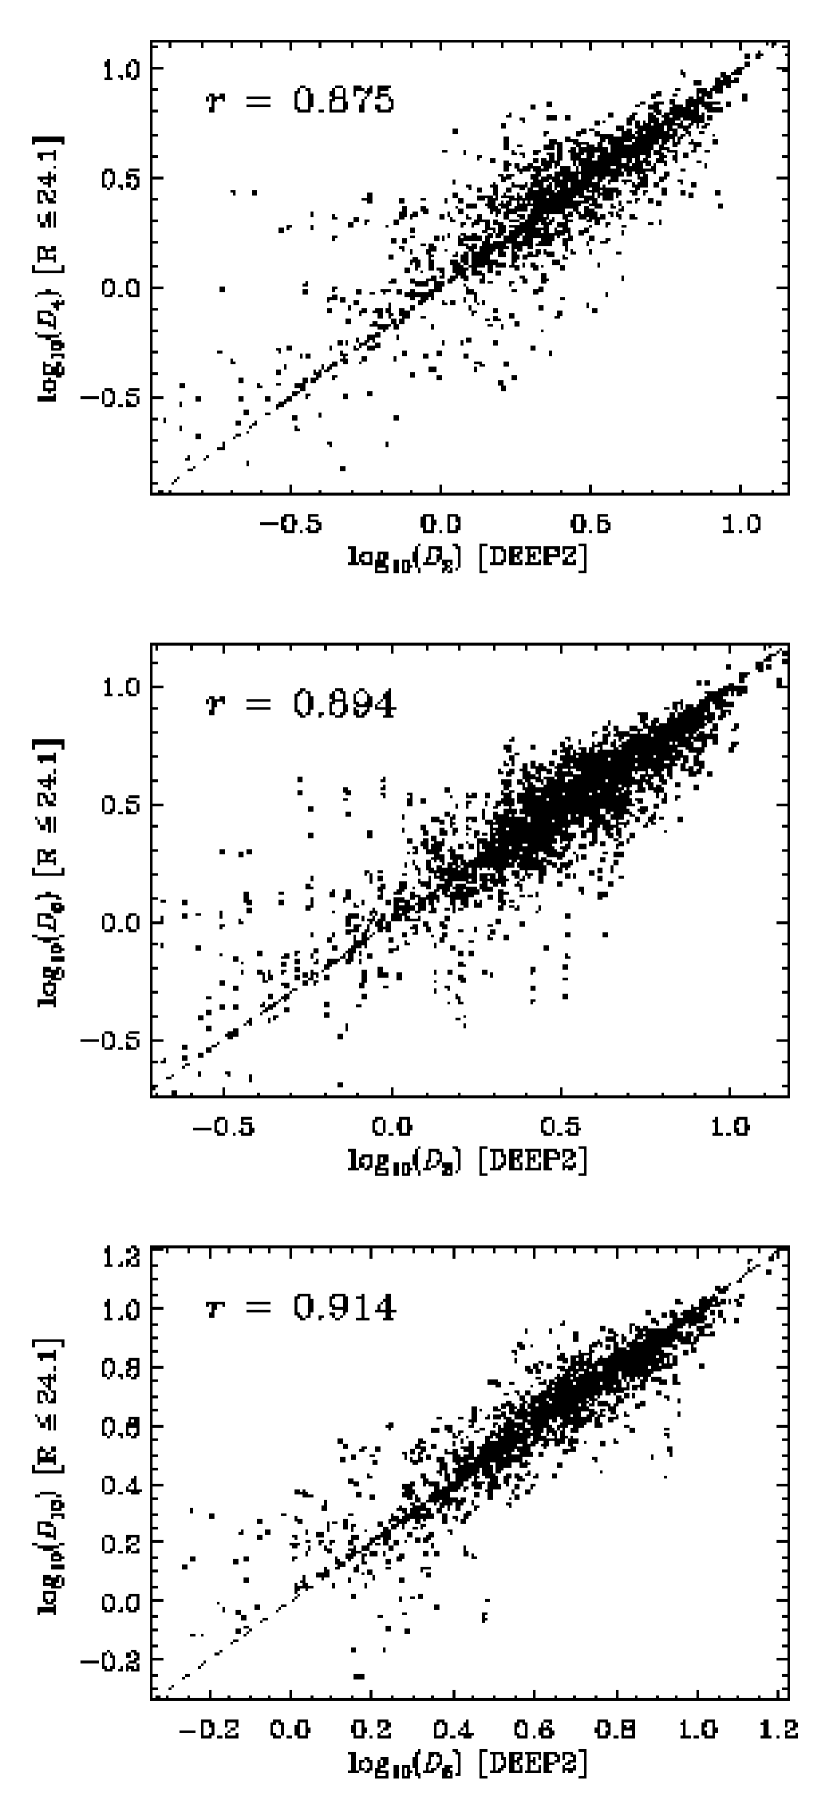
Due to the fixed comoving aperture size of the counts in an aperture environment measure, it probes the same physical scale independent of how the targeted galaxies are selected. The -nearest-neighbor distance measure, on the other hand, can sample systematically different effective scales depending on the galaxy sampling. As illustrated in Figure 11, within the observed spectroscopic sample, the -nearest-neighbor distance is roughly tracing the -nearest-neighbor distance in the magnitude-limited mock; this is sensible, as the DEEP2-selected mock samples of galaxies and what was the -nearest neighbor in the magnitude-limited sample will typically be the in the DEEP2-selected sample. Similarly, the - and -nearest-neighbor distances are effectively tracing the - and -nearest-neighbor distances, respectively, in the magnitude-limited mock (see Figure 11). While target selection and slitmask making affect the scale on which the -nearest-neighbor distance samples the galaxy distribution, they do so in a manner which does not depend upon environment. Thus, while DEEP2 under-samples dense regions of sky, the survey does not under-sample dense environments (see Figure 12).

The limited galaxy sampling of the DEEP2 survey causes the calculated Voronoi volumes to be systematically larger than if computed on the full magnitude-limited sample. We find that the level to which a given Voronoi volume is affected by the DEEP2 sample selection does not depend on or redshift; the limited sampling of the DEEP2 survey simply introduces a random scatter towards larger volumes. Similar to and , we see no evidence for an environment-dependent bias due to the DEEP2 target-selection procedures.
8. Correcting for the Survey Selection Function
For any magnitude-limited survey, the fraction of total galaxies in a volume-limited sample within the magnitude limits varies – commonly decreasing – as a function of redshift. This variable sampling of the galaxy distribution as a function of redshift causes measurements of galaxy densities to depend strongly on . For instance, if a survey under-samples at higher redshift, then estimates of and at high will be artificially inflated relative to estimates at low ; similarly will be under-estimated at higher redshift. Often, magnitude-limited redshift surveys are trimmed to a volume-limited sub-sample to avoid these issues. At high redshift, however, this can dramatically reduce the sample size; for example, selecting a vol-limited sub-sample within a DEEP2-selected mock catalog excludes as much as 40% of the observed galaxies. Furthermore, over regimes where luminosity evolution is significant , even defining a volume-limited sample can be problematic.
To utilize the entire survey sample or for surveys that do not follow a simple magnitude-limited target selection, the variations in the galaxy sampling rate with redshift may be quantified in terms of a survey selection function, , with which density estimates (number of galaxies per comoving volume or number of galaxies per projected comoving area) may be corrected as follows:
| (3) |
where is the density estimate computed from the observed redshift distribution, is a 2-dimensional survey completeness map which accounts for variation in redshift completeness from field to field within the survey, and is the corrected density estimate.
There are several ways to determine the selection function of a survey. The most common approach is to first estimate the galaxy luminosity function (LF) for all of the galaxies in the redshift survey, and then use it to predict the redshift distribution of the sample (e.g. Madgwick et al., 2003). However, unless evolution is correctly incorporated, the LF will not alone be able to correctly predict the redshift dependence of the observed number density of galaxies in a deep survey. Furthermore, working at high redshift, it becomes increasingly difficult to constrain the galaxy LF since observations are limited to the brightest sources, thereby making estimations of the characteristic luminosity, , and faint-end slope, , less secure (e.g. Willmer et al., 2005; Wolf et al., 2003; Bell et al., 2004). For this reason, the selection function for a survey is often estimated by smoothing the observed number density of galaxies, , as a function of redshift and then normalizing according to an assumed dependence of the comoving number density of galaxies on (e.g. Coil et al., 2004). This has the disadvantage that density inhomogeneities in the survey will somewhat affect the derived redshift distribution, even with large smoothing kernels, due to the strength of cosmic variance; also, kernels large enough to minimize this will distort real features in , especially where there are large gradients. On the other hand, any evolution in the observed number density of galaxies with will be automatically incorporated into the estimation of .
Yet another approach to estimating is to compute an analytical fit to the observed data from which the selection function is then derived (e.g. Cooper et al., 2005; Faber et al., 2005). Similar to a selection function estimated from smoothing the observed distribution, an analytical fit to the data – or “fitting” method for estimating – is subject to cosmic variance, but to a much smaller degree than the “smoothing” method, as small-scale variations in which do not match the model are not allowed.
In this work, we estimate the survey selection function for the mock DEEP2 survey according to four different prescriptions: (a) estimating by smoothing the observed distribution in a DEEP2-selected mock catalog assuming no evolution in the comoving number density of galaxies with redshift, using a similar algorithm as Coil et al. (2004) (“smoothing” method), (b) fitting for the selection function assuming a functional form for the redshift dependence of the successfully-observed and again assuming no evolution in the comoving number density of galaxies (“fitting” method), (c) determining the true selection function by computing the number density of available targets over many DEEP2 mock pointings relative to the volume-limited number density of galaxies in the mocks, and (d) deriving from the conditional LF assumed in constructing the mock catalogs. This last approach is identical to the commonly-used method of estimating the selection function using the measured LF and predicting the redshift distribution of the underlying galaxy population. The first two methods, (a) and (b), are analagous to methods one might use to derive solely from the observational data in a deep redshift survey and are subject to cosmic variance and uncertainties in the assumed normalization and redshift dependence of the comoving number density of galaxies. The latter two methods are effectively identical, and test that the mock catalogs are working as advertised.

In Figure 13, we present the mock selection functions derived using each of the methods described above. In general, the agreement between the different approaches for determining is quite good. At the highest redshifts , the different estimations of the selection function differ due to differences in the assumed comoving number density of galaxies at high redshift. The conditional LF adopted in constructing the mock catalogs yields evolution that produces a decrease in the comoving number density, , of galaxies at , while in estimating from the observed mock DEEP2-selected redshift distribution we assume a constant form for . Both estimations of the comoving number density at are consistent with existing observational evidence (Wolf et al., 2003; Willmer et al., 2005).
The footprint of large-scale structure on a selection function derived from smoothing the observed DEEP2-selected mock distribution is reduced if a large smoothing kernel is used; here, we apply two successive smoothing windows of width . If the smoothing kernel is too small, the presence or absence of structures such as filaments or walls (i.e. cosmic variance) will cause us to overestimate or underestimate the fraction of galaxies sampled at a given redshift. Accordingly, over- or under-densities of galaxies will be inappropriately reduced in amplitude when corrected by the survey selection function; e.g. the presence of a filament will push the measured up at its redshift, reducing the corrected density measured, , artificially. Any smoothing large enough to erase the effects of cosmic variance in a survey covering a few square degrees will, unfortunately, cause flattening in the shape of , especially near the limits of the redshift range probed. Due to the drawbacks of smoothing, fitting for the selection function as detailed above is often a superior method for estimating from the observed data, but it does require assumptions about the form of , which smoothing does not.
To study the effectiveness of correcting the measured galaxy densities by the factor of (see eq. 3), we have computed the projected -nearest-neighbor surface density, , within a volume-limited mock catalog covering of sky. We then compare this to the projected -nearest-neighbor surface density, , for those galaxies successfully observed in the DEEP2-selected sample. We then correct these “observed” values using each of the shown in Figure 13, and also attempt an empirical correction. This correction is given by dividing each observed density value by the median for galaxies at that redshift where the median is computed in a bin of . Correcting the measured densities in this manner converts the values into measures of over-density relative to the median density and is similar to the methods employed by Hogg et al. (2003) and Blanton et al. (2003).
Figure 14 illustrates the effectiveness of each selection function at reproducing the redshift dependence of the galaxy density distribution as measured in the volume-limited sample. Within redshift bins of , we compute the difference in median density between the corrected values and the median density, , of objects in the volume-limited sample. While each of the methods for estimating the survey selection function is an improvement over the uncorrected density distribution, an empirical correction (as described in the previous paragraph) which removes all -dependence in the observed density distribution is at least as effective as correcting using a selection function (see Table 4).

| rms | ||
|---|---|---|
| observed | 0.180 | 0.576 |
| smoothing | 0.094 | 0.608 |
| fitting | 0.083 | 0.603 |
| mock CLF | 0.096 | 0.608 |
| z-dependence | 0.049 | 0.606 |
Note. — For each determination of the selection function, we compute the Spearman ranked correlation coefficient, , between the corrected -neareast-neighbor surface density measured in a DEEP2-selected mock catalog and the -nearest-neighbor surface density measured in a volume-limited sample. We also present the RMS fluctuations for each relation plotted in Figure 14 over the redshift range . Each of the selection functions improves the correlation between the measured environment within the DEEP2-selected sample and the “true” environment measured in the volume-limited sample; the empirical correction (z-dependence) has the smallest residual scatter with redshift (partially by construction).
9. Discussion
Every environment measure that we have considered has its advantages and disadvantages. The counts in an aperture measure, , lacks sensitivity in low-density environments and while not lacking in dynamic range, it provides a non-continuous (or quantized) measure of environment, a particular disadvantage if the typical value of is small. It is best suited for working in dense environments where is more robust to redshift-space distortions than other measures and for analyses in which one wishes to classify a sample into coarse density bins or classes. The counts in an aperture statistic is unique among the environment estimators tested in that it measures the galaxy density on a clearly defined, fixed length scale. In contrast, the projected and 3-dimensional -nearest-neighbor distance measures probe the radius enclosing some total number of galaxies and are not direct density measures. The parameter also provides a great advantage via its robustness to survey edge effects.
Similar to the counts in an aperture statistic, the projected -nearest neighbor distance measure is well suited for measuring density in groups and clusters. However, unlike , the projected parameter provides a continuous estimate of galaxy density extending to under-dense environments where it still provides a reasonably accurate measure. While slightly more robust to edges than its 3-dimensional counterpart, , the projected -nearest-neighbor distance is more prone to survey edge contamination than the counts in an aperture statistic. Figure 15 shows the correlation between and as computed in a simualted DEEP2 pointing. The saturation of in less-dense regions is striking and proves to be a significant drawback for a density estimator which is otherwise extremely robust to survey edges and redshift-space distortions.

The 3-dimensional -nearest neighbor distance and Voronoi volume statistics are the best suited for measuring under-dense environments. In groups and clusters, however, these density estimators are significantly affected by redshift-space distortions, causing each measure to become saturated. As illustarted in Figure 16, far removed from survey edges, the Voronoi volume and measures agree very well over all environments observed in the DEEP2-selected mock catalogs. However, for the simulated DEEP2 survey data, the -nearest-neighbor distance is much more robust to edge effects and is less expensive to calculate.
For studies of environment at high redshift, including analysis in the DEEP2 survey, we conclude that among the environment measures tested the projected -nearest-neighbor distance provides the most accurate estimate of local galaxy density over the broadest range of scales. For work in dense environments, the offers great robustness to redshift-space distortions and maintains a reasonably high level of accuracy in under-dense environments. While can be affected by survey edges, contamination from geometric distortions is easily understood and effectively minimized without dramatically reducing the galaxy sample.
10. Conclusions
We have studied the applicability of several galaxy-density estimators within deep redshift surveys at utilizing the mock galaxy catalogs of Yan et al. (2004). We conclude as follows:
-
1.
Photometric redshifts derived from multi-band photometry are not suitable for measuring galaxy densities. Current photometric redshift surveys such as COMBO-17 do not have the redshift precision needed to study environment at high redshift. While more costly to obtain, spectroscopic redshifts are requisite to accurately probe the local galaxy environment in a large survey.
-
2.
With the exception of the counts in an aperture estimator, , survey field edges are a major source of contamination for each environment measure tested. To reduce these edge effects without biasing the sample, all galaxies within some comoving distance ( comoving Mpc for DEEP2) of a transverse survey edge should be rejected. At , excluding all galaxies within comoving Mpc of an edge removes roughly 0.05 degrees along each dimension of the survey field. For smaller high-redshift surveys, such as CFRS (Lilly et al., 1995) or CNOC2 (Yee et al., 2000), edge effects introduce contamination to a considerable portion of the survey data set, thereby limiting the statistical power of the samples. Likewise, for a survey of the GOODS-North field (Giavalisco et al., 2004), edge effects would bias density measurements over of the field. Testing each environment measure on a simulated DEEP2-selected mock sample , the Voronoi volume is most severely affected by edges, with more than 2 times as much contamination from edge effects than or . The counts in an aperture measure displays the best behavior near edges of a survey field, with a nearly negligible portion of the sample contaminated in our simulations.
-
3.
Redshift-space distortions are a significant and fundamental roadblock to measuring accurate galaxy densities in over-dense environments. The -nearest-neighbor distance measured in 3-dimensions and the Voronoi volume are most greatly affected, while estimators such as projected -nearest-neighbor distance and counts in an aperture – which smooth the galaxy distribution along the line-of-sight – are less affected by the “fingers-of-god”. Still, it should be noted that less than 15% of a simulated galaxy sample occupies environments at which the and statistics saturate due to redshift-space distortions.
-
4.
The target selection algorithm employed by a survey could lead to environment-dependent biases in the observed galaxy sample. The DEEP2 survey, which slightly under-samples dense regions of sky, is equally sensitive at high and low densities. That is, we find that the DEEP2 survey equally samples all environments at (see Figure 12). Also, we find that while the DEEP2 survey samples only of galaxies at , this uniform incompleteness simply introduces a random scatter in the measured environments and does not introduce an environment-dependence bias.
-
5.
In examining the evolution of galaxy environments as a function of redshift, the estimation of the survey selection function plays a critical role. Uncertainties in the comoving number density of galaxies at high make comparisons over large redshift intervals problematic. Apart from such ambiguities, simple empirical corrections for densities as a function of redshift are highly effective.
-
6.
For the DEEP2 Galaxy Redshift Survey, the projected -nearest-neighbor distance provides the most accuracte estimate of local galaxy density over a continuous and broad range of scales. The statistic is reasonably robust to redshift space distortions and still effective at tracing galaxy environments in under-dense regions.
-
7.
Among current data sets at high redshift, we find the DEEP2 Galaxy Redshift Survey provides the best opportunity for measuring accurate galaxy environments over a broad and continuous range of scales. The high sampling rate and excellent redshift-precision of DEEP2 enable environments to be measured in even the most over-dense regions and yield improved accuracy over other deep surveys. Furthermore, DEEP2’s high-precision redshifts and large survey area (3.5 square degrees) minimize the effects of edges in both the transverse and line-of-sight directions.
References
- Balogh et al. (2004) Balogh, M. et al. 2004, MNRAS, 348, 1355
- Balogh et al. (1999) Balogh, M. L., Morris, S. L., Yee, H. K. C., Carlberg, R. G., & Ellingson, E. 1999, ApJ, 527, 54
- Balogh et al. (1998) Balogh, M. L., Schade, D., Morris, S. L., Yee, H. K. C., Carlberg, R. G., & Ellingson, E. 1998, ApJ, 504, L75+
- Bell et al. (2004) Bell, E. F., Wolf, C., Meisenheimer, K., Rix, H., Borch, A., Dye, S., Kleinheinrich, M., Wisotzki, L., & McIntosh, D. H. 2004, ApJ, 608, 752
- Beuing et al. (2002) Beuing, J., Bender, R., Mendes de Oliveira, C., Thomas, D., & Maraston, C. 2002, A&A, 395, 431
- Blanton et al. (2003) Blanton, M. R., Eisenstein, D. J., Hogg, D. W., Schlegel, D. J., & Brinkmann, J. 2003, ApJ, submitted [astro–ph/0310453]
- Blanton et al. (2004) Blanton, M. R., Eisenstein, D. J., Hogg, D. W., & Zehavi, I. 2004, ApJ, submitted [astro–ph/0411037]
- Carlberg et al. (2001) Carlberg, R. G., Yee, H. K. C., Morris, S. L., Lin, H., Hall, P. B., Patton, D. R., Sawicki, M., & Shepherd, C. W. 2001, ApJ, 563, 736
- Christlein (2000) Christlein, D. 2000, ApJ, 545, 145
- Coil et al. (2004) Coil, A. L. et al. 2004, ApJ, 609, 525
- Coil et al. (2005) —. 2005, ApJ, in preparation
- Cole et al. (2000) Cole, S., Lacey, C. G., Baugh, C. M., & Frenk, C. S. 2000, MNRAS, 319, 168
- Colless et al. (2001) Colless, M. et al. 2001, MNRAS, 328, 1039
- Cooper et al. (2005) Cooper, M. C. et al. 2005, ApJ, in preparation
- Croton et al. (2005) Croton, D. J. et al. 2005, MNRAS, 356, 1155
- Davis & Geller (1976) Davis, M. & Geller, M. J. 1976, ApJ, 208, 13
- Davis et al. (1982) Davis, M., Huchra, J., Latham, D. W., & Tonry, J. 1982, ApJ, 253, 423
- Davis et al. (2003) Davis, M. et al. 2003, in Discoveries and Research Prospects from 6- to 10-Meter-Class Telescopes II. Edited by Guhathakurta, Puragra. Proceedings of the SPIE, Volume 4834, pp. 161-172 (2003)., 161–172
- Davis et al. (2004) Davis, M. et al. 2004, in ”Observing Dark Energy”, Sidney Wolff and Tod Lauer, editors, ASP Conference Series, [astro–ph/0408344]
- Dressler (1980) Dressler, A. 1980, ApJ, 236, 351
- Faber et al. (2003) Faber, S. M. et al. 2003, in Instrument Design and Performance for Optical/Infrared Ground-based Telescopes. Edited by Iye, Masanori; Moorwood, Alan F. M. Proceedings of the SPIE, Volume 4841, pp. 1657-1669 (2003)., 1657–1669
- Faber et al. (2005) Faber, S. M. et al. 2005, ApJ, in preparation
- Gómez et al. (2003) Gómez, P. L. et al. 2003, ApJ, 584, 210
- Gerke et al. (2005) Gerke, B. F. et al. 2005, ApJ, accepted
- Giavalisco et al. (2004) Giavalisco, M. et al. 2004, ApJ, 600, L93
- Hogg et al. (2004) Hogg, D. W., Blanton, M. R., Brinchmann, J., Eisenstein, D. J., Schlegel, D. J., Gunn, J. E., McKay, T. A., Rix, H., Bahcall, N. A., Brinkmann, J., & Meiksin, A. 2004, ApJ, 601, L29
- Hogg et al. (2003) Hogg, D. W. et al. 2003, ApJ, 585, L5
- Kauffmann et al. (1993) Kauffmann, G., White, S. D. M., & Guiderdoni, B. 1993, MNRAS, 264, 201
- Kauffmann et al. (2004) Kauffmann, G., White, S. D. M., Heckman, T. M., Ménard, B., Brinchmann, J., Charlot, S., Tremonti, C., & Brinkmann, J. 2004, MNRAS, 353, 713
- Kuntschner et al. (2002) Kuntschner, H., Smith, R. J., Colless, M., Davies, R. L., Kaldare, R., & Vazdekis, A. 2002, MNRAS, 337, 172
- Le Fevre et al. (2003) Le Fevre, O. et al. 2003, in Discoveries and Research Prospects from 6- to 10-Meter-Class Telescopes II. Edited by Guhathakurta, Puragra. Proceedings of the SPIE, Volume 4834, pp. 173-182 (2003)., 173–182
- Le Fevre et al. (2004) Le Fevre, O. et al. 2004, A&A, submitted [astro–ph/0409133]
- Lemson & Kauffmann (1999) Lemson, G. & Kauffmann, G. 1999, MNRAS, 302, 111
- Lewis et al. (2002) Lewis, I. et al. 2002, MNRAS, 334, 673
- Lilly et al. (1995) Lilly, S. J., Le Fevre, O., Crampton, D., Hammer, F., & Tresse, L. 1995, ApJ, 455, 50
- Madgwick et al. (2002) Madgwick, D. S. et al. 2002, MNRAS, 333, 133
- Madgwick et al. (2003) —. 2003, MNRAS, 344, 847
- Marinoni et al. (2002) Marinoni, C., Davis, M., Newman, J. A., & Coil, A. L. 2002, ApJ, 580, 122
- Mateus & Sodré (2004) Mateus, A. & Sodré, L. 2004, MNRAS, 349, 1251
- Newman et al. (2005) Newman, J. A. et al. 2005, ApJ, in preparation
- Padilla et al. (2004) Padilla, N. D. et al. 2004, MNRAS, 352, 211
- Peacock & Smith (2000) Peacock, J. A. & Smith, R. E. 2000, MNRAS, 318, 1144
- Postman & Geller (1984) Postman, M. & Geller, M. J. 1984, ApJ, 281, 95
- Ramella et al. (2001) Ramella, M., Boschin, W., Fadda, D., & Nonino, M. 2001, A&A, 368, 776
- Seljak (2000) Seljak, U. 2000, MNRAS, 318, 203
- Somerville & Primack (1999) Somerville, R. S. & Primack, J. R. 1999, MNRAS, 310, 1087
- Taylor et al. (2004) Taylor, A. N., Bacon, D. J., Gray, M. E., Wolf, C., Meisenheimer, K., Dye, S., Borch, A., Kleinheinrich, M., Kovacs, Z., & Wisotzki, L. 2004, MNRAS, 353, 1176
- van den Bergh (2002) van den Bergh, S. 2002, AJ, 124, 782
- Vanzella et al. (2004) Vanzella, E. et al. 2004, A&A, submitted [astro–ph/0406591]
- Willmer et al. (2005) Willmer, C. N. A. et al. 2005, ApJ, in preparation
- Wolf et al. (2003) Wolf, C., Meisenheimer, K., Rix, H.-W., Borch, A., Dye, S., & Kleinheinrich, M. 2003, A&A, 401, 73
- Yan et al. (2003) Yan, R., Madgwick, D. S., & White, M. 2003, ApJ, 598, 848
- Yan et al. (2004) Yan, R., White, M., & Coil, A. L. 2004, ApJ, 607, 739
- Yang et al. (2003) Yang, X., Mo, H. J., & van den Bosch, F. C. 2003, MNRAS, 339, 1057
- Yee et al. (2000) Yee, H. K. C. et al. 2000, ApJS, 129, 475
- York et al. (2000) York, D. G. et al. 2000, AJ, 120, 1579