Discovery of an M4 Spectroscopic Binary in Upper Scorpius: A Calibration Point for Young Low-Mass Evolutionary Models
Abstract
We report the discovery of a new low-mass spectroscopic (SB2) stellar binary system in the star-forming region of Upper Scorpius. This object, UScoCTIO 5, was discovered by Ardila et al., (2000), who assigned it a spectral class of M4. A Keck I HIRES spectrum revealed it to be double-lined, and we then carried out a program at several observatories to determine its orbit. The orbital period is 34 days, and the eccentricity is nearly 0.3. The importance of such a discovery is that it can be used to help calibrate evolutionary models at low masses and young ages. This is one of the outstanding problems in the study of formation mechanisms and initial mass functions at low masses. The orbit allows us to place a lower limit of M⊙ on the total system mass. The components appear to be of almost equal mass. We are able to show that this mass is significantly higher than predicted by evolutionary models for an object of this luminosity and age, in agreement with other recent results. More precise determination of the temperature and surface gravity of the components would be helpful in further solidifying this conclusion.
1 Introduction
The study of very low mass stars and brown dwarfs has experienced rapid growth during the past 15 years, primarily due to the advent of the next generation of large telescopes. Many questions are beginning to be answered about the atmospheric and evolutionary state of these objects, yet many fundamental questions remain. Thus far we have not gathered much empirical data on mass, one of the most fundamental quantities of interest. The evolutionary models that are currently used to assign almost all masses, based on age and luminosity, are largely untested. Modelers warn that such models cannot be trusted too far (Baraffe et al.,, 2003) for very low masses and very young ages. The search for binary systems that would provide fundamental stellar parameters is only now beginning to bear fruit. Indeed, the frequency of occurrence and physical configurations of very low mass binaries are themselves not well understood. These systems appear to have a somewhat, but not drastically, lower binary frequency than solar-type stars, and the scale of the systems seems to be smaller, along with more equal mass ratios (Bouy et al.,, 2003).
Recently there have been indications that the evolutionary models substantially under-predict masses for young objects in the 0.03-0.5 M⊙ range. Hillenbrand & White, (2004) compiled a collection of 115 low-mass stars with masses determined from orbital dynamics. Comparing them to masses derived from different evolutionary models, they found the masses of low-mass pre-main sequence stars to be generally under-predicted. The mass at which model predictions are close to dynamically derived masses depends on the model, but agreement tends to be better above 0.5 M⊙. The lowest tested pre-main sequence mass, however, was 0.3 M⊙. At main-sequence ages, Hillenbrand & White, (2004) found masses to be under-predicted in the 0.1-0.6 M⊙ regime in most of the models they used.
The first study focusing on less massive objects at very young ages was done by Mohanty et al., 2004a ; Mohanty et al., 2004b , who derived masses for 11 low mass objects in the young Upper Scorpius association. These mass estimates are independent of evolutionary models, relying instead on comparison of high resolution spectra with synthetic model spectra to obtain effective temperatures and surface gravities, then combining these with measured luminosities and the known distance and age of the star-forming region. They conclude that models under-predict the mass of young low-mass objects with a given temperature and luminosity, similar to the results of Hillenbrand & White, (2004) at higher masses and ages. More recently, a study using the more familiar orbital dynamical technique also suggested that the models under-predict mass for the object AB Dor C (Close et al.,, 2005). In that case, the determined mass of 0.09 M⊙ is almost twice that which models predict for an object of that luminosity, temperature, and age. Neither the age nor temperature are determined very precisely by this study, however (see also Luhman & Stauffer, (2005)). Close et al., (2005) overextend their result to claim that low mass brown dwarfs are being mistaken for “free-floating planets” due to the mass calibration problem. Actually, Mohanty et al., 2004b find that models over-predict masses below about 0.03 M⊙ (a regime not otherwise tested); the slope of their empirical mass-luminosity relation is shallower than predicted by models throughout the brown dwarf range.
Astronomers are much more used to calibrating masses by dynamical studies of binary systems than by surface gravity analysis. Indeed, the dynamical method looks much more straightforward at first glance, although when used to calibrate models it suffers from the same need to accurately measure a star’s luminosity and temperature as does the surface gravity method. In this paper, we report the discovery of a double-lined spectroscopic binary among the same population of low-mass members of Upper Sco studied by Mohanty et al., 2004a ; Mohanty et al., 2004b . This system is substantially younger than AB Dor C (studied by Close et al.,, 2005). We are able to determine an orbit for this system, UScoCTIO 5, which allows us to place a lower limit on its mass. We show that its mass appears to be underpredicted by the models, based on its measured luminosity and known age of the Upper Scorpius association. We find the same result using temperature, obtained in the usual way (via spectral type), which is not as precise as we would desire.
Our current result tends to confirm the results suggested by the surface gravity analysis of Mohanty et al., 2004b , which are in the same sense as found by Hillenbrand & White, (2004) and Close et al., (2005). This strengthens the case that evolutionary models for young very low-mass objects under-predict their masses at the bottom of the main sequence and in the heavier half of brown dwarfs. This has further implications for the initial mass functions derived in young clusters and star-forming regions, and provides a direction for modelers to improve their initial conditions. That they might need to do so comes as no surprise; they have been saying so themselves (e.g. Baraffe et al.,, 2003).
2 Observations
UScoCTIO 5 was the warmest object we observed in an extension of our original program to study very young brown dwarfs (Jayawardhana et al.,, 2002, 2003). We made the first observation of it on 11 June 2003 with HIRES at Keck I. It was immediately clear from the raw spectrum on that night that the lines were doubled. We then undertook a program to determine the orbital parameters. The region around the KI lines in the first spectrum is plotted in Fig. 1. Both binary components are clearly visible with comparable line intensities. After this exposure, twenty further spectra were taken in 2004, and one in 2005. We (and other helpful observers) carried out high-resolution spectroscopy using the HIRES spectrograph at Keck I, the echelle spectrograph at the CTIO 4m telescope, and the MIKE-Red echelle on Magellan II at Las Campanas Observatory. The instruments used, dates and times of observations, exposure times and names of observers are compiled in Table 1. For every instrumental setup, one or more spectra of the slowly rotating M6-star Gl 406 (CN Leo) were also taken to allow production of cross-correlation profiles. The resolution in all our spectra is at least .
It is essential to the utility of our analysis that UScoCTIO 5 be a member of the Upper Scorpius Association. It is this membership which gives us the distance and age of the object. There are a number of observations which strongly point to its membership. It was discovered because it sits on the pre-main sequence for that association based on its photometry (and of course is spatially within the association). If it is that young, it should display strong lithium lines, and indeed both components are easily visible in lithium. At 0.3 M⊙, the lifetime of lithium is only around 30 Myr. This rules out UScoCTIO 5 being a foreground main sequence star. There is further evidence against that in the narrow Na line profiles (main sequence stars have higher gravity and broader lines). The system velocity is consistent with our other targets in Upper Sco; the central velocity matches that of most other Upper Sco targets to within 3 km s-1. Finally, the H lines in these objects are quite similar to those in several of the other non-accretors in Upper Scorpius shown in Mohanty et al., 2004b , though that by itself would not be definitive.

| Instrument | Date | UT | exp. time [s] | [km/s] | Obs. |
|---|---|---|---|---|---|
| HIRES/Keck | 2003-06-11 | 10:15:08 | 900 | 70.2 | 11Basri |
| HIRES/Keck | 2004-05-09 | 10:49:00 | 900 | 12.3 | 22Sargent, Takada-Hidai |
| HIRES/Keck | 2004-05-10 | 11:45:14 | 1200 | 27.0 | 22Sargent, Takada-Hidai |
| HIRES/Keck | 2004-05-11 | 09:18:10 | 1200 | 38.6 | 11Basri |
| HIRES/Keck | 2004-05-11 | 11:48:19 | 900 | 41.4 | 11Basri |
| HIRES/Keck | 2004-05-11 | 15:02:32 | 400 | 42.7 | 11Basri |
| echelle/CTIO 4m | 2004-05-29 | 03:19:32 | 1800 | -37.7 | 33Mohanty, Tanner |
| echelle/CTIO 4m | 2004-05-29 | 03:57:40 | 1800 | -38.3 | 33Mohanty, Tanner |
| echelle/CTIO 4m | 2004-05-29 | 04:32:15 | 1800 | -38.8 | 33Mohanty, Tanner |
| echelle/CTIO 4m | 2004-05-30 | 04:04:57 | 1800 | -39.9 | 33Mohanty, Tanner |
| echelle/CTIO 4m | 2004-05-31 | 03:38:52 | 1800 | -42.9 | 33Mohanty, Tanner |
| echelle/CTIO 4m | 2004-05-31 | 04:10:55 | 1800 | -42.6 | 33Mohanty, Tanner |
| echelle/CTIO 4m | 2004-05-31 | 04:43:16 | 1800 | -42.3 | 33Mohanty, Tanner |
| echelle/CTIO 4m | 2004-05-31 | 08:06:56 | 1800 | -42.0 | 33Mohanty, Tanner |
| echelle/CTIO 4m | 2004-06-01 | 06:34:18 | 1800 | -42.8 | 33Mohanty, Tanner |
| echelle/CTIO 4m | 2004-06-03 | 01:23:55 | 1800 | -42.1 | 33Mohanty, Tanner |
| echelle/CTIO 4m | 2004-06-03 | 05:57:54 | 1800 | -41.1 | 33Mohanty, Tanner |
| echelle/CTIO 4m | 2004-06-03 | 06:30:39 | 1800 | -41.5 | 33Mohanty, Tanner |
| echelle/CTIO 4m | 2004-06-03 | 08:02:13 | 1800 | -41.4 | 33Mohanty, Tanner |
| MIKE-Red/Magellan | 2004-06-13 | 03:59:21 | 1800 | 22.2 | 44Paulson |
| MIKE-Red/Magellan | 2004-06-14 | 02:51:57 | 1800 | 35.0 | 44Paulson |
| HIRES/Keck | 2005-03-02 | 13:20:24 | 900 | -42.3 | 55Basri, Reiners |
3 Differential Radial Velocities
We infer the orbital elements of UScoCTIO 5 from the radial velocities of the binary components relative to each other (differential radial velocities). Cross-correlation functions are computed using spectra of Gl 406 as a template. For each spectrum, we obtained a template spectrum using identical instrument setups for UScoCTIO 5 and Gl 406. In case of HIRES spectra, we used one order covering approximately 100 Å between 7850 Å and 7950 Å. From the CTIO data we merged four echelle orders and calculated the correlation functions in about 600 Å between 8350 Å and 8950 Å. The region between 8600 Å and 8800 Å was used in the Magellan data. None of these wavelength regions is contaminated by significant telluric lines.
Using wavelength regions as large as 600 Å, the wavelength dependency of Doppler shifts becomes important for the calculation of precise radial velocities. At differential radial velocities of 50 km s-1, for example, the velocity difference per pixel is of the order of 3 km s-1 from one end of the linear wavelength scale used in the CTIO data to the other end. For highest accuracy, we therefore calculate the correlation function using logarithmic wavelengths. Differential radial velocities are then derived from the separation of the two peaks belonging to the different components. Both components were easily distinguishable in all correlation functions. Differential radial velocities for all observations are given in column five of Table 1. An estimation of our measurement errors will be given in the next section.
It turns out that all observations taken after our first one in 2003 reveal significantly lower differential radial velocities, i.e., the components are more seriously blended than in the example given in Fig. 1. While both components are always distinguishable, an assignment of each of the two correlation peaks to individual stellar components is ambiguous, even in the cross-correlation functions derived from large spectral regions. We therefore did not individually identify the components in every spectrum, i.e., the sign of is not derived from the data. However, as shown in the next section, we were able to eliminate the ambiguity in the sign of when determining the orbit of UScoCTIO 5.
4 Determining the Orbit
As mentioned above, we do not have information about the sign of . Our data were taken during five observing campaigns, indicated by horizontal lines in Table 1. Radial velocities from spectra obtained during the same campaigns show clear correlations, and it is very unlikely that the sign of changes within one campaign. However, we looked at the periodograms of all possible permutations of the signs of and found no hints of a short orbit with the sign of alternating within consecutive observations of any campaign. The radial velocity curve of a spectroscopic binary can be uniquely specified by the following five parameters: Period, ; total projected mass ; eccentricity of the orbit, ; longitude of periastron, ; and Epoch, . From differential radial velocities it is not possible to obtain the inclination . Thus we only derive a minimum mass sum from our data. The mass fraction could be determined in principle from either the individual component line ratios or the amplitude of their excursions about the system velocity. In our case, we could not confidently find any difference between the two components. This places a minimum mass limit on the primary (it cannot contain much more than half of the total mass).
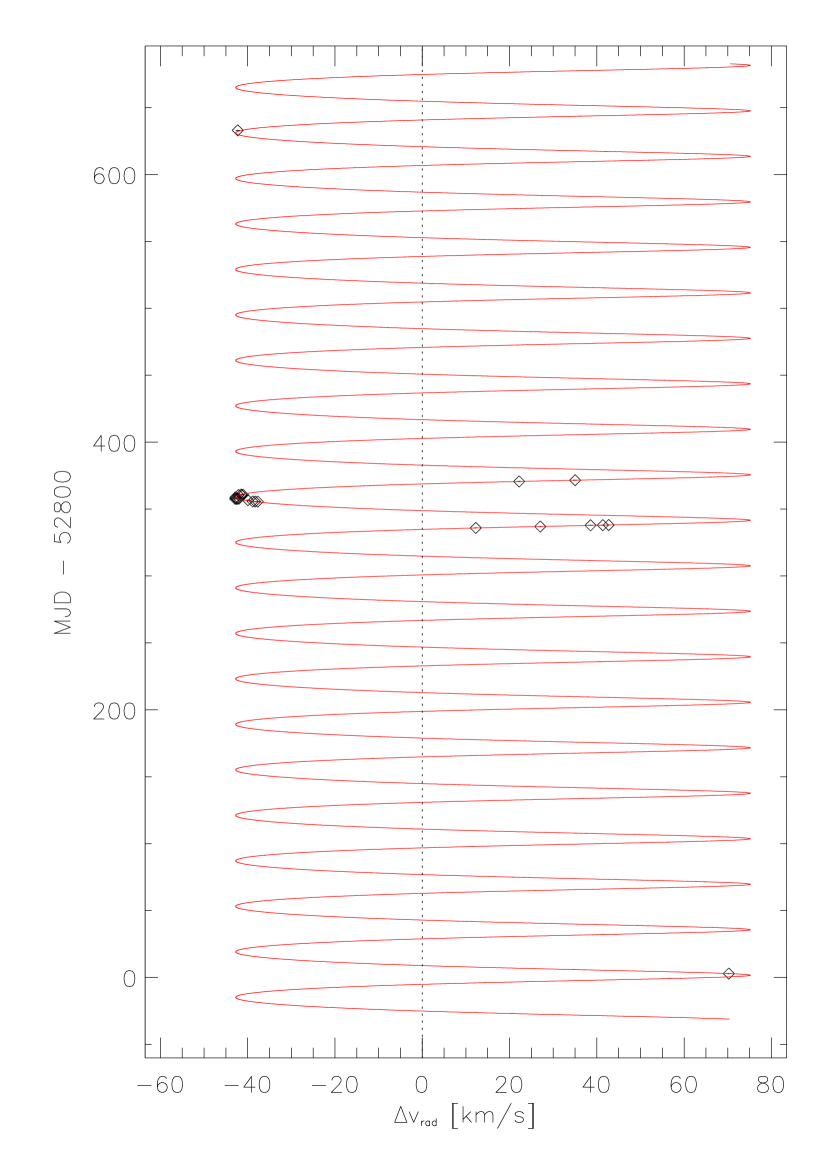
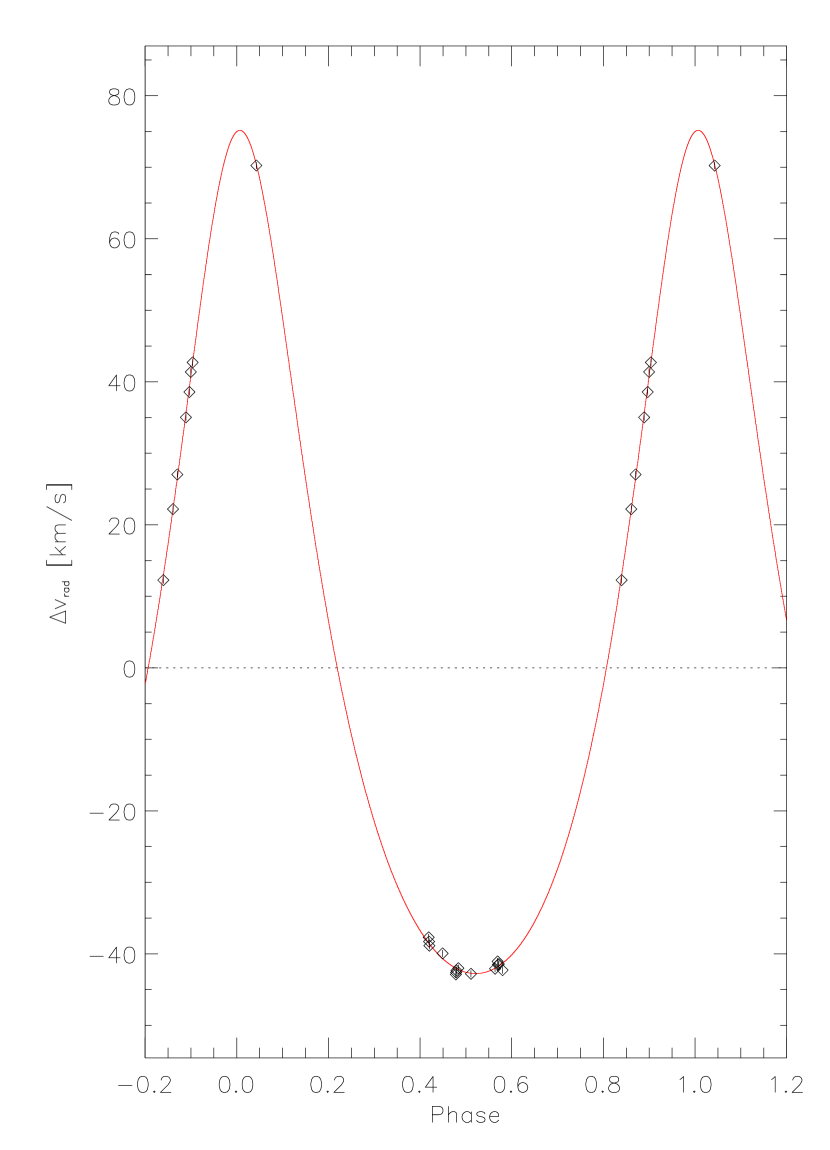
We searched for the best orbital solution in the five free parameters by minimizing the rms scatter of , , with the number of measurements. The rms scatter of around the best fit is m s-1. The uncertainties in are not well determined due to the variety of instruments used, and they are primarily systematic rather than of statistical origin. Thus we cannot give a strict statistical confidence limit on our result. We conservatively estimate the uncertainty in the orbital parameters by searching for the intervals for which , when varying each parameter independently. The parameters of our best fit are given in Table 2 with the derived errors. Our best solution is plotted over the whole range of observations and over phase in the left and right panels of Fig. 2, respectively.
We find a minimum projected total mass of M⊙. The solution is unique in the sense that for the second best local minimum in we get a significantly higher value of . This solution would provide M⊙, and all other parameters are comparable to our best solution as well. We ran an extensive survey in parameters considering different signs in individual values and groups of . No other parameter set yielding comparable fit quality could be found.
| Parameter | Value | ||
|---|---|---|---|
| Period, [d] | |||
| [M⊙] | |||
| Eccentricity, | |||
| Semimajor axis, a [AU] | |||
| Longitude of periastron, [] | |||
| Epoch (MJD), [d] | 52 799.974 | 0.002 | |
5 Comparison to Evolutionary Tracks
In order to compare the derived minimum mass to theoretical evolutionary tracks, we calculate bolometric luminosity and effective temperature from photometry and spectral type, respectively. A spectral type of M4 has been determined for UScoCTIO 5 by Ardila et al., (2000). Photometry, effective temperatures and bolometric luminosity are given in Table 3. We calculate bolometric luminosity from and colors taken from 2MASS (Cutri et al.,, 2003), and determine independently from both colors. From the -color we determine according to dwarf calibrations given in Kenyon & Hartmann, (1995), is also taken from that paper. A calibration of in the UKIRT photometric system can be found in Leggett et al., (2001); the transformation of 2MASS colors to the UKIRT system is adopted from Carpenter, (2001).
We calculate the extinction by comparing and to the young-disk calibration given in Legget, (1992) using the extinction law from Schlegel et al., (1998); colors are converted to the -system for that purpose (Carpenter,, 2001). This yields and , while a value of is reported in Ardila et al., (2000). Including the uncertainty in spectral type, our estimates of have uncertainties of 0.3 mag, hence the values of are consistent within the uncertainties. We choose for the calculation of bolometric luminosity, and we derive a bolometric luminosity of from the band and from the band. The two values derived from different colors agree very well, and in the following we will use the luminosity derived from the -band since it has smaller uncertainties. For the uncertainties, we took into account a spectral class uncertainty of half a subclass (), age ( Myr) and distance ( pc) for the cluster adopted from Mohanty et al., 2004b . These errors have been included in the luminosity error. For the bolometric correction an uncertainty of 0.1 mag has been assumed, and 0.05 mag has been employed for (Leggett et al.,, 2001).
In Fig. 3, UScoCTIO 5 is plotted in a luminosity-age diagram with evolutionary tracks from Baraffe et al., (1998) and Chabrier et al., (2000). Assuming that both components of UScoCTIO 5 contribute equal light, the most probable mass of one component according to its position in the diagram is M⊙. Our dynamically determined total system projected minimum mass is M⊙. The color and spectral type of a spectroscopic binary is primarily determined by the hotter component, i.e., the minimum mass of the more massive component in the binary system is at least
| (1) |
The real mass is very likely to be higher because of the inclination effect. On the other hand, the inclination is probably fairly close to edge-on, because the lower limit on mass is already rather high for the spectral type (this luck allows us to find a meaningful lower limit). The hatched region in Fig. 3 is defined by the known age of the association and the lower limit to the dynamical mass from the orbit. The upper limit to the mass is set from the late spectral type. Even on the main sequence, an M2 dwarf has a mass of about M⊙ (Delfosse et al.,, 2000), the upper limit we adopt. Our object is both cooler and younger than an M2 dwarf, making our upper limit a safely conservative estimate.

Temperatures of young dwarfs have been investigated by Luhman, (1999) and Luhman et al., (2003). Investigating members of the young cluster IC 348 and the young quadruple system GG Tau, they provide a temperature scale calibrated by evolutionary models under the premises that coeval stars fall on the same isochrones. These temperatures are intermediate between older giant and dwarf temperature scales, leading to an estimate for the temperature(s) of UScoCTIO 5 of K. The error here is that cited by Luhman, and is his estimate of possible systematic errors in his scale (which was constructed to fill a specific purpose, relevant in our context). Mohanty et al., 2004a have discussed the temperatures of the cool components of GG Tau in detail (their Appendix B). They have the advantage of a spectroscopically determined temperature in addition to newer spectral types. They find that the temperatures of these young objects (comparable to UScoCTIO 5) are consistent with newly determined dwarf scales for main sequence M-dwarfs given in Leggett et al., (2000) or Mohanty & Basri, (2003). This leads to an estimate for the temperature of UScoCTIO 5 (M4) of K.
In Fig. 4, UScoCTIO 5 is plotted in an HR-diagram with evolutionary tracks from the same models. With the effective temperature derived from a scale that is designed to fit isochrones of these evolutionary models, it is not surprising that UScoCTIO 5 is located near the 5 Myr isochrone. If we adopt the temperature scale based on the work of Mohanty & Basri, (2003) and Mohanty et al., 2004a which is about 100K cooler, the effect is to lower the inferred mass to about M⊙ and the age to 4 Myr (still fully consistent with the age estimated for the association). An equally weak link in setting the temperature is the assumed spectral type. A change to M3.5 from M4, for example, would have a substantial effect on the implied temperature, and raise the inferred mass to better agreement with the models. We intend to determine the temperature of UScoCTIO 5 directly from the high resolution spectra in a follow-up paper. It is therefore the case that the mass discrepancy cannot be demonstrated as conclusively in the HR-diagram with the current uncertainties in temperature, and our conclusions rest primarily on the (similar) result in the luminosity-age diagram.

| Parameter | Value | ||
|---|---|---|---|
| R.A. (J2000.0) | |||
| Decl. (J2000.0) | |||
| Spectral TypeaaArdila et al., (2000) | M4 | ||
| Distance aaArdila et al., (2000) | pc | ||
| bbCutri et al., (2003) | |||
| bbCutri et al., (2003) | |||
| bbCutri et al., (2003) | |||
| aaArdila et al., (2000) | |||
| log | |||
| log | |||
| a,da,dfootnotemark: [K] | |||
| Age | 5 Myr | 2 Myr | |
Note. — was derived from a scale intermediate between dwarf and giant temperatures, using a dwarf scale yields K (Luhman,, 1999).
The hatched region in Fig. 4 displays the area consistent with our previously adopted mass and age limits. The position of UScoCTIO 5 inferred for its dynamically determined mass from evolutionary models is too hot to be consistent with its measured luminosity. With the error bars on temperature (assuming a spectral type of M4) adopted from Luhman, (1999), UScoCTIO 5’s position in the HRD is barely consistent with even the minimum mass at and equal mass components. The conclusion from Fig. 4 is that the mass of UScoCTIO 5 is probably significantly underestimated by the evolutionary model parameters that would fit the observational temperature and luminosity. The mass estimated by models in the luminosity-temperature diagram is consistent with that estimated from the luminosity-age diagram, because the temperature scale employed positions objects near the 5 Myr isochrone by construction. This probably means that the temperature is not too far off.
Besides a problem with the evolutionary models themselves, the underestimation of mass could only be due to (1) uncertainty in the dynamical mass, (2) underestimation of the temperature, and/or (3) mis-estimation of the spectral type by a half-subclass cooler or more. The dynamical mass does not have a large error, except that the unknown inclination can easily make the mass discrepancy worse. The estimation of luminosity is unlikely to have a large error, and this only plays a minor role since evolutionary tracks are largely independent of luminosity at a given mass; they are nearly vertical in the hatched region in Fig. 4. An error in the spectral type, or in the conversion of spectral type to temperature, could move the observed point leftward in Fig. 4. Note, however, that moving it to the value of 3450 K which is suggested by the dynamical mass, would also make the age uncomfortably large (as the luminosity would be too low). We leave the detailed analysis of these issues to another paper, wherein we will obtain an independent spectroscopic determination of the temperature. Our current result from the luminosity-age analysis is not affected by errors in spectral type or its conversion to temperature in any case.
6 Conclusions
We have derived the orbit of the M4 binary system UScoCTIO 5, a member of the Up Sco OB association with an age of Myr. From our radial velocity measurements we infer a projected minimum total mass of the system of M⊙, i.e. a minimum mass of the primary of M⊙. The luminosity and effective temperature of UScoCTIO 5 have been derived from photometry and spectral type. As our main result, we compare the position of UScoCTIO 5 to theoretical evolutionary tracks of Baraffe et al., (1998) and Chabrier et al., (2000) in a luminosity-age diagram. These evolutionary tracks predict a mass of M⊙ at the luminosity and age observed for UScoCTIO 5. Taking into account our ignorance of the inclination of the orbit, and the mass ratio (both of which can only lead to higher dynamical mass), we conclude that there is a significant discrepancy between the “true” mass and the mass derived from current commonly-used evolutionary models in this part of parameter space.
This conclusion is the same in our analysis using the HR-diagram, although there it is subject to further uncertainties in the true spectral type, and the conversion from spectral type to temperature at this age. Uncertainties in the derivation of lead to lower masses and an even larger discrepancy with the evolutionary models if the temperature is cooler than we estimate here; there is some suggestion for that from Mohanty et al., 2004a . One could obtain higher mass (and better agreement with the models) if the spectral type were earlier than the current value by half a subclass or more (using the current temperature scale). The same issues are present in the analysis by Close et al., (2005), who also found that models underestimated the mass for an object that is lower in mass but substantially older than this one. These uncertainties, however, do not affect the conclusions of the first paragraph.
These problems with temperatures are not applicable to the similar conclusions about model discrepancies reached earlier in the analysis of a number of objects in Upper Sco having even lower masses by Mohanty et al., 2004b , because they determined the temperatures of those objects more directly (from high resolution spectra). However, their masses are found by a surface gravity analysis rather than dynamically. The effect of the current analysis, therefore, is to support the methodologies of the earlier paper with an independent check. It seems fair to say at this point that the evidence is accumulating from several directions that commonly-used evolutionary models require adjustments to higher mass at a given luminosity and/or temperature for stars or brown dwarfs in the 0.03-0.3 solar mass range which are younger than a hundred million years or so. This has implications for all the conclusions drawn about the initial mass function in star-forming regions at low masses, and for other papers which rely on evolutionary mass estimates to draw conclusions about what sort of low-mass objects are being studied.
References
- Ardila et al., (2000) Ardila, D., Martín, E., Basri, G., 2000, AJ, 120, 479
- Baraffe et al., (1998) Baraffe, I., Chabrier, G., Allard, F., & Hauschildt, P.H., 1998, A&A, 337, 403
- Baraffe et al., (2003) Baraffe, I., Chabrier, G., Allard, F., & Hauschildt, P.H., 2003, IAU Symp. 211, 41
- Bessel, (1991) Bessel, M.S., 1991, AJ, 101, 662
- Bouy et al., (2003) Bouy, H., Brandner, W., Mart n, E., Delfosse, X., Allard, F., Basri, G. 2003, AJ, 126, 1526
- Carpenter, (2001) Carpenter, J.M., 2001, ApJ, 121, 2851
- Chabrier et al., (2000) Chabrier, G., Baraffe, I., Allard, F., & Hauschildt, P.H., 2000, ApJ, 542, 464
- Close et al., (2005) Close, L.M., Lenzen, R., Guirado, J.C., Nielsen, E.L., Mamajek, E.E., Brandner, W., Hartung, M., Lidman, C., & Miller, B., 2005, Nature, 433, 286
- Cutri et al., (2003) Cutri et al., 2003, 2 Micron All-Sky-Survey
- Delfosse et al., (2000) Delfosse X., Forveille, T., Ségransan, D., Beuzit, J.-L., Udry, S., Perrier, C., Mayor, M., 2000, å, 364, 217
- Hillenbrand & White, (2004) Hillenbrand, L.A., & White, R.J., 2004, ApJ, 604, 741
- Jayawardhana et al., (2002) Jayawardhana, R., Mohanty, S., & Basri, G., 2002, ApJ, 578, L141
- Jayawardhana et al., (2003) Jayawardhana, R., Mohanty, S., & Basri, G., 2003, ApJ, 592, 282
- Kenyon & Hartmann, (1995) Kenyon, S.J., & Hartmann, L., 1995, ApJS, 101, 117
- Legget, (1992) Leggett, S.K., 1992, ApJS, 82, 351
- Leggett et al., (2000) Leggett, S.K., Allard, F., Dahn., C.C., Hauschildt, P.H., Kerr, T.H., & Rayner, J. 2000, ApJ, 535, 965
- Leggett et al., (2001) Leggett, S.K., Allard, F., Geballe, T.R., Hauschildt, P.H., & Schweitzer, A. 2001, ApJ, 548, 908
- Luhman, (1999) Luhman, K.L., 1999, ApJ, 525, 466
- Luhman et al., (2003) Luhman, K.L., Stauffer, J.R., Muench, A.A., Rieke, G.H., Lada, E.A., Bouvier, J., Lada, C.J., 2003, ApJ, 593, 1093
- Luhman & Stauffer, (2005) Luhman, K.L. & Stauffer, J. 2005, submitted
- Mohanty & Basri, (2003) Mohanty, S., & Basri, G., 2003, ApJ, 583, 451
- (22) Mohanty, S., Basri, G., Jayawardhana, R., Allard, F., Hauschildt, P., & Ardila, D., 2004a, ApJ, 609, 854
- (23) Mohanty, S., Jayawardhana, & R., Basri, G., 2004b, ApJ, 609, 885
- Schlegel et al., (1998) Schlegel, D.J., Finkbeiner, D.P., & Davis, M., 1998, ApJ, 500, 525