Far Ultraviolet Spectroscopy of (Non-magnetic) Cataclysmic Variables
Abstract
HST and FUSE have provided high signal-to-noise, high-resolution spectra of a variety of cataclysmic variables and have allowed a detailed characterization of FUV emission sources in both high and low states. Here, I describe how this has advanced our understanding of non-magnetic CVs and the substantial interpretive challenges still posed by the observations. In the high state, the FUV spectra are dominated by disk emission that is modified by scattering in high and low velocity material located above the disk photosphere. Progress is being made toward reproducing the high-state spectra using kinematic prescriptions of the velocity field and new ionization and radiative transfer codes. In conjunction with hydrodynamical simulations of the outflows, accurate estimates of the mass loss rates and determination of the launching mechanism are likely forthcoming. In quiescence, the FUV spectra reveal contributions from the WD and the disk. Quantitative analyses have lead to solid measurements of the temperatures and abundances of a number of WDs in CVs, and of a determination of the response of the WD to an outburst. Basic challenges exist in terms of understanding the other components of the emission in quiescence, however, and these are needed to better understand the structure of the disk and the physical mechanisms resulting in ongoing accretion in quiescence.
keywords:
accretion disks , cataclysmic variables , dwarf novae , white dwarf1 Introduction
In disk-dominated cataclysmic variables (CVs), mass accretion onto a white dwarf (WD) from a relatively normal secondary star is mediated by a disk that extends close to the surface of the WD. All CVs vary, but the character of the variability probably reflects the time-averaged accretion rate from the secondary (see, e. g. Stehle et al., 2001). Systems with low accretion rate show semi-periodic outburst of 3-5 magnitudes (in ) and are known as dwarf novae (DNe). These outbursts are due to a thermal instability that converts the disk from a low temperature, mostly unionized, optically thin (in the continuum) state to a high temperature, ionized, optically thick state. During the outburst, the mass transfer rate in the inner disk rises from to , and, in terms of the simplest picture of the system, the dominant source of FUV emission changes from being the WD to the disk. By contrast, systems with high mass-transfer rates remain in the high state most of the time, and are known as nova-like variables. Finally there are “Z Cam” objects, which undergo normal DN outbursts as well as outbursts that stall during the transition to quiescence for weeks to months at an intermediate magnitude (typically 0.5-1 magnitudes below peak). These are thought to be systems with intermediate rates of mass transfer from the secondary star.
In this review, I would like to highlight recent progress toward understanding these systems as a result of observations with FUSE, HST, and the Hopkins Ultraviolet Telescope (HUT).
2 Modelling the Disks and Winds of High State CVs
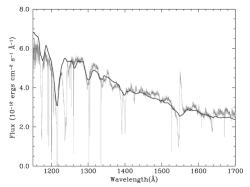
As first shown using IUE, the FUV spectra of disk-dominated CVs in outburst show “blue” continua that can be reasonably approximated in terms of a weighted set of stellar atmospheres, where the weighting is determined by the temperature and gravity of a steady state accretion disk and where each spectrum is broadened to mimic that of a rotating disk annulus. A modern example using data from FUSE and HST is shown in Fig. 1. When, as in this case, the distance and inclination are known, the fit depends almost entirely on the observed flux. In these cases, the fact that the model qualitatively reproduces many of the features in the spectrum suggests that the derived is close to the correct value. On the other hand, models based on stellar atmospheres have generally been shown to fail to reproduce the spectrum over large wavelength ranges, particular if the range spans the Balmer limit. Stellar atmospheres have a pronounced Balmer jump in contrast to what is observed in high state disk systems. This is surely due to differences between disk and stellar atmospheres. Ad hoc solutions, such as including a transition region above the surface of the disk, are capable of addressing the problem but do not discriminate between likely mechanisms, which include viscous energy dissipation in or illumination of the disk atmosphere. To date there have been very few published attempts to create more physically correct model disk spectra and perform detailed comparisons to high quality spectra. However, this is likely to happen soon. The machinery does exist (Kriz & Hubeny, 1986) and model grids are beginning to be created (see, e. g. Wade & Hubeny, 1998).
The disk model fits will not provide a complete solution, however, because FUV spectra of high state spectra show clear evidence of winds. P Cygni like profiles in N V, Si IV and (most commonly) C IV are observed in some systems, and the centroids of these lines are blue-shifted in others. Blue edge velocities of 2000-5000 are observed. Recently, a number of systems have been observed in the 900-1185 Å range with FUSE. These show surprising diversity. In particular, although some systems do show high-velocity wind emission from S VI and O VI, it is common to see relatively narrow lines with small (100 ) blue-shifts from intermediate ionization states (Froning et al., 2001, 2004). The velocity widths of these lines are too narrow for either the disk or the high-velocity outflow represented by C IV in the HST range.
Shortly after winds were first discovered in CVs, observations of eclipsing systems showed changes in profiles shapes that indicate substantial rotation, suggesting a disk origin for the outflow (Córdova & Mason, 1982; Drew & Verbunt, 1988). Consequently, our basic picture of the high-velocity winds is of a bi-conical flow emanating from the inner disk. Vitello & Shlosman (1993) were the first to attempt to model the profile shapes of wind lines as observed in high state CVs in terms of a kinematic prescription for a bi-conical wind. They found that the IUE-derived (R=200) C IV profiles of three systems – RW Sex, RW Tri, and V Sge – could be reproduced with moderately collimated winds with mass-loss rates () of order 10% of the disk accretion rate () and terminal velocities of 1-3 times the escape velocity at the footpoint of each streamline. Subsequently, Knigge & Drew (1997) succeeded, using a different parametrization for a bi-conical flow, in reproducing the C IV profile of UX UMa though an eclipse as observed at R=2000 with HST/GHRS. This analysis was the first attempt to model changes in the profile through eclipse, and suggested, at least in UX UMa, the existence of a relatively dense, high-column-density, slowly outflowing transition region between the disk photosphere and the fast moving wind.
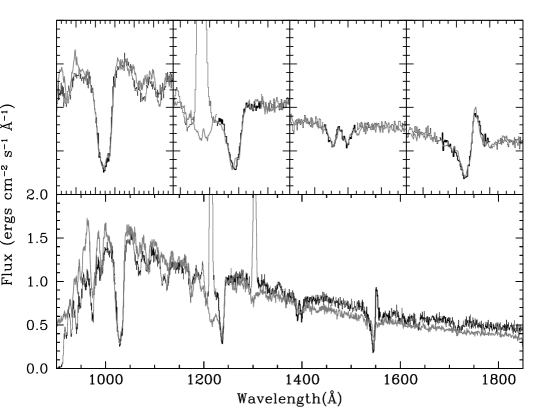
Recently, my collaborators and I have developed a new Monte Carlo radiative transfer code that invokes a Sobolev approximation with escape probabilities to follow photons through an axially symmetric wind. “Python” is designed to produce a complete spectrum of disk dominated CVs (Long & Knigge, 2002). Emission sources include the disk, the WD, a boundary layer and the wind itself. The flow geometry is defined either in terms of the parametrization of Shlosman & Vitello (1993) or Knigge et al. (1995). The code consists of two separate Monte Carlo radiative transfer calculations. In the first, the ionization structure of the wind is calculated using a modified on-the-spot approximation. In the second, a detailed spectrum is calculate for a specific wavelength range of interest. A fair summary of progress to date is as follows: MC methods, such as Python, can be used to obtain spectral verisimilitude to individual lines fairly easily. An example of this is shown in Fig. 2. Systematic searches are now needed to determine whether one can actually model all the lines with a single wind geometry, and to determine how well one can do on average. Several of us are beginning this effort.
If this effort is successful, we will be able to determine the basic parameters, such as the mass-loss rate, degree of collimation, and ionization state, of the winds of high state CVs. Until this is done, it is difficult to address many of the physical questions that need to be answered, including whether the wind is radiatively-driven, as is usually assumed. The observational and theoretical evidence for this is murky. If the wind is radiatively driven, one would expect that the wind lines would be strongest when systems are brightest. But Hartley et al. (2002) found no correlation between the strength of wind features and continuum brightness in HST/STIS observations of two nova-like variables, IX Vel and V3885 Sgr. And Feldmeier & Shlosman (1999) and Drew & Proga (2000) have argued that the luminosities of CV disks are at best marginally sufficient to accelerate a high-velocity wind. Hydrodynamical simulations of radiatively-driven CV winds have recently been carried out, but comparisons of the theoretical predictions to observations have produced mixed results (see e.g. Proga, 2003). Thus, alternative wind-driving mechanisms must be (re)considered instead of, or in addition to, radiation pressure. These include viscous heating of the upper disk atmosphere (Czerny & King, 1989a), and irradiation of the disk (Czerny & King, 1989b) as well as magneto-centrifugal forces leading to constant angular velocity rotation out to the Alfvèn surface (Cannizzo & Pudritz, 1988). Knowledge of the kinematic structure of the wind would be a strong discriminant between them.
3 FUV emission of non-magnetic CVs in quiescence
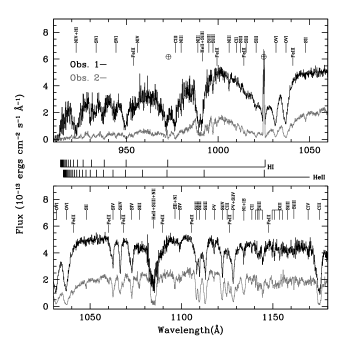
The appearance of quiescent systems is quite different from those in outburst, and fairly varied. At one extreme are systems, such as U Gem, with FUSE spectra (Fig. 3) characterized by broad Lyman absorption lines and narrower metal absorption features. These systems can be modelled, sometimes in great detail, with synthetic spectra of metal enriched WD-photospheres. The metal enrichment is understood to be a result of on-going accretion. At the other extreme are systems dominated by broad, fairly symmetric emission features. FUSE spectra of SS Cyg, also shown in Fig. 3, provide a good examples of this type a system. The dominant continuum emission in these systems is not well-understood, although the lines almost surely arise from the disk (see, e. g. Long et al., 2005). Since in quiescence the bulk of the disk is cold and unionized, explanations typically involve surface layers of the disk or a chromosphere, heated via X-ray illumination or magnetic flares in the disk. The emission region is unlikely to be optically thick in the continuum since that would limit the physical size of the emitting region to that of the WD. Most systems, e.g. VW Hyi (Godon et al., 2004b), lie between the two extremes, with contributions from the WD and from the “second component”.
The basic questions one would like to answer about quiescent systems depends on the nature of the emission. For the WD systems, one would first of all like to establish the fundamental parameters – temperature, radius, abundances, rotation rate, gravitational redshift – of the WD. In addition, one would like to explore the effects of accretion onto the WD. For the other systems, one would like to understand the real nature of the “second component” and what it implies about the structure of the disk (and the nature of the WD).
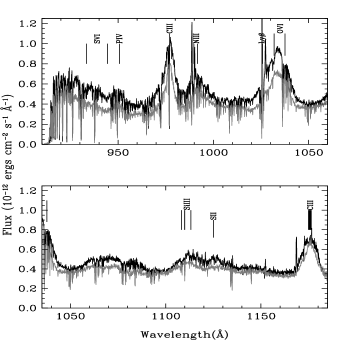
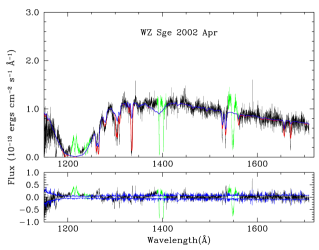
As an example, I would like to describe the analysis of multiple FUV spectra that were obtained of WZ Sge following its outburst in July 2001 (Sion et al., 2003; Long et al., 2004). WZ Sge, at 42 pc, is the closest known CV, and possibly the closest accretion disk system. Among CVs, WZ Sge has one of the shortest binary periods (88 m), and one of the longest interoutburst periods (20-30 yrs). FUSE and HST observations during the outburst showed a high excitation spectrum dominated by broad O VI, NV, and C IV features, consistent with the high (75o) system inclination (Long et al., 2003; Knigge et al., 2002). Following the outburst, the spectrum acquired the characteristics of a WD-dominated system (Fig. 4). From 2001 September to 2003 March, the spectra show a steady decline in the flux, a steady decrease in the color temperature,and a gradual increase in the width of Lyman , all of which are consistent with a long term cooling of a WD. A detailed analysis shows that declined from 24,300 in 2002 October to 15,900 K in March 2003. The flux level in 2003 was still well above that of the pre-outburst system, indicating that the WD was still cooling. Assuming a normal WD mass-radius relationship and a distance of 42 pc, it was possible to show that all of the post-outburst spectra are consistent with a WD mass of 0.9, as had been inferred previously by more indirect means. This result is interesting in part, because in some other systems (e.g U Gem), simple 1-T models do not produce constant radius with time, which has lead to suggestions of non-uniform surface temperatures of the WD or a declining “second component”.

One of the puzzles in the case of WZ Sge is why the post-outburst energy release has been so large; the post-outburst excess energy release is roughly 15% of the outburst energy. There are two basic possibilities. First, there could be on-going accretion. This is consistent with the fact that we continue to see metal lines in WZ Sge. The time scale for metals to settle in a WD are of order a few days. Therefore, if the metal lines in WZ Sge arise from the photosphere, then there must be ongoing accretion. Secondly, the WZ Sge outburst both heated and left the WD with extra mass on its surface, leaving the WD out of equilibrium. The interior of the star has to respond to these facts, through a process known as compression heating. Godon et al. (2004a) argued that the cooling that is observed in WZ Sge could be modelled either as a 1.2 WD which accreted at during the outburst with no accretion afterward, or with a 1 WD accreting at during the outburst and following the outburst. The latter possibility is most consistent with other known facts about WZ Sge.
4 Conclusions
The spectra obtained with FUSE, HST, and HUT represent qualitative improvements over those that could be obtained with IUE. For the high state spectra, the surprise in the FUSE spectra is the plethora of lower ionization state narrower lines, especially in higher inclination systems. These lines most likely arise from a transition region between the disk and the high velocity wind, another indication that this zone cannot be ignored. With IUE it was clear that WDs emission dominated the emission from some low state spectra. With HST and FUSE, it is possible to model not only the temperature evolution of WDs, but to determine abundances in the photosphere and to begin to characterize the second component in the emission. The existing spectra demonstrate the importance of multiple observations of individual systems. Sadly, unless a servicing mission provides HST with a revived UV spectroscopic capability or the FUSE operations staff are able to restore FUSE to operational status, the prospects for obtaining new spectra are modest.
Acknowledgement: This work was supported by NASA through grants associated with analyses of HST and FUSE spectra of CVs, specifically GO-9357 and GO-9791 from the Space Telescope Science Institute, and NAG5-13706 and NAG5-13717 directly from NASA.
References
- Cannizzo & Pudritz (1988) Cannizzo, J. K., & Pudritz, R. E. 1988, ApJ, 327, 840
- Córdova & Mason (1982) Córdova, F. A. & Mason, K. O. 1982, ApJ, 260, 716
- Czerny & King (1989a) Czerny, M., & King, A. R. 1989a, MNRAS, 236, 843
- Czerny & King (1989b) Czerny, M., & King, A. R. 1989b, MNRAS, 241, 839
- Drew & Proga (2000) Drew, J. E., & Proga, D. 2000, New Astronomy Review, 44, 21
- Drew & Verbunt (1988) Drew, J. E., & Verbunt, F. 1988, MNRAS, 234, 341
- Feldmeier & Shlosman (1999) Feldmeier, A., & Shlosman, I. 1999, ApJ, 526, 344
- Froning et al. (2001) Froning, C. S., Long, K. S., Drew, J. E., Knigge, C., & Proga, D. 2001, ApJ, 562, 963
- Froning et al. (2004) Froning, C. S., Long, K. S., Szkody, P., Gaensicke, B. T. 2004, Revista Mexicana de Astronomia y Astrofisica Conference Series, 20, 251
- Godon et al. (2004a) Godon, P., Sion, E. M., Cheng, F., Gänsicke, B. T., Howell, S., Knigge, C., Sparks, W. M., & Starrfield, S. 2004a, ApJ, 602, 336
- Godon et al. (2004b) Godon, P., Sion, E. M., Cheng, F. H., Szkody, P., Long, K. S., & Froning, C. S. 2004b, ApJ, 612, 429
- Hartley et al. (2002) Hartley, L. E., Drew, J. E., Long, K. S., Knigge, C., & Proga, D. 2002, MNRAS, 332, 127
- Knigge & Drew (1997) Knigge, C., & Drew, J. E. 1997, ApJ, 486, 445
- Knigge et al. (2002) Knigge, C., Hynes, R. I., Steeghs, D., Long, K. S., Araujo-Betancor, S., & Marsh, T. R. 2002, ApJ, 580, L151
- Knigge et al. (1995) Knigge, C., Woods, J. A., & Drew, E. 1995, MNRAS, 273, 225
- Kriz & Hubeny (1986) Kriz, S., & Hubeny, I. 1986, Bulletin of the Astronomical Institutes of Czechoslovakia, 37, 129
- Long et al. (2003) Long, K. S., Froning, C. S., Gänsicke, B., Knigge, C., Sion, E. M., & Szkody, P. 2003, ApJ, 591, 1172
- Long et al. (2005) Long, K. S., Froning, C. S., Knigge, C., Blair, W. P., Kallman, T. R., & Ko, Y. 2005, ApJ, 630, in press
- Long & Knigge (2002) Long, K. S., & Knigge, C. 2002, ApJ, 579, 725
- Long et al. (2004) Long, K. S., Sion, E. M., Gänsicke, B. T., & Szkody, P. 2004, ApJ, 602, 948
- Proga (2003) Proga, D. 2003, ApJ, 592, L9
- Shlosman & Vitello (1993) Shlosman, I., & Vitello, P. 1993, ApJ, 409, 372
- Sion et al. (2003) Sion, E. M., et al. 2003, ApJ, 592, 1137
- Stehle et al. (2001) Stehle, R., King, A., & Rudge, C. 2001, MNRAS, 323, 584
- Vitello & Shlosman (1993) Vitello, P., & Shlosman, I. 1993, ApJ, 410, 815
- Wade & Hubeny (1998) Wade, R. A., & Hubeny, I. 1998, ApJ, 509, 350