Rest-frame optical and far-infrared observations of extremely bright Lyman-break galaxy candidates at z 2.5
Abstract
We have investigated the rest-frame optical and far-infrared properties of a sample of extremely bright candidate Lyman-break galaxies (LBG) identified in the Sloan Digital Sky Survey. Their high ultraviolet luminosities and lack of strong ultraviolet emission lines are suggestive of massive starbursts, although it is possible that they are more typical luminosity LBGs which have been highly magnified by strong gravitational lensing. Alternatively, they may be an unusual class of weak-lined quasars. If the ultraviolet and submillimetre properties of these objects mirror those of less luminous, starburst LBGs, then they should have detectable rest-frame far-infrared emission. However, our submm photometry fails to detect such emission, indicating that these systems are not merely scaled-up (either intrinsically or as a result of lensing) examples of typical LBGs. In addition we have searched for the morphological signatures of strong lensing, using high-resolution, near-infrared imaging, but we find none. Instead, near-infrared spectroscopy reveals that these systems are, in fact, a rare class of broad absorption-line (BAL) quasars.
keywords:
galaxies: evolution – galaxies: formation – galaxies: quasars – galaxies: active – galaxies: individual: SDSS J024343.77082109.9, SDSS J114756.00025023.5, SDSS J134026.44+634433.2, SDSS J143223.10000116.4, SDSS J144424.55+013457.0, SDSS J155359.96+005641.3.1 Introduction
The very large areal coverage of the Sloan Digital Sky Survey (SDSS, York et al., 2000) provides a unique opportunity to identify rare, intrinsically luminous examples of high-redshift galaxy populations, as well as similarly rare, strongly-gravitationally magnified examples of more typical high-redshift galaxies. To exploit this opportunity, Bentz & Osmer (2004) searched the SDSS Early Data Release (Stoughton et al., 2002) for unusual quasars with anomalously low C iv 154.9nm emission, and found a luminous starburst candidate that appeared to have been incorrectly classified as a quasar by the SDSS pipeline.
Following on from this find, Bentz, Osmer & Weinberg (2004) identified a further five sources from the SDSS First Data Release (DR1) Quasar Catalog (Schneider et al., 2003) at 2.5–2.8 with rest-frame ultraviolet (UV) colours similar to Lyman-break galaxies (LBGs, Steidel et al., 2003) and exhibiting weak or absent high-ionisation emission lines in their rest-frame UV spectra. All six objects have -band magnitudes of 19.8–20.5, with a median of , i.e. they are an order of magnitude brighter than the most luminous objects in existing LBG surveys. Bentz, Osmer & Weinberg (2004) showed that if their UV emission arises solely from star formation then they are intensely active star-forming galaxies with strong lower limits on their star-formation rates ranging from 300 to 1100 M⊙ yr-1, assuming negligible absorption by dust and adopting a continuous star-formation rate over yrs (Kennicutt, 1998). Thus these candidate LBGs could be rare, extreme starbursts seen at the epoch, , when both the accretion luminosity density and the star-formation rate density in the Universe are believed to peak (Miyaji, Hasinger & Schmidt, 2000; Chapman et al., 2005).
Alternatively, the brightness and apparent rarity of these systems could simply reflect the fact that they are rare, strongly-magnified examples of the normal-luminosity LBG population. The LBG candidates show no evidence of multiple components at the resolution of SDSS imaging (1 arcsec) and there are no obvious foreground lensing structures. Nevertheless, gravitational lensing cannot yet be ruled out based on existing imaging.
The best argument against these galaxies being highly-magnified examples of normal LBGs results from their spectral properties: the underlying continuua are much redder than typical LBGs, with observed 200–600-nm spectral indices ranging from to (where ), cf. for most LBGs (Shapley et al., 2003), and the low-resolution SDSS spectra show strong (sometimes broad) interstellar absorption lines and Ly emission in several cases, as well as hints of broad C iii] 190.9nm emission in two cases (Bentz, Osmer & Weinberg, 2004). These features contrast with the narrow emission and interstellar absorption lines seen in the composite LBG spectrum of Shapley et al. (2003), but may be explained due to star-formation activity (and perhaps associated winds) an order of magnitude more vigorous than the sample considered by Shapley et al. (2003). The gross spectral properties of a source should not be affected markedly by lensing, so these differences argue that these galaxies are unlikely to be highly-magnified examples of the general LBG population. Rather, the spectral properties of these sources share key characteristics with the submm-selected galaxies identified in the recent spectroscopic survey of Chapman et al. (2003, 2005). In particular, they resemble N2 850.4, a composite starburst/AGN at = 2.38 (Smail et al., 2003) and the BAL–Sy2/QSO SMM J023990136 at = 2.80 (Ivison et al., 1998; Vernet & Cimatti, 2001) — the two-component Ly emission, broad C iii] and the absorption seen in C ii, Si iv, Al iii and C iv — although the candidate LBGs lack such prominent P-Cygni profiles. The LBG candidates also share some common characteristics with broad absorption-line (BAL) quasars — the presence of broad C iii]190.9nm in two examples and some very broad absorption lines — although the line profiles are not typical of BALs. There is thus a possibility that the UV emission from these galaxies is powered by accretion rather than star formation, or that the sample is a heterogeneous mix of star-forming galaxies and active galactic nuclei (AGN). A recent paper by Hall et al. (2004) discusses an unusual object, SDSS J113658.36+024220.1, whose rest-frame UV spectrum shows a single emission line corresponding to Ly but no obvious metal-line emission, which bears some similarities to the candidate LBGs studied here. Hall et al. (2004) interpret SDSS J1136 as an AGN based in large part on tentative optical variability and its strong radio emission, 1.4 mJy at 1.4 GHz.
If these galaxies are truly related to starburst LBGs then their prodigious star formation should be betrayed in the rest-frame far-infrared. Here, we exploit Submm Common-User Bolometer Array — SCUBA, Holland et al. (1999) — submillimetre (submm) photometry to search for such emission. We then use new, high-resolution, near-infrared imaging to identify the morphological signatures of strong lensing. Finally, we present near-infrared spectra of these galaxies, covering a number of key rest-frame optical emission lines falling in the and atmospheric windows, to spectroscopically classify the galaxies and to search for quasar signatures such as a tell-tale broad component to the H line. We describe our observations in §2, present our results and discussion in §3 and give our conclusions in §4.

2 Submillimetre and near-infrared observations
| Source name | (UV)a | ||||||
|---|---|---|---|---|---|---|---|
| (mag) | (mag) | (mag) | (mag) | (mJy) | (mJy) | ||
| SDSS J024343.77082109.9 | 2.590 | 17.33 0.02 | 1.62 0.02 | 2.75 | 3.07 | 2.13 2.02 | 5 0.97 |
| SDSS J114756.00025023.5 | 2.556 | 15.58 0.02 | 1.71 0.03 | 4.25 | 3.71 | +2.61 2.90 | 5 1.03 |
| SDSS J134026.44+634433.2c | 2.786 | 16.90 0.10 | 1.00 0.15 | 2.06 | 2.76 | +1.93 3.33 | 5 0.98 |
| SDSS J143223.10000116.4 | 2.472 | 16.65 0.03 | 1.90 0.04 | 3.86 | 3.47 | … | 5 0.97 |
| SDSS J144424.55+013457.0 | 2.670 | 17.59 0.04 | 1.07 0.05 | 2.92 | 2.49 | 1.33 2.78 | 5 1.01 |
| SDSS J155359.96+005641.3 | 2.635 | 16.25 0.03 | 1.86 0.04 | 3.95 | 3.43 | … | 5 0.94 |
a UV redshifts were measured using cross-correlation with a
quasar template and searches for emission lines (Schneider et al., 2002).
b Aperture magnitudes, measured in 6-arcsec-diameter apertures.
Correction for line contamination is discussed in §3.2.
c Near-infrared photometry from Teplitz et al. (2004).
Submm photometry observations were obtained for four of our LBG candidates in service time on 2004 January 15 and 28 with SCUBA on the James Clerk Maxwell Telescope (JCMT666The JCMT is operated by the Joint Astronomy Centre in Hilo, Hawaii, on behalf of the Particle Physics and Astronomy Research Council (PPARC) in the UK, the National Research Council of Canada, and The Netherlands Organisation for Scientific Research.). On the first night, observations of SDSS J1147, SDSS J1340 and SDSS J1444 were made in average opacity conditions ( 0.3–0.4), and on the second night observations of SDSS J0243 were made in better conditions ( 0.1–0.2). We used SCUBA in two-bolometer mode, giving a 15 per cent improvement in signal-to-noise compared with one-bolometer mode. Each source was observed for 1.8 ks. The starlink package surf was used to reduce the data for each bolometer separately. The resulting signals were then calibrated against the JCMT secondary calibrators CRL 618 and 162932422, and co-added to give weighted 850-m flux densities and errors (see Table 1). Calibration uncertainties are estimated to be 10 per cent.
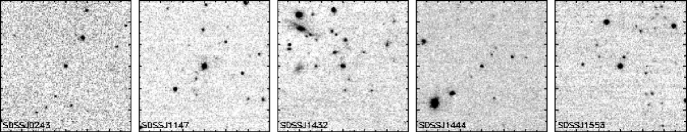
Near-infrared imaging data in the - and -bands were obtained for the five bright LBG candidates accessible to the 3.8-m UK Infrared Telescope (UKIRT777UKIRT is operated by the Joint Astronomy Centre on behalf of PPARC.) during 2004 January–April and 2004 July–August. Flexible scheduling enabled us to utilise better-than-average seeing on Mauna Kea, 0.4–0.6 arcsec, and we employed the UKIRT Fast Track Imager, UFTI (Roche et al., 2003), a 10242 HgCdTe array with 0.091-arcsec pixels, to exploit those conditions. The total integration time in each filter, built up whilst dithering every 60 s, was 3.8 ks. Contiguous observations of nearby faint standards were used to determine zero points. The 3- detection threshold is 21.5 in a 4-arcsec-diameter aperture. Data were reduced using orac-dr and we report effective total magnitudes/colours (measured from 6-arcsec-diameter photometry) for the LBG candidates in Table 1. Objects in the frames were then identified and catalogued using SExtractor (Bertin & Arnouts, 1996) and colours measured in 2-arcsec-diameter apertures from the aligned - and -band frames. -band images of regions around each target are shown in Fig. 1, with the – colour-magnitude distributions for each field displayed in Fig. 2.
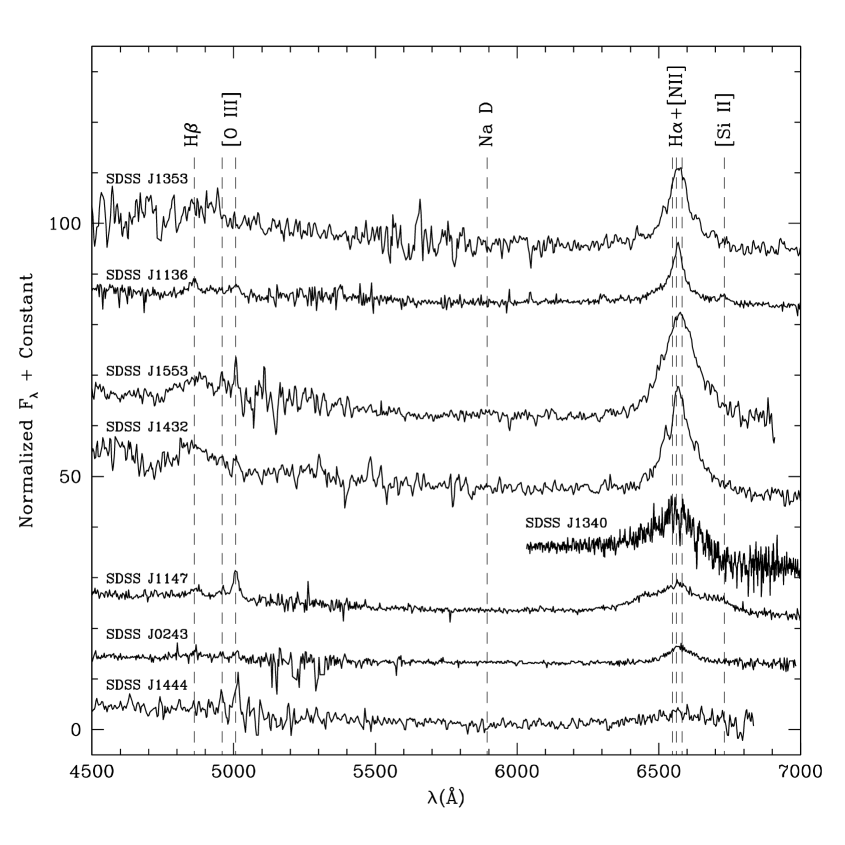
Spectra were obtained during 2004 April and August with the UKIRT 1–5 m Imager Spectrometer, UIST (Ramsay Howat et al., 1998), which utilises a 10242 InSb array with 0.12-arcsec pixels. UIST’s grism was used to cover the 1.4–2.5 m region, with measured resolutions of = 390 and 680 (for arc lines at 1.5 and 2.3 m) for our 4-pixel-wide slit (0.48 120 arcsec). Acquisition was accomplished using 20–60-s sky-subtracted images of each field. We are confident that all targets were placed within a pixel of the optimal position on the slit. Each target was observed for 6.7 ks, nodding along the slit in an A-B-B-A sequence every 240 s. An Argon arc spectrum and a flatfield frame were obtained prior to observations of each target. Nearby F5V standard stars were observed contiguously to set the flux scale, having interpolated across their Hydrogen absorption lines before ratioing. The frames were reduced using orac-dr, with optimal extraction of spectra accomplished using figaro. For comparison purposes we also obtained UIST -spectra of the weak-lined quasar SDSS J113658.36+024220.1 ( = 2.4917, Hall et al., 2004) and the = 2.320 LoBAL quasar, SDSS J135317.80000501.3 (Reichard et al., 2003; Willott et al., 2003). All the spectra are shown in Fig. 3.
A further spectrum was obtained for the LBG candidate inaccessible to UKIRT (SDSS J134026.44+634433.2) using NIRSPEC on Keck-ii888The W. M. Keck Observatory is operated as a scientific partnership among the California Institute of Technology, the University of California and the National Aeronautics and Space Administration. The Observatory was made possible by the generous financial support of the W. M. Keck Foundation. during relatively poor conditions (0.9-arcsec seeing) on 2005 March 18. The full spectral range was 2.27–2.69 m with a resolution of 1,500, utilising a 42 0.76-arcsec (4-pixel) slit. The total integration time was 1.6 ks, split into four A-B-B-A sequences with 100 s per exposure. A flux standard was not observed; otherwise, the data reduction followed that employed for UIST.
3 Results and discussion
We now discuss the insights provided into the nature of the candidate LBGs by our various multi-wavelength observations. The basic properties of our sample — redshifts, near-infrared photometry and 850-m flux densities — are listed in Table 1. -band imaging of the target fields are shown in Fig. 1, – colour magnitude diagrams of these fields in Fig. 2 and the spectra of the candidate LBGs in Fig. 3. Line widths and fluxes for the stronger features in these spectra are listed in Table 2.
3.1 Submillimetre properties
Studies of submm-selected galaxies (SMGs) have concluded that most are too faint in the UV to be identified by the photometric selection used for LBG surveys (Webb et al., 2003). This suggests little overlap between these two well-studied classes of high-redshift star-forming galaxies. However, statistical measurements of the submm emission from samples of LBGs, reaching below SCUBA’s confusion limit, suggest that they may contribute substantially to the SMG population at sub-mJy levels (Peacock et al., 2000; Webb et al., 2003; Kneib et al., 2004). Only a handful of brighter examples are known (Chapman et al., 2002). There is evidence of a more significant overlap between SMGs and the UV-selected population identified at somewhat lower redshifts, 1.5–2.5 (Steidel et al., 2004), although again many of the SMGs are too faint to be included in the photometric samples (Chapman et al., 2005).
The raw star-formation rates estimated from the observed UV luminosities of the SDSS sources, uncorrected for dust extinction, would imply L⊙ for our sample, where SFR = 10 M⊙ yr-1 and = 0.8–2.1 (Scoville & Young, 1983; Thronson & Telesco, 1986), and thus 850-m flux densities of 3–10 mJy (Blain & Longair, 1996). Assuming a correction factor for dust extinction typical of LBGs, 6 (Pettini et al., 2002; Erb et al., 2003), the predicted submm fluxes would increase by a similar factor. This suggests that the candidate LBGs should be detectable in the submm waveband if they have submm/UV flux ratios similar to the more typical luminosity members of this population. This conclusion holds whether these galaxies are either intrinsically bright in the UV or are lensed (assuming that the lensing does not preferentially boost the UV-bright regions).
The submm data presented in Table 1 demonstrate that the four SDSS sources we have observed are all undetected individually at flux limits of 6–8 mJy. This implies that it is unlikely that these galaxies are simply scaled-up or strongly-lensed examples of typical-luminosity LBGs. Indeed, the weighted mean for the four sources (0.36 1.31 mJy) suggests that they would not have been detected in even the deepest submm survey, although we cannot rule out the possibility that the sample is heterogeneous, with a handful of faint submm emitters.
For completeness we note that a search of the FIRST radio survey (Becker, White & Helfand, 1995) yielded only upper limits at 1.4 GHz (Table 1), and that none of the galaxies were detected by ROSAT to limits appropriate for the X-Ray All-Sky Survey.
3.2 Photometric and morphological properties
| Source | FWHM(H) | Flux(H) | Flux([Oiii]5007) | Flux(H) | EWa (H) | ([Oiii]) | (H) |
|---|---|---|---|---|---|---|---|
| Name | (km s-1) | ( W m-2) | ( W m-2) | ( W m-2) | (nm) | ||
| SDSS J024343.77082109.9 | 5,360 | 1.4 0.1 | 3 0.3 | 3 0.3 | 96 | 2.5940 | 2.5995 |
| SDSS J114756.00025023.5 | 13,830 | 5.3 0.2 | 0.5 0.1 | 0.4 0.1 | 152 | 2.5701 | 2.5668 |
| SDSS J134026.44+634433.2 | 12,200b | … | … | … | 164b | … | … |
| SDSS J143223.10000116.4 | 6,150 | 8.6 0.2 | 1.3 0.1 | 2.1 0.1 | 166 | 2.4728 | 2.4772 |
| SDSS J144424.55+013457.0 | 5,730c | 2.1 0.3c | 0.6 0.1 | 3 0.4 | 30c | 2.6767 | 2.6715 |
| SDSS J155359.96+005641.3 | 7,190 | 11.6 0.3 | 0.5 0.1 | 2.0 0.2 | 157 | 2.6350 | 2.6404 |
| SDSS J113658.36+024220.1 | 4,100 | 3.5 0.1 | 0.3 0.1 | 0.4 0.1 | 106 | 2.4928 | 2.4946 |
| SDSS J135317.80000501.3 | 5,180 | 6.1 0.2 | 3 6.0 | 3 0.3 | 139 | – | 2.3182 |
a Not corrected to the rest frame.
b Fits assume (H) = (UV) = 2.786.
c Lower limits, given the lack of continuum redward of the line.
Our near-infrared observations indicate that the median observed colours for the LBG candidates are , and . Comparing the colours with the spectra of the sources, from §3.3, it is clear that the LBG candidates with the strongest line emission in the -band also have the reddest continuum colours, suggesting that the line emission is biasing the colours we measure. With typical observed-frame equivalent widths of 100 to 150 nm, and a -band filter width of 350 nm, the fluxes in should be corrected by approximately 0.6–0.7 (or +0.5 in magnitudes). No sources are classed as extremely red objects on the basis of either their or colours, although the reddest source in the optical/near-infrared, SDSS J1147, is also the reddest in the rest-frame UV and is the only candidate LBG in our sample which does not show Ly emission. The median colour of our sample is comparable to that seen for LBGs from Shapley et al. (2001), , although our candidate LBGs are redder on average in than the standard UV-selected populations at or , and , respectively (Shapley et al., 2001; Steidel et al., 2004). This suggests that the rest-frame UV continua may be significantly redder than normal LBGs, although their rest-frame optical continua are comparable (before correcting for emission-line contributions).
Turning to the high-resolution near-infrared imaging (Fig. 1), we find that all five candidate LBGs are unresolved at the 0.45–0.55-arcsec seeing of our -band images (as measured from multiple stars in each frame). Given the signal to noise of our detections of the LBGs and their measured FWHM relative to stars in the fields, we can place firm limits of arcsec fwhm on the sizes of these sources or on the separation of multiple components if they are strongly lensed. In the absence of lensing, this angular limit corresponds to an intrinsic size of 1 kpc for the physical scale of these sources in their rest-frame -band light.
We identify none of the morphological signatures expected from strong galaxy–galaxy lensing in our deep -band images: multiple lensed components or an identifiable foreground lens. We note that the angular size limit estimated above, if taken as the Einstein diameter, would correspond to a velocity dispersion of only 50 km s-1 (for a spherical isothermal lens at ). This velocity dispersion would correspond to a 0.1 L∗ early-type galaxy with an expected magnitude of at , detectable in our imaging out to (Rusin et al., 2003). No such nearby lenses are visible in our imaging on the relevant scales (0.2–2 arcsec).
Looking at a wider region around the candidate LBGs we see a compact = 17.9 galaxy (with ) lying only 4 arcsec away from SDSS J1553, but this would not provide a strong amplification of the source. We also find that SDSS J1432 sits in the outskirts of a dense, compact foreground group, the brightest members of which have 16. It is possible that the LBG candidate is thus magnified by weak lensing from the foreground structure, although the total magnification is likely to be modest. The fields surrounding SDSS J0243 and SDSS J1444 are unremarkable, but we do identify a group of 5–6 faint, resolved galaxies, 19.4, within 15 arcsec of SDSS J1147. These are possibly members of a cluster, either in the foreground or (given their faintness) associated with the candidate LBG. These faint galaxies exhibit a wide range in colours, 0.8–3.0, including some extremely red objects. In addition, several brighter galaxies, 17.3, lie within 20 arcsec. We cannot demonstrate a significant over-density, but they could be more luminous members of the same structure.
Looking at the – colour-magnitude plots (Fig. 2) for the five fields we see that the LBG candidates are rarely the reddest galaxy in the field, although both SDSS J1147 and SDSS J1432 have very red, close neighbours (–3.0). The most striking feature is the colour-magnitude sequence seen in the distribution of galaxy colours in the SDSS J1432 field. This has a characteristic colour of at , consistent with that expected for evolved galaxies in a group or poor cluster at –0.8 (Feulner et al., 2003). The close similarity of the colours of the candidate LBG to these galaxies may either be a coincidence or could point to contamination of our photometric measurement by a superimposed member of this group (which could thus also gravitationally magnify the background source). We believe that the similarities in the colours are merely a coincidence as it is clear from the spectrum of SDSS J1432 (Fig. 3) that there is a significant contribution to the -band light from the background source.
We conclude that the morphological information for all five of the candidate LBGs we have imaged at 0.55-arcsec resolution provides no support for them being strongly lensed. There is possible evidence for weak lensing for one or more sources, but this would not significantly affect the apparent magnitudes of these systems.
3.3 Spectral properties
It is immediately apparent from the rest-frame optical spectra presented in Fig. 3 that all six of the spectroscopically-observed LBG candidates contain broad-line AGN. All have broad H emission, with fwhm line widths ranging from 5,000 to 14,000 km s-1 (Table 2) and broad components visible in H for several systems (despite the typically poorer signal-to-noise in the -band). SDSS J1444 has the weakest emission and there is no spectral coverage beyond the red extreme of the line due to its high redshift, but a broad H line is still apparent. Comparing them to the two known AGN we observed, the weak-lined AGN SDSS J1136 and the low-ionisation BALQSO SDSS J1353, we see that the candidate LBGs exhibit broader H emission than either of these two AGN.
So, clear AGN features are visible in the rest-frame optical, whereas the UV spectra of these galaxies are characterised by a strong continuum but lack the strong emission lines typical of AGN. Does the AGN contribute significantly to the UV fluxes of these galaxies?
The redshift measurements available to us tend to follow the same pattern for all the LBG candidates: the UV-determined values, based predominantly on the prominent Ly emission line, are slightly blueward of the [O iii] 500.7nm and H lines ( 0.0051 0.0057 and 0.00650.0037, respectively). The only exception is SDSS J1444, where the Ly and H redshifts are identical, but the H redshift is poorly determined. The H emission we see originates close to the AGN, in the broad-line region (BLR), so it is natural to assume that the UV absorption lines are due to wind-driven material in our line of sight to the BLR, and that the UV continuum also arises close to the AGN. Indeed, there is a tight correlation between the FWHM of the H (Table 2) and the absolute -band magnitudes from Bentz, Osmer & Weinberg (2004): the 0.07-dex scatter suggests a close relationship between the UV continuum emission and the AGN. However, it is not clear whether this is a direct relationship, or whether it arises merely because more massive AGN reside in more luminous galaxies. Nevertheless, assuming that the candidate LBGs have intrinsic power-law continua characteristic of normal quasars, with (Vanden Berk et al., 2001), then their observed rest-frame 200–600-nm spectral slopes ( to ) indicate substantial dust extinction, –1.95, for a Calzetti extinction law (Calzetti et al., 2000).
But where are the UV emission lines usually associated with quasar activity? If they have been quenched by dust surrounding the active nuclei, why can we still see intense UV continuum emission? The spectral characteristics of these galaxies are unusual, but the presence of strong and broad absorption lines in the UV are similar to those seen in less-reddened examples of the most extreme BAL quasars found by the SDSS (Hall et al., 2002) and in the Digitized Palomar Observatory Sky Survey (Brunner et al., 2003). Indeed, very recently Appenzeller et al. (2005) have published high-resolution échelle spectroscopy of SDSS J1553 which provides much higher-quality information about the UV spectral properties of this galaxy. Based on their analysis of the detailed properties of the absorption lines, they conclude that SDSS J1553 is a low-ionisation BAL quasar (LoBALQSO), or perhaps an even rarer FeLoBALQSO. The very strong low-ionisation absorption features found in LoBALQSOs across a wide velocity range can strongly suppress the emission-line components in these systems, leading to the absorption-dominanted UV spectra we see. The UV absorption features of SDSS J1553 are typical of those seen in the other five galaxies and so we expect that deeper and higher resolution spectroscopy of the complete sample would likely lead to the same conclusion for the other sources. Indeed, based on the existing low-resolution SDSS spectra, Appenzeller et al. (2005) suggest at least two-thirds of the sample may be LoBALQSOs. The relative weakness and narrowness of the BAL features, combined with the absence of strong UV emission features, suggests that the outflows in these galaxies may differ in terms of their velocity and spatial coverage compared to those seen in typical LoBALQSOs. Alternatively, these AGN may be similar to SDSS J1136 (Fig. 3), which Hall et al. (2004) suggest for some unknown reason has weak, broad and highly blue-shifted emission lines.
Finally, we want to highlight the properties of SDSS J1340. This candidate LBG was detected at 16 m using Spitzer by Teplitz et al. (2004). They interpret this detection in terms of a massive starburst, even though the optical/mid-infrared spectral energy distribution (SED) of SDSS J1340 in Teplitz et al. (2004) is best fit by the SED for the Seyfert-1, NGC 5548. Our non-detection of the source in the submm suggests that the 16 m detection most likely arises from high-temperature AGN-heated dust, rather than a bolometrically luminous starburst. Further support for the presence of a bolometrically luminous AGN in this system comes from the detection of a strong and broad H line in our near-infrared spectrum (Fig. 3).
4 Conclusions
We present multi-wavelength observations of a sample of six candidate LBGs at –2.8 identified from the SDSS DR1 QSO Catalog by Bentz, Osmer & Weinberg (2004). We suggest that these sources could be either: 1) intrinsically luminous, UV-bright starbursts; 2) strongly-lensed examples of typical-luminosity LBGs; or 3) a class of quasars with extremely weak UV emission lines.
We do not detect any of the four candidate LBGs observed in the submm, placing a strong constraint on the submm emission from the ensemble. This suggests that the sources are unlikely to be strongly-lensed examples of more typical LBGs, or intrinsically-luminous LBGs, unless the far-infrared emission from such UV starbursts declines precipitously at high luminosities. Two further pieces of evidence weigh against the lensing hypothesis: first, the UV spectral properties of the candidate LBGs do not match those of typical luminosity LBGs; second, using high-resolution near-infrared imaging of five of the candidates we find no morphological evidence of strong lensing. Taking these results together, we conclude that the sources in our sample are unlikely to be either intrinsically-luminous LBGs or rare, strongly-lensed examples of more normal LBGs. This suggests that they are most likely to be unusual AGN.
Our near-infrared spectroscopy confirms this suggestion, identifying very broad lines in the rest-frame optical spectra of all six galaxies in the sample. We therefore conclude that the six apparently extremely luminous LBGs identified by Bentz, Osmer & Weinberg (2004) are likely to be LoBALQSOs whose unusually weak UV emission lines may either be an intrinsic property of these AGN (Hall et al., 2004) or result from a complex distribution of absorption in the outflow close to the AGN.
Acknowledgments
We thank Pat Osmer and David Weinberg for their work on the SDSS LBG survey. We also thank Alastair Edge for useful conversations, and the referee for suggestions that improved the paper markedly. We acknowledge service observations from the JCMT. IRS acknowledges support from the Royal Society. MB is supported by a Graduate Fellowship from the National Science Foundation. AWB acknowledges support from NSF grant AST-0205937, the Research Corporation and the Alfred P. Sloan Foundation.
References
- Appenzeller et al. (2005) Appenzeller I., Stahl O., Tapken C., Mehlert D., Noll S., 2005, A&A, 435, 465
- Becker, White & Helfand (1995) Becker R.H., White R.L., Helfand D.J., 1995, ApJ, 450, 559
- Bertin & Arnouts (1996) Bertin E., Arnouts S., 1996, A&AS, 117, 393
- Bentz & Osmer (2004) Bentz M.C., Osmer P.S., 2004, AJ, 127, 576
- Bentz, Osmer & Weinberg (2004) Bentz M.C., Osmer P.S., Weinberg D.H., 2004, ApJ, 600, L19
- Blain & Longair (1996) Blain A.W., Longair M.S., 1996, MNRAS, 279, 847
- Brunner et al. (2003) Brunner R.J. et al. 2003, AJ, 126, 53
- Calzetti et al. (2000) Calzetti D., Armus L., Bohlin R.C., Kinney A.L., Koornneef J., Storchi-Bergmann T., 2000, ApJ, 533, 682
- Chapman et al. (2002) Chapman S.C., Shapley A., Steidel C., Windhorst R., 2002, ApJ, 572, L1
- Chapman et al. (2003) Chapman S.C., Blain A.W., Ivison R.J., Smail I. 2003, Nature, 422, 695
- Chapman et al. (2005) Chapman S.C., Blain A.W., Smail I., Ivison R.J. 2005, ApJ, 622, 772
- Erb et al. (2003) Erb D. et al. 2003, ApJ, 591, 101
- Feulner et al. (2003) Feulner G., Bender R., Drory N., Hopp U., Snigula J., Hill G.J., 2003, MNRAS, 342, 605
- Hall et al. (2002) Hall P.B. et al. 2002, ApJS, 141, 267
- Hall et al. (2004) Hall P.B. et al. 2004, AJ, 127, 3146
- Holland et al. (1999) Holland W.S. et al. 1999, MNRAS, 303, 659
- Ivison et al. (1998) Ivison R.J., Smail I., Le Borgne J.-F., Blain A.W., Kneib J.-P., Bézecourt J., Kerr T.H., Davies J.K. 1998, MNRAS, 298, 583
- Kennicutt (1998) Kennicutt R.C., 1998, ARA&A, 36, 189
- Kneib et al. (2004) Kneib J.-P., van der Werf P.P., Kraiberg Knudsen K., Smail I., Blain A., Frayer D., Barnard V., Ivison R., 2004, MNRAS, 349, 1211
- Miyaji, Hasinger & Schmidt (2000) Miyaji T., Hasinger G., Schmidt M., 2000, A&A, 353, 25
- Peacock et al. (2000) Peacock J.A. et al., 2000, MNRAS, 318, 535
- Pettini et al. (2002) Pettini M., Rix S.A., Steidel C.C., Adelberger K.L., Hunt M.P., Shapley A.E., ApJ, 2002, 569, 742
- Ramsay Howat et al. (1998) Ramsay Howat S.K. et al., 1998, SPIE, 3354, 456
- Reichard et al. (2003) Reichard T.A. et al., 2003, AJ, 125, 1711
- Roche et al. (2003) Roche P.F. et al., 2003, SPIE, 4841, 901
- Rusin et al. (2003) Rusin D. et al., 2003, ApJ, 587, 143
- Schneider et al. (2002) Schneider D.P. et al., 2002, AJ, 123, 567
- Schneider et al. (2003) Schneider D.P. et al., 2003, AJ, 126, 2579
- Scoville & Young (1983) Scoville N.Z., Young J.S., 1983, ApJ, 265, 148
- Shapley et al. (2001) Shapley A.E., Steidel C.C., Adelberger K.L., Dickinson M., Giavalisco M., Pettini M., 2001, ApJ, 562, 95
- Shapley et al. (2003) Shapley A.E., Steidel C.C., Pettini M., Adelberger K.L., 2003, ApJ, 588, 65
- Smail et al. (2003) Smail I., Chapman S.C., Ivison R.J., Blain A.W., Takata T., Heckman T.M., Dunlop J.S., Sekiguchi K., 2003, MNRAS, 342, 1185
- Steidel et al. (2003) Steidel C.C., Adelberger K.L., Shapley A.E., Pettini M., Dickinson M., Giavalisco M., 2003, ApJ, 592, 728
- Steidel et al. (2004) Steidel C.C., Shapley A.E., Pettini M., Adelberger K.L., Erb D.K., Reddy N.A., Hunt M.P., 2004, ApJ, 604, 534
- Stoughton et al. (2002) Stoughton C. et al., 2002, AJ, 123, 485
- Teplitz et al. (2004) Teplitz H.I. et al., 2004, ApJS, 154, 103
- Thronson & Telesco (1986) Thronson H., Telesco C., 1986, ApJ, 311, 98
- Vanden Berk et al. (2001) Vanden Berk D.E. et al., 2001, AJ, 122, 549
- Vernet & Cimatti (2001) Vernet J., Cimatti A., 2001, A&A, 380, 409
- Webb et al. (2003) Webb T.M.A. et al. 2003, ApJ, 582, 6
- Willott et al. (2003) Willott C.J., Rawlings S., Grimes J.A., 2003, ApJ, 598, 909
- York et al. (2000) York D.G. et al. 2000, AJ, 120, 1579