A resolved outflow of matter from a brown dwarf
Emma T. Whelan1, Thomas P. Ray1, Francesca Bacciotti2, Antonella Natta2, Leonardo Testi2 & Sofia Randich2
1 Dublin Institute for Advanced Studies, 5 Merrion Square, Dublin 2,
Ireland
2 Osservatorio Astrofisico di Arcetri, INAF, Largo E.Fermi 5, I-50125 Firenze, Italy
The birth of stars involves not only accretion but also, counter-intuitively, the expulsion of matter in the form of highly supersonic outflows1,2. Although this phenomenon has been seen in young stars, a fundamental question is whether it also occurs amongst newborn brown dwarfs: these are the so-called ’failed stars’, with masses between stars and planets, that never manage to reach temperatures high enough for normal hydrogen fusion to occur3. Recently, evidence for accretion in young brown dwarfs has mounted4-6, and their spectra show lines that are suggestive of outflows7-9. Here we report spectro-astrometric data that spatially resolve an outflow from a brown dwarf. The outflow’s characteristics appear similar to, but on a smaller scale than, outflows from normal young stars. This result suggests that the outflow mechanism is universal, and perhaps relevant even to the formation of planets.
The nearby -Ophiuchi Cloud (at a distance of 125 pc; ref. 10) is an excellent example of a stellar nursery. It was as part of a near-infrared survey of this region11 that -Oph 102 was first detected. Its mass is given as 60 (ref.7), where 1 equals the mass of Jupiter or . This places it firmly within the brown dwarf mass range ()3 and indeed this object has been spectroscopically confirmed to be a BD7. There is also strong evidence for the presence of an accretion disk4 and, in fact, the accretion rate (derived from its H profile)7 is estimated to be approximately 10-9 yr-1. Finally it has been noted that its spectrum contains a number of forbidden emission lines suggesting an outflow7.
Tracing an outflow from a young star is done using a variety of techniques depending upon wavelength. When the star itself is sufficiently evolved to be optically visible, i.e. much of the surrounding natal gas and dust has been driven away, the outflow can be followed almost right back to the star through its permitted and forbidden line emission1. Nearest the source, the light from the collimated outflow is most intense, giving rise to the so-called “micro-jets” observed, for example, from T Tauri stars, the precursors to stars like our sun12. In extreme cases, the outflow is observed only very close (1″) to the source13, i.e. within the typical “seeing” disc for ground based telescopes. It is under such circumstances that the technique of spectro-astrometry comes to the fore (see Methods and Supplementary Information).
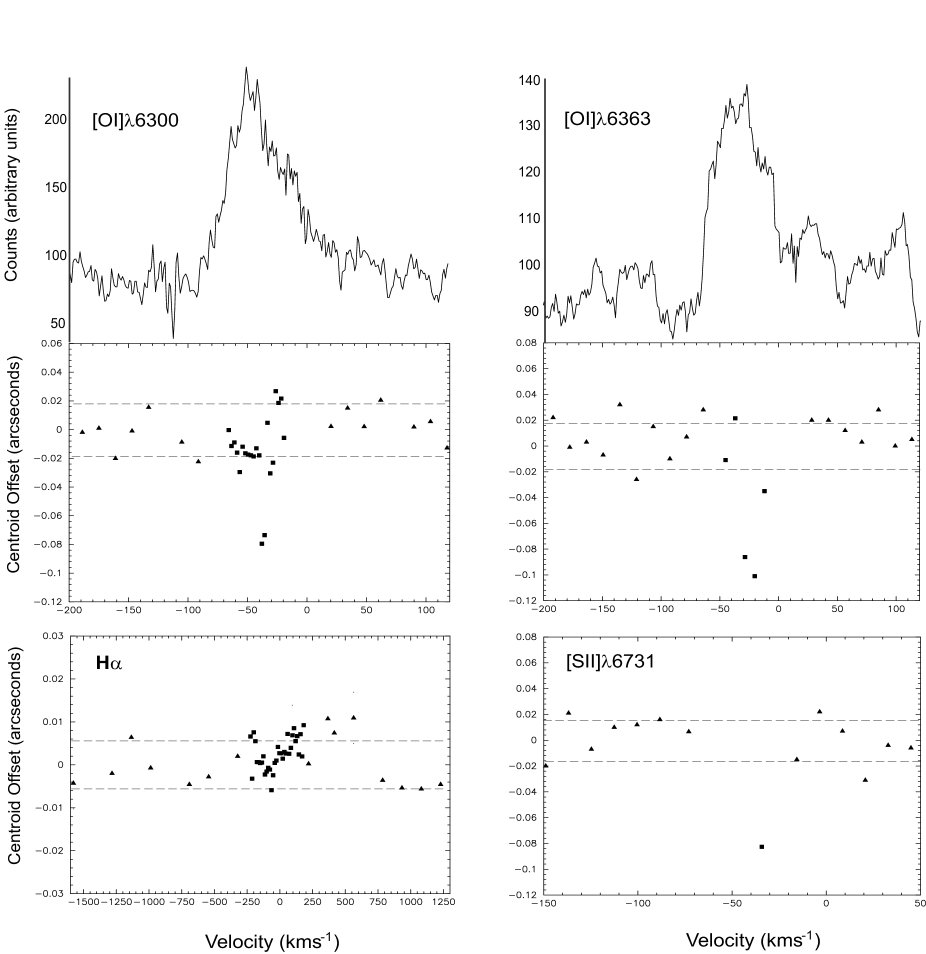
Our high resolution echelle observations (see Methods and Fig. 1) of -Oph 102 first of all show its forbidden emission lines, e.g. [OI]6300,6363 and [SII]6731, are moderately blueshifted (V -45 kms-1). Such radial velocities are very similar to those seen in outflows from classical T Tauri stars, and might be expected of an outflow from a young BD, as its escape velocity is similar14. We note also the absence of a redshifted outflow component. This is again typical of T Tauri stars and is interpreted in terms of an obscuring disk that hides the redshifted component from our view13. We can thus immediately infer the presence of a disk around this brown dwarf (see below for a limit on its size). Such a conclusion is also in line with the mid-infrared excess seen from this object4. Note that all velocities are with respect to the systemic velocity of the BD. The latter was derived from the Li 6708 photospheric absorption line and equals 78 kms-1 in the Local Standard of Rest frame.
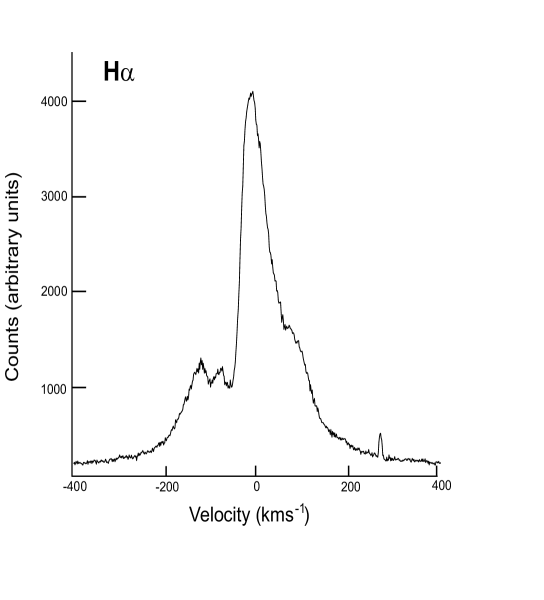
Another indication that an outflow is present comes from a cursory examination of the H line (Fig. 2). Its profile is clearly asymmetrical, i.e. the blueshifted wing of the line appears to be absorbed in a P-Cygni like fashion. We note however that we do not observe a classical P-Cygni profile, i.e one that dips below the continuum. Such a profile is in any event a rare occurrence even amongst T Tauri stars15.
If we are dealing with a scaled-down version of the outflow phenomenon seen in T Tauri stars then we expect the centre of emission in forbidden lines, to be spatially offset from the continuum, i.e. the BD. This offset is due to the fact that, for a collimated outflow, such lines are quenched close to the star once the electron density becomes high enough13. In the case of outflows from T Tauri stars, typical offsets of 30-75 AU (02-05 at 150 parsecs) are seen, for example, in [OI]6300,6363 and the red [SII] doublet13. If we assume brown dwarf outflows have similar opening angles and velocities to those from T Tauri stars, then the point at which the critical density is reached, naïvely scales with Ṁ where Ṁjet is the jet’s mass loss rate (see Supplementary Information). Assuming the latter depends linearly on the accretion rate, we would expect typical spatial offsets to be 3-10 times smaller in brown dwarf outflows in comparison to those from T Tauri stars.
Spectro-astrometric (emission centroid offset versus velocity) plots are shown in Fig. 1 for the [OI]6300, [OI]6363, H and [SII]6731 lines. Because of high electron densities close to the BD, [SII]6717 was too weak to provide a usable spectro-astrometric signal. Here the spatial offsets were measured after continuum subtraction (see the Methods and Supplemenatry Information for details).
We now consider the main results from various offset versus velocity plots. First, the centroids of all the measurable forbidden lines are displaced to the south, i.e. have negative offsets with respect to the continuum. These offsets reach a maximum, of 00801, at a blue-shifted velocity of approximately -40 kms-1. We have already noted the absence of any corresponding redshifted emission and that this suggests the presence of an obscuring disk. The scale of the blueshifted offset would suggest a minimum (projected) disk radius of 01 ( 15 AU at the distance of the Ophiuchi Cloud) in order to hide any redshifted component.
Second, there is no clear spatial offset in H even though its higher signal to noise potentially allows us to measure even smaller offsets than observed in the forbidden lines. This is in agreement with the idea that most of the H emission arises from accretion7 on much smaller scales than are being probed here. It is also worth pointing out that if, as is almost certainly the case, the blue-ward dip in the H profile is caused by P Cygni-like absorption from an outflowing wind in front of the star, no offset should be expected.
Third, both the line profiles and the spectro-astrometric signatures are very similar (albeit on somewhat smaller scales) to what is seen in T Tauri stars with “micro-jets”. In particular the observed velocities and offsets in the various forbidden lines are within the range we would expect for a collimated outflow from a brown dwarf (see also Supplementary Information). We suggest that direct imaging, (using, for example, Fabry-Perot systems) of this and other candidate brown dwarf outflows, should now be attempted. Such observations however will be very challenging, even with large telescopes, because of the expected faintness of the outflow.
Methods
Spectro-astrometry
Conceptually the principles of spectro-astrometry are easy to understand. The profile of a star is smeared by atmospheric turbulence to appear gaussian (at least to a first approximation) rather than point-like. Whereas the width of the profile is determined by the so-called seeing, how accurately we can determine the centroid of emission is, in theory for fixed seeing, limited only by the strength of the observed signal to noise ratio. Increasing the total number of detected photons increases the positional, or astrometric, accuracy, so that, in principle, milliarcsecond precision is possible with very large ground based telescopes16-18.
Consider now a long-slit spectrum of a close binary system consisting of two virtually identical stars. We will assume that the slit is orientated along the same position angle as the binary. (We note that strictly this is not necessary: it is only necessary that the slit is not orthogonal). If the separation of the binary is considerably less than the seeing, the profile of the system in the spatial direction will consist of a single gaussian-that is, the system is unresolved and the centroid of emission will lie exactly between the two components. Now suppose that one of the two stars differs slightly from the other in being a strong H emitter; in such a case, the emission centroid will shift towards that star in the spectrum at the position of the H line. In this way it is possible to resolve certain types of binaries with separations well within the seeing limit19. In the case of a jet (pure emission line region) plus star (continuum source), one can go further and interpolate the continuum across a line, thereby allowing its contribution to be removed. It is then possible to measure separately the spatial centroid of the pure emission line region and determine its offset with respect to the continuum, that is, the parent star. Moreover, as the line can be emitted over a range of wavelengths, owing to the Doppler effect, it may also be feasible to recover spatio-kinematic information. For example, if the jet is bipolar, that is, it has oppositely directed blue- and redshifted flows from the source; the emission centroid of the red and blue wings of the line will be displaced to opposite sides of the continuum centre.
The detailed method by which we measure offsets can briefly be described as follows. First, the centroid of the continuum emission in the spatial direction is determined using a one-dimensional gaussian fit. The line of such centroids, in the dispersion direction but excluding any region where emission lines are present, is then fitted with a second-order polynomial, over a range of typically 200-300 . In this way, instrumental curvature and tilting, with a characteristic frequency many times larger than the width of any line, is determined. The fit, to the centre of the continuum, is then subtracted from the actual measured centroids, leaving residuals that are evenly scattered about the abscissa (that is, the fit defines the zero offset line). The continuum data points shown in Fig. 1 are thus the residuals. Finally, the two-dimensional fit to the continuum, broadened to take account of the point spread function, is subtracted from the emission lines. Any emission line offsets are then measured.
The accuracy (in arcseconds) of the method is set by the error in the centroid of the gaussian fit, which depends on the seeing and the number of detected photons, N. Formally, the error is given by Seeing/[2(2 ln 2)1/2N1/2], assuming that photon noise is the only source of noise. N, of course, is a function of the binning and the spatial sampling (pixel width). This explains why, for example, we can achieve a higher spectro-astrometric accuracy with a bright line, such as H than a weak one, for example, the [SII]6731 line. In some cases, it is necessary to bin up a weak line in the dispersion direction, as we have done to varying degrees for the [O I] doublet and the [SII]6731 line, to achieve sufficient signal to noise ratio. Note that we sometimes use different binning factors for the continuum, in comparison with the line, so as to achieve a similar signal to noise ratio in both. This allows us to have comparable offset errors in both components, and to define the common 1 error lines shown in Fig. 1. As can be seen from the plots, the typical limiting offset that we can measure in the spatial direction (3) is around 30 mas. This corresponds to 4.5 au at the distance to the Ophiuchi cloud.
Echelle spectroscopy
The high resolution spectra of Oph 102 were taken with the UV-visual Echelle Spectrograph (UVES) on the European Southern Observatory’s 8 m Kueyen Telescope, one of the telescopes in the Very Large Telescope (VLT) suite, in May 2003. A total of three 45 min exposures of the target were made, together with a series of flats and biases as well as an observation of an arc lamp for wavelength calibration. The slit was orientated north-south and had a width of 1 ″while the seeing was 065. The central wavelength was set at 580 nm, giving a spectral range of 450-680 nm. Only the red part of the spectrum from 580 to 680 nm, however, was analysed. The pixel scale was 0182 and the spectral resolution R=40,000. The data were reduced using standard Image Reduction and Analysis Facility (IRAF) routines.
-
1.
Eislöffel, J., Mundt, R., Ray, T. P., & Rodríguez, L. F. Collimation and propagation of stellar jets. Protostars and Planets IV, University of Arizona Press. 815-840 (2000).
-
2.
Königl, A. & Pudritz, R. E. Disk winds and the accretion-outflow connection. Protostars and Planets IV, University of Arizona Press. 759-787 (2000).
-
3.
Basri, G. Observations of brown dwarfs. Ann. Rev. Astron. Astrophys. 38, 485-519 (2000).
-
4.
Natta, A., Testi, L., Comerón, F., Oliva, E., D’Antona, F., Baffa, C., Comoretto, G., & Gennari, S. Exploring brown dwarf disks in rho Ophiuchi. Astron. Astrophys., 393, 597-609 (2002).
-
5.
Pascucci, I., Apai, D., Henning, T., & Dullemond, C. P. The first detailed look at a brown dwarf disk. Astrophys. J., 590, L111-L114 (2003).
-
6.
Jayawardhana, R., Mohanty, S., & Basri, G. Evidence for a T Tauri phase in young brown dwarfs. Astrophys. J. 592, 282-287 (2003).
-
7.
Natta, A., Testi, L., Muzerolle, J., Randich,S., Comerón, F., & Persi, P. Accretion in brown dwarfs: An infrared view. Astron. Astrophys. 424 603-612 (2004).
-
8.
Comerón, F., Fernández, M., Baraffe, I., Neuhäuser, R., & Kaas, A. A. New low-mass members of the Lupus 3 dark cloud: Further indications of pre-main-sequence evolution strongly affected by accretion. Astron. Astrophys. 406, 1001-1017 (2003).
-
9.
Fernández, M. & Comerón, F. Intense accretion and mass loss of a very low mass young stellar object. Astron. Astrophys. 380, 264-276 (2001).
-
10.
Greene, T. P. & Young, E. T. Near-infrared observations of young stellar objects in the rho Ophiuchi dark cloud. Astrophys. J., 395, 516-528 (1992).
-
11.
de Geus, E. J., de Zeeuw, P. T., & Lub, J. Physical parameters of stars in the Scorpio-Centaurus OB association. Astron. Astrophys. 216, 44-61 (1989).
-
12.
Dougados, C., Cabrit, S., Lavalley, C., & Ménard, F. T Tauri stars microjets resolved by adaptive optics. Astron. Astrophys. 357, L61-L64 (2000).
-
13.
Hirth, G. A., Mundt, R., & Solf, J. Spatial and kinematic properties of the forbidden emission line region of T Tauri stars. Astron. Astrophys. Suppl. 126, 437-469 (1997).
-
14.
Masciadri, E., & Raga, A. C. Looking for outflows from brown dwarfs. Astrophys. J., 615, 850-854 (2004).
-
15.
Muzerolle, J., Calvet, N., & Hartmann, L. Emission-line diagnostics of T Tauri magnetospheric accretion. II. Improved model tests and insights into accretion physics. Astrophys. J. 550, 944-961 (2001).
-
16.
Takami, M., Bailey, J., Gledhill, T. M., Chrysostomou, A., & Hough, J. H. Circumstellar structure of RU Lupi down to AU scales. Mon. Not. R. Astron. Soc. 323 177-187 (2001).
-
17.
Whelan, E. T., Ray, T. P., & Davis, C. J. Paschen beta emission as a tracer of outflow activity from T-Tauri stars, as compared to optical forbidden emission. Astron. Astrophys. 417 247-261 (2004).
-
18.
Takami, M., Bailey, J., & Chrysostomou, A. A spectro-astrometric study of southern pre-main sequence stars. Binaries, outflows, and disc structure down to AU scales. Astron. Astrophys. 397 675-691 (2003).
-
19.
Bailey, J. Detection of pre-main-sequence binaries using spectro-astrometry. Mon. Not. R. Astron. Soc. 301 161-167 (1998).
Supplementary Information is linked to the online version of the paper at www.nature.com/nature but requests for supplementary materials can also be addressed to ewhelan@cp.dias.ie
Acknowledgements This work was supported in part by Science Foundation Ireland and the JETSET Marie Curie reserach training network.