Spitzer detections of new dust components in the outflow of the Red Rectangle
Abstract
We present Spitzer high spectral resolution IRS spectroscopy of three positions in the carbon-rich outflow of post-AGB star HD 44179, better known as the Red Rectangle. Surprisingly, the spectra show some strong unknown mid-infrared resonances, in the 13–20 m range. The shape and position of these resonances varies with position in the nebula, and are not correlated with the PAH features. We conclude these features are due to oxygen-rich minerals, located in a region which is believed to be predominantly carbon-rich. We provide possible explanations for the presence of oxygen-rich dust in the carbon-rich outflows. Simple Mg-Fe-oxides (Mg1-xFexO) are suggested as carriers of these unidentified features.
Subject headings:
stars: individual (HD 44179) — stars: AGB and post-AGB — circumstellar matter — dust, extinction — ISM: lines and bands1. Introduction
Ever after its initial discovery paper (Cohen et al. 1975), HD 44179, lovingly nick-named the Red Rectangle, has proven to be a truly enigmatic astrophysical object, and hosts many unique phenomena. HD 44179 is a post-Asymptotic Giant Branch (AGB) star with a stellar companion and surrounded by a circumbinary disk and a biconical nebula. In the optical, HD 44179 shows the spectral signature of the broad extended red emission (ERE; Schmidt et al. 1980; Van Winckel et al. 2002), of which the carrier is still unknown. Superposed on this are sharper emission features which may be the Diffuse Interstellar Bands normally seen in absorption (Scarrott et al. 1992). In the infrared the nebula exhibits remarkable evidence of a mixed chemistry: spectroscopy obtained with the Infrared Space Observatory (ISO), shows the presence of both oxygen-rich dust, in particular silicates, and carbon-rich components in the form of PAHs (Waters et al. 1998). The authors suggest that the oxygen-rich dust predominantly resides in the disk, while narrow band imaging shows that the PAH emission is extended and follows the outflows (Bregman et al. 1993; Sloan et al. 1993). The beautiful optical images obtained with the Hubble Space Telescope (Cohen et al. 2004) show that the morphology of the nebula is far from homogeneous. Regularly spaced brightness enhancements exist, perhaps related to the gas or dust density in the outflow. The ISO spectroscopy presented by Waters et al. (1998) lacks the spatial resolution to show any correlation between the density enhancements seen in the Hubble images and the chemical composition. In this work, we report Spitzer Space Telescope observations of the Red Rectangle, to study spatial chemical variations in the outflow.
2. Observations and data reduction
2.1. Observations
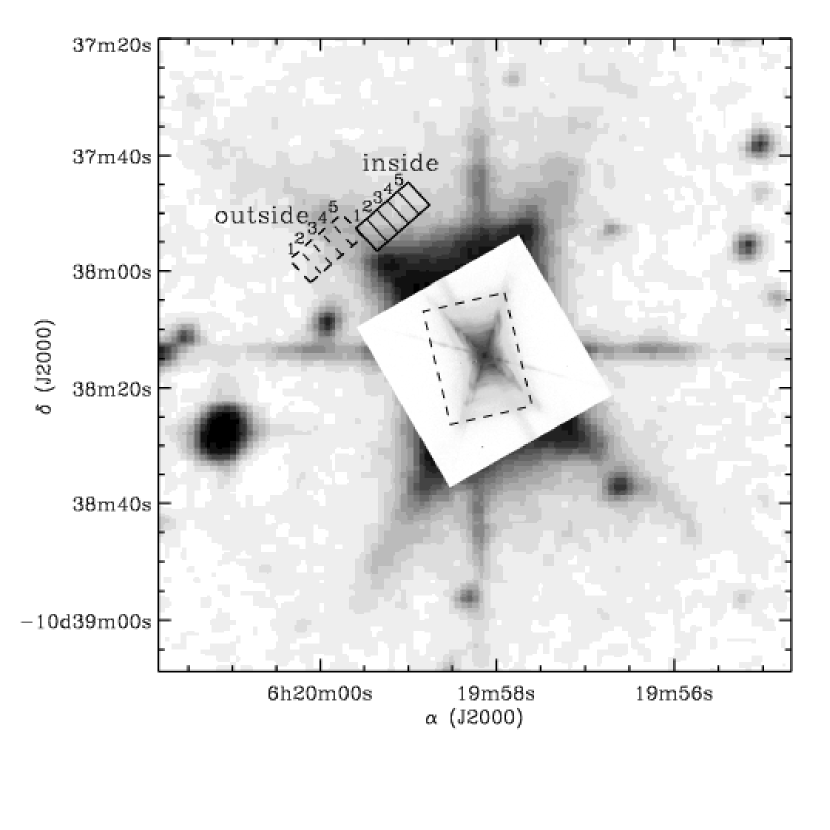
We used the InfraRed Spectrograph (IRS; Houck et al. 2004) on Spitzer (Werner et al. 2004a) to obtain high resolution spectroscopy of some positions in the outflow of the Red Rectangle. The observed regions in the outflow are about 30′′ away from the central source, to avoid saturation by the central binary and its direct environment. Here we report the first results obtained with the Short High (SH) module of the IRS in two lines-of-sight in the nebula; a full description of the Spitzer data will be presented in a forthcoming paper (Markwick-Kemper et al. in prep.). The first slit position probes the region just outside the biconical X, while the second one probes inside the biconical region (Fig. 1). The coordinates of these slit positions are = 61959.94, = 10o37′56.0′′ (J2000) and = 61959.18, = 10o37′50.5′′ (J2000), respectively. At both these positions we observed 2 cycles of 30 seconds. The SH module covers the 10.0–19.5 m wavelength range, with a spectral resolution of .
2.2. Data reduction and calibration
The spectra were reduced using the smart package (Higdon et al. 2004). We performed our data reduction on the products of pipeline version S9.5. We worked with the droopres images, which is the least processed product available to the observer. The last few processing steps of the pipeline were repeated off-line and adjusted to the needs of our observations: First, we divided the droopres images by the flatfields, to get the equivalent of the Basic Calibrated Dataproduct (BCD). We applied S10.0 flatfields, which yielded less noisy results, to the S9.5 droopres data; while no S10.0 droopres data were distributed to the observers. Subsequently, full aperture extraction using smart was performed on these images, using the flux conversion and other calibration files provided by the Spitzer Science Center (SSC). Bad pixels were removed by hand. Finally, where the orders were overlapping in wavelength coverage we cut off the band edges according to the order optimalization provided by the SSC. In addition to the full aperture extraction, our data was sufficiently complex that performing sub-aperture extraction was necessary. This mode of extraction is not offered for the high-resolution modules in the standard smart version, however, modified the full-aperture extraction routine to extract a specified fraction of the aperture and produce a spectrum of the flux for that sub-aperture. We approximated the size of the two high resolution slits as five pixel widths in the spatial direction by two pixel widths in the dispersion direction. We then extracted five sub-apertures of an entire column in the dispersion direction with a width of one pixels in the spatial direction. The sum of the five sub-apertures is equal to the original full aperture extraction.
Currently the IRS data calibration is optimized for point sources, and little attention has been given so far to the extraction of spectra from extended sources. Several problems arise when extended source calibration is attempted. First, no extended source flux conversion tables are available at this time. Using the flux conversion tables for point sources affects the absolute flux levels to some extent, although we expect the relative flux levels to be reasonably accurate. Second, it is not possible to use the measurements of the standards stars to calibrate the flux levels of extended sources, since it will cause fringing. A two-dimensional spectral response function is necessary to overcome this problem, but is not currently available. Finally, geometric effects should be taken into account, since the slit projection on the detectors covers only 25 pixels, and the point spread function is – depending on wavelength – about 3 pixels large, comparable in size to both the individual pixels as well as the entire slit. Smith et al. (2004) discuss the wavelength dependence of the point spread function, causing an additional slope in the spectra. For the high-resolution modules, the tilt of the slit with respect to the detector combined with the small number of pixels in the slit causes additional low-frequency fringing in the spectra. While the first geometric effect may be easily corrected, the second effect is fundamentally uncorrectable, since the spatial distribution of photons on a pixel is unknown.

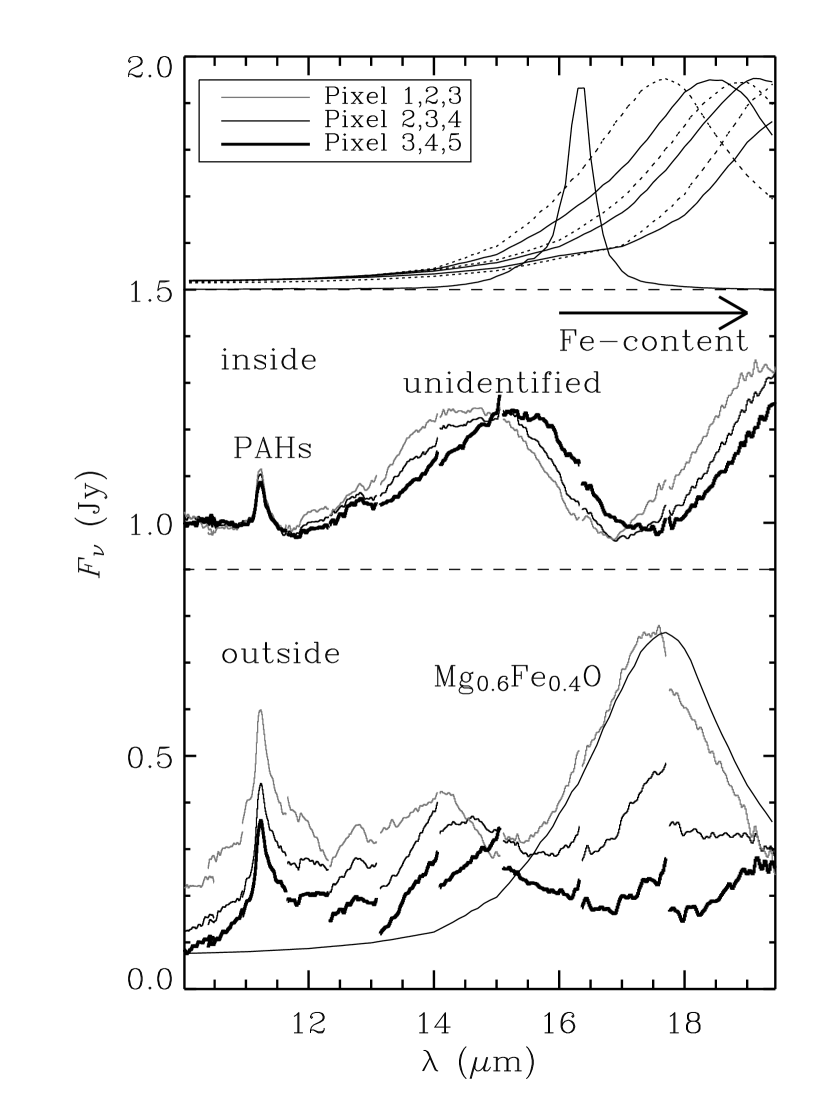
Fig. 2 shows the full aperture extracted spectra of the two lines-of-sight of interest, inside and outside the biconical region. The observed variation in spectral features between the two positions is very large, and variations occur even on the scale of the pixel size. In Fig. 3, we show how the spectra change within both apertures, by extracting 3 pixel wide sub-aperture spectra while stepping along the slit one pixel at a time.
3. Solid state features in the spectrum
3.1. PAHs?
It is straightforward to identify the features shortward of 13 m present in all lines-of-sight with the out-of-plane bending modes of the polycyclic hydrocarbons (PAHs; e.g. Hony et al. 2001), but these features are dwarfed by the spectral features detected at wavelengths longer than 13 m. These new resonances show some interesting and unique characteristics. First of all, the bands are very broad (several microns) and are very strong with respect to the dust continuum. Moreover, there is not a single set of well defined wavelengths at which these resonances occur, but instead the peak positions seem to vary spatially.
Interestingly, inspection of the ISO SWS spectroscopy shows no evidence for the presence of the newly detected features, perhaps because in ISO’s large beam many lines-of-sight are averaged, and individual contributions at various wavelengths gets averaged out to a broad, shallow plateau, or alternatively, the carrier of these features may only be present in detectable amounts at considerable distance from the disk, a region not probed by ISO’s line-of-sight (Fig. 1).
Here we will explore possible carriers for the new features. Although the outflow shows strong PAH emission at 11.2 m even at this large distance from the central star, we can rule out PAHs as the main carrier. Emission from PAHs in the 13-20 m wavelength range is known and is also variable (Hony et al. 2001; Van Kerckhoven et al. 2000). PAH emission from 15–20 m varies from a very broad plateau that perhaps can be disentangled into a number of completely separate resonances in the 15–20 m range (Van Kerckhoven et al. 2000; Werner et al. 2004b; Smith et al. 2004), which do not vary in peak position. Although these PAH bands fall in the correct wavelength range, they are much weaker than the 11.2 m PAH band (Peeters et al. 2004), and their FWHMs do not match. The low intensities and the fixed wavelengths at which the components of the PAH plateau are found, we rule out PAHs as a significant contributor to the resonances observed.
3.2. Mg-Fe-oxides
The extreme breadth of the resonances observed in the 13–20 m range is characteristic for solid state carriers, and the shift in the peak positions can be explained by variations in the temperature, composition, grain shape, grain size or lattice structure. The strong feature-to-continuum ratio dictates that the carrier has clean resonances without a strong continuum component, while the breadth implies an amorphous structure. Moreover, the opacities in the UV and optical need to be high enough so that the grains heat to sufficiently high temperatures, while the band strength in the material needs to be strong enough so that the amount of dust required to explain the feature does not violate abundance constraints.

Although it is believed that the outflows of the Red Rectangle are dominated by carbon-rich components, the features from 13–20 m show this picture is incomplete. Simple Mg-Fe-oxides are a possible carrier for these new features. In Fig. 3 the spectra from the region outside the biconical outflow are compared to a few Mg-Fe-oxide minerals calculated from optical properties measured by Henning et al. (1995). Indeed, peak strength and width are easily fitted, while the peak position suggests that a composition slightly more Mg-rich than Mg0.6Fe0.4O is likely. The situation inside the biconical region seems quite different. There are two clear differences; a distinct band centered near 15 m and a strong rise starting near 17 m. Interestingly, features of both bands, such as peak position and onset of the rise, shift as a function of position in the slit, and the shift seems correlated. This is consistent with a changing Fe-content in a relatively Fe-rich oxide. Using the correlation between composition and peak position for spherical grains (Fig. 4) it is possible to constrain more precisely the compositions of the oxides. We find that the oxides inside the biconical region have an Fe-content Mg<0.27Fe>0.73O, while the oxides outside the biconical region have a more Mg-rich composition of Mg0.74Fe0.26O.
Taking the Mg-Fe oxides as an example, we determine that oxide grains with a grain size of 0.1 m heat up to about 75 K at 30′′ of the central star, using , K, pc (Men’shchikov et al. 2002) and assuming no extinction toward the central star. To account for the observed flux levels in the features a dust mass of in the form of Mg-Fe-oxides is required in the aperture of each of the slit positions, an amount which seems large. The distance of 710 pc derived by Men’shchikov et al. (2002) might be an overestimation (see e.g. Jura et al. 1997; Hobbs et al. 2004), which would affect the derived dust masses considerably. For a distance of 500 pc for instance, the dust can be heated to 150 K at 30′′, and an oxide mass of only g, which is comparable to the mass of our moon, is needed in each aperture to account for the observed emission features.
3.3. The 13–17 m band
The strong feature at 13–17 m remains unidentified. However, because the peak position shifts with the change in onset of the feature longward of 17 m we conclude that the two carriers are related, and that perhaps the 13–17 m feature is caused by a mixture of Mg-Fe-oxides with another material. A good candidate are spinels (MgAl2O4), which have features in this wavelength range (Fabian et al. 2001). Their UV/optical opacity is too low to provide enough grain heating to explain the observed flux levels on their own, but when they are in thermal contact with oxides, the spinels may get warm enough to explain the observed flux level, while the changing Fe-content still explains the shift in peak position.
4. Discussion
The detection of new mid-infrared features in the bipolar outflow of HD 44179 is surprising. These features are carried by oxygen-rich minerals, possibly including simple Mg-Fe-oxides. Previously it was argued that the nature of the chemistry in these outflows is carbon-rich, while the dust in the circumbinary disk is oxygen-rich (Waters et al. 1998). Independently obtained spatially resolved ground-based observations of the PAH features in the infrared support this view (e.g. Kerr et al. 1999; Song et al. 2003; Miyata et al. 2004). Our work, along with the recent suggestion of small PAHs in the circumbinary disk (Vijh et al. 2005), indicate that the chemical distribution to the Red Rectangle may be more complicated than previously thought; both the disk and the outflow are not strictly oxygen-rich or carbon-rich, and apparently mixed chemistry environments occur in both components of the system. There are clearly different episodes in mass ejection (Cohen et al. 2004) and these may be connected to changes in the chemical composition.
The origin of the oxygen-rich dust in the outflow of HD 44179 remains speculative at best. It is possible that the oxides found in the outflow are remnants of an earlier, circumstellar mass loss phase, which is currently being overtaken by the bipolar outflow. Simple oxides are found in the low density winds of semi-regular variables and early type Miras (Posch et al. 2002), likely progenitors of a system like the Red Rectangle. These stars are known to develop a outflow velocity which is significantly lower than what is seen in later stages of the mass loss phase (e.g. Knapp & Morris 1985). An alternate explanation is that the oxygen-rich dust found in the bipolar outflow originate from the circumbinary disk. Interaction between the stellar wind and the disk may have eroded the disk and the wind may have dragged some of the disk material along in the collimated outflow directions. In this interaction, the oxygen-rich dust grains from the disk (predominantly silicates; Waters et al. 1998) may have partially or completely evaporated, and recondensed high above the disk. When recondensation occurs, the density will have dropped considerably, and the formation of significant amounts of anything beyond the simplest condensates may have been difficult, which could explain why the oxides are dominating the spectroscopy.
Of course, whether Mg-Fe-oxides are indeed the carriers of these newly discovered oxygen-rich dust features remains to be seen, and further studies of the spectral appearance and spatial distribution of these features is required to further establish the nature of the dust.
References
- Bregman et al. (1993) Bregman, J. D., Rank, D., Temi, P., Hudgins, D., & Kay, L. 1993, ApJ, 411, 794
- Cohen et al. (1975) Cohen, M., Anderson, C. M., Cowley, A., et al. 1975, ApJ, 196, 179
- Cohen et al. (2004) Cohen, M., Van Winckel, H., Bond, H. E., & Gull, T. R. 2004, AJ, 127, 2362
- Fabian et al. (2001) Fabian, D., Posch, T., Mutschke, H., Kerschbaum, F., & Dorschner, J. 2001, A&A, 373, 1125
- Henning et al. (1995) Henning, T., Begemann, B., Mutschke, H., & Dorschner, J. 1995, A&AS, 112, 143
- Higdon et al. (2004) Higdon, S. J. U., Devost, D., Higdon, J. L., et al. 2004, PASP, 116, 975
- Hobbs et al. (2004) Hobbs, L. M., Thorburn, J. A., Oka, T., et al. 2004, ApJ, 615, 947
- Hony et al. (2001) Hony, S., Van Kerckhoven, C., Peeters, E., et al. 2001, A&A, 370, 1030
- Houck et al. (2004) Houck, J. R., Roellig, T. L., van Cleve, J., et al. 2004, ApJS, 154, 18
- Jura et al. (1997) Jura, M., Turner, J., & Balm, S. P. 1997, ApJ, 474, 741
- Kerr et al. (1999) Kerr, T. H., Hurst, M. E., Miles, J. R., & Sarre, P. J. 1999, MNRAS, 303, 446
- Knapp & Morris (1985) Knapp, G. R. & Morris, M. 1985, ApJ, 292, 640
- Men’shchikov et al. (2002) Men’shchikov, A. B., Schertl, D., Tuthill, P. G., Weigelt, G., & Yungelson, L. R. 2002, A&A, 393, 867
- Miyata et al. (2004) Miyata, T., Kataza, H., Okamoto, Y. K., et al. 2004, A&A, 415, 179
- Peeters et al. (2004) Peeters, E., Mattioda, A. L., Hudgins, D. M., & Allamandola, L. J. 2004, ApJ, 617, L65
- Posch et al. (2002) Posch, T., Kerschbaum, F., Mutschke, H., Dorschner, J., & Jäger, C. 2002, A&A, 393, L7
- Scarrott et al. (1992) Scarrott, S. M., Watkin, S., Miles, J. R., & Sarre, P. J. 1992, MNRAS, 255, 11P
- Schmidt et al. (1980) Schmidt, G. D., Cohen, M., & Margon, B. 1980, ApJ, 239, L133
- Sloan et al. (1993) Sloan, G. C., Grasdalen, G. L., & Levan, P. D. 1993, ApJ, 409, 412
- Smith et al. (2004) Smith, J. D. T., Dale, D. A., Armus, L., et al. 2004, ApJS, 154, 199
- Song et al. (2003) Song, I.-O., Kerr, T. H., McCombie, J., & Sarre, P. J. 2003, MNRAS, 346, L1
- Van Kerckhoven et al. (2000) Van Kerckhoven, C., Hony, S., Peeters, E., et al. 2000, A&A, 357, 1013
- Van Winckel et al. (2002) Van Winckel, H., Cohen, M., & Gull, T. R. 2002, A&A, 390, 147
- Vijh et al. (2005) Vijh, U. P., Witt, A. N., & Gordon, K. D. 2005, ApJ, 619, 368
- Waters et al. (1998) Waters, L. B. F. M., Waelkens, C., van Winckel, H., et al. 1998, Nature, 391, 868
- Werner et al. (2004a) Werner, M. W., Roellig, T. L., Low, F. J., et al. 2004a, ApJS, 154, 1
- Werner et al. (2004b) Werner, M. W., Uchida, K. I., Sellgren, K., et al. 2004b, ApJS, 154, 309