Evidence for Spectropolarimetric Diversity in Type Ia Supernovae
Abstract
We present single-epoch, post-maximum spectropolarimetry of four Type Ia supernovae (SNe Ia) that span a range of spectral and photometric properties: SN 2002bf and SN 2004dt exhibit unusually high-velocity (HV) absorption lines. SN 1997dt is probably somewhat subluminous, and SN 2003du is slightly overluminous. We detect polarization modulations across strong lines in all four objects, demonstrating that all are intrinsically polarized. However, the nature and degree of the polarization varies considerably. Including all SNe Ia studied thus far, the following order emerges in terms of increasing strength of line-polarization features: ordinary/overluminous subluminous HV SNe Ia, with the strength of the line-polarization features increasing from in the slightly overluminous SN 2003du to in both of the HV SNe Ia in our study. The most convincing explanation for the line polarization of all objects is partial obscuration of the photosphere by clumps of intermediate-mass elements (IMEs) forged in the explosion; the polarization characteristics of the HV SNe Ia in particular effectively rule out a simple ellipsoidal asphericity as the root cause of their line polarization. That SNe Ia are separable into different groups based on their spectropolarimetric characteristics may help narrow down progenitor possibilities and/or explosion physics. In particular, the recently proposed gravitationally confined detonation model may provide an attractive explanation for many of the observed polarization characteristics of HV SNe Ia.
1 Introduction
The substantial homogeneity of Type Ia supernovae (SNe Ia), together with the fact that the peak luminosity of individual objects can be observationally determined through comparisons with well-calibrated samples of nearby SNe Ia, has propelled them to “gold standard” status among extragalactic distance indicators. Precise distance measurements out to have been made (Riess et al. 2001, 2004), revealing the surprising cosmological result that the expansion rate of the universe is currently accelerating (Riess et al. 1998a; Perlmutter et al. 1999); see Filippenko (2004, 2005) for extensive reviews. Although the progenitor systems have not yet been conclusively identified, the general consensus is that SNe Ia arise from carbon-oxygen white dwarfs (CO WDs) that accrete matter through some mechanism until they achieve a density of in their centers, leading to a runaway thermonuclear reaction that incinerates the star (Woosley & Weaver 1986). This occurs, coincidentally, when a CO WD’s mass is nearly the Chandrasekhar limit of 1.4 . Simulations of exploding CO WDs are able to reproduce the main spectral and photometric characteristics of SNe Ia (e.g., Leibundgut 2000, and references therein), lending theoretical support to this scenario.
However, many questions remain concerning the SN Ia progenitors and explosion mechanism. What is the nature of the “donor” that is responsible for providing the material that the WD accretes? Is there more than one channel by which the accretion can take place? Where does the thermonuclear runaway begin inside the WD, and how does it propagate throughout the star? As with so many things, the “devil is in the details,” and there is a growing sentiment that the answers to these fundamental questions may come from careful study of the differences seen among SNe Ia, rather than from the similarities alone.
Spectropolarimetry offers the only direct probe of early-time SN geometry, and thus is an important diagnostic tool for discriminating among SN Ia progenitor systems and theories of the explosion physics. The essential idea is this: A hot, young SN atmosphere is dominated by electron scattering, which by its nature is highly polarizing. For an unresolved source that has a spherical distribution of scattering electrons, the directional components of the electric vectors of the scattered photons cancel exactly, yielding zero net linear polarization. Any asymmetry in the distribution of the scattering electrons, or of absorbing material overlying the electron-scattering atmosphere, results in incomplete cancellation, and produces a net polarization (see, e.g., Leonard & Filippenko 2005).
Initial broad-band polarimetry studies found SNe Ia to possess zero or, at most, very weak () intrinsic polarization (Wang et al. 1996), suggesting a high degree of symmetry for their scattering atmospheres. More recent spectropolarimetric studies capable of resolving individual line features, however, are revealing a complex picture, with both continuum and line polarization now convincingly established for at least a subset of the SN Ia population.
To date, three SNe Ia have been examined in detail with spectropolarimetry at early times: SN 1999by (Howell et al. 2001), SN 2001el (Kasen et al. 2003; Wang et al. 2003), and, most recently, SN 2004dt (Wang et al. 2005a). In this paper we present single-epoch spectropolarimetry of four SNe Ia: SN 1997dt, SN 2002bf, SN 2003du, and SN 2004dt, obtained about , 3, 18, and 4 days (respectively) after maximum light.
A particular motivation for this multi-object investigation is to attempt to link spectral and photometric peculiarities of individual SNe Ia with their spectropolarimetric characteristics. Accordingly, the four events span a range of properties: SN 1997dt is likely somewhat subluminous, SN 2002bf and SN 2004dt exhibit unusually high-velocity absorption lines (in the case of SN 2002bf, the highest ever seen in an SN Ia for the epochs considered), and SN 2003du is slightly overluminous.
This paper is organized as follows. We briefly review the present photometric, spectroscopic, and spectropolarimetric state of knowledge of SNe Ia in § 2, focusing particular attention on objects sharing characteristics with the SNe Ia included in our spectropolarimetric survey. We describe and present the spectropolarimetry in § 3; to assist in the classification, we also include optical photometry and additional spectroscopy for two of the events, SN 2002bf and SN 2003du. We analyze the data in § 4, and present our conclusions in § 5. Note that preliminary discussions of the spectropolarimetry of SN 1997dt and SN 2002bf have been given by Leonard et al. (2000b) and Filippenko & Leonard (2004), respectively.
2 Background
2.1 Photometric Properties of SNe Ia
Type Ia SNe typically rise to peak -band brightness in about 20 days, decline by about mag over the next days, and then settle into a nearly constant descent of 1.55 mag (100 day)-1 for the next year. However, it is now confirmed beyond doubt that deviations exist from the central trend; see, for example, Phillips et al. (1999). Some events rise and fall more slowly, producing “broader” light curves (e.g., SN 1991T), whereas others rise and fall more quickly, yielding “narrower” light curves (e.g., SN 1991bg). The width of the light curves near peak correlates strongly with luminosity, in the sense that broader light curves generally indicate intrinsically brighter objects (but see Jha et al. 2005, for exceptions), with a total spread of about a factor of sixteen in absolute peak -band brightness among the population (Altavilla et al. 2004).
The ability to individually determine the luminosity of SNe Ia through examination of their light-curve shapes has been the primary driver for cosmological applications. There are several photometric calibration techniques in common use that correlate the observed light-curve shape, or supernova color, with luminosity (see Wang et al. 2005b, and references therein). The simplest calibration technique involves measuring the decline in during the first 15 days after maximum -band brightness, . A typical value is mag, which corresponds to mag according to the calibrations of Hamuy et al. (1996). Underluminous, SN 1991bg-like objects yield values up to mag, while overluminous, SN 1991T-like objects go as low as mag (Altavilla et al. 2004). There is a continuum of values in between the two extremes.
For the two SNe with optical photometry presented in this paper, we shall use the “multicolor light-curve shape” method (MLCS; e.g., Riess et al. 1996), which has been revised (and hereafter referred to as MLCS2k2) by Jha (2002) and S. Jha et al. (in preparation) to include -band light curves from Jha et al. (2005), a more self-consistent treatment of extinction, and an improved determination of the unreddened SN Ia color. This method is based on determining (a dimensionless number related to magnitude that parameterizes the light-curve shape), (the time of -band maximum light), (the distance modulus for an assumed value of , here taken to be ), and (the visual extinction at ).
The mechanism that produces the dispersion in SN Ia luminosity is not known; present speculations range from different progenitor systems to differences in the explosion mechanism and flame propagation (e.g., deflagration, detonation, delayed-detonation, or, most recently, gravitationally confined detonation; see, respectively, Nomoto et al. 1984; Arnett 1969; Khokhlov 1991; Plewa et al. 2004). Some have further speculated that global asymmetries in the expanding ejecta may result in viewing-angle dependent luminosity (Wang et al. 2003). One observational fact that all theories must confront is that the most luminous SNe Ia have thus far only been seen in late-type galaxies; the faintest objects tend to prefer elliptical galaxies, but have also been found in spirals (e.g., Howell 2001; Benetti et al. 2005, and references therein).
2.2 Spectroscopic Properties of SNe Ia
Early-time spectra of SNe Ia (see Filippenko 1997 for a review) typically exhibit lines of intermediate-mass elements (IMEs), such as magnesium, silicon, sulfur, and calcium, with some contribution from iron-peak elements, especially at near-ultraviolet wavelengths. As time progresses, and the photosphere recedes deeper into the ejecta, lines of Fe come to dominate the spectrum. This spectral evolution suggests a burning front that incinerates some of the progenitor’s carbon and oxygen all the way to the iron peak deep inside the ejecta, but then leaves the outer layers only partially burned. It is interesting to note that overluminous SNe Ia show enhanced Fe features at early times, whereas subluminous ones show weak early-time Fe features.
At early times (e.g., from the date of maximum brightness, ), the spectra of typical SNe Ia evolve rapidly and with such uniformity that it is possible to determine the age of an event relative to the date of to within 2 days from a single spectrum alone (Riess et al. 1997; Foley et al. 2005). The spectroscopic peculiarities of subluminous and overluminous events currently preclude their “spectral feature ages” from being derived accurately through comparison with average SN Ia spectra. For instance, pre-maximum spectra of overluminous events lack the strong Si II absorption that is so prominent in normal and underluminous SN Ia spectra (Filippenko et al. 1992b).
Another point of distinction among SN Ia spectra comes from the blueshifts of the spectral lines. Increasing attention is being paid to a small but growing group of “high-velocity” (HV) SNe Ia, whose spectra around maximum light are characterized by unusually broad and highly blueshifted absorption troughs in many line features, indicating optically thick ejecta moving about 4000–5000 km s-1 faster than is typically seen for SNe Ia (Branch 1987; Benetti et al. 2005). Well-studied examples of HV SNe Ia include SN 1983G (Branch & van den Bergh 1993, and references therein), SN 1984A (Branch 1987; Barbon et al. 1989), SN 1997bp (Anupama 1997), SN 1997bq (Lentz et al. 2001, and references therein), SN 2002bo (Benetti et al. 2004), SN 2002dj (Benetti et al. 2004), and SN 2004dt (Wang et al. 2005a). Wang et al. (2005a) note that in a spectrum of one HV SN Ia, SN 2004dt, some line features do not possess abnormally high velocity, such as those identified with S II. Since two of our objects, SN 2002bf and SN 2004dt, are HV SNe Ia, we briefly review the salient features that are known about this class of objects.
The most thorough and recent study of the diversity of SN Ia expansion velocities is that of Benetti et al. (2005), who apply a statistical treatment to data from 26 SNe Ia and find that HV SNe Ia indeed make up a kinematically distinct group. Its members have normal peak luminosity (based on their values: mag), reside in all types of host galaxies (e.g., both ellipticals and spirals, but with a preference for later types), and have very strong Si II features. They are further distinguished by a large temporal velocity gradient, , where is defined to be the average daily rate of decrease of the expansion velocity between maximum light and the time the Si II feature disappears. HV SNe Ia appear to have similar photometric characteristics to ordinary Type Ia events, although there is some indication of subtle differences in their color evolution (Benetti et al. 2004).
Whether HV SNe Ia represent the extreme end of a continuum of more typical SNe Ia, or require a different explosion mechanism, progenitor system, or explosion physics, remains controversial. What is certain is that any model must have significant optical depth in the IMEs at high velocities at early times. Branch & van den Bergh (1993) originally proposed that HV SNe Ia may simply result from more energetic explosions. However, Benetti et al. (2004) show that the Fe nebular lines have velocities comparable to those of normal SNe Ia, which tends to weaken the argument for higher overall kinetic energy. There is also evidence from early-time spectra of SN 2002bo that HV SNe Ia possess very little unburned carbon in their outer layers, in contrast with more typical SNe Ia like SN 1994D (Benetti et al. 2004). The high velocities of the IMEs coupled with the lack of primordial carbon may indicate that burning to Si penetrates to much higher layers in HV SNe Ia than it does in more normal events. This is a feature of some delayed-detonation models, such as those studied by Lentz et al. (2001). However, Wang et al. (2005a) argue that a strong detonation wave is unlikely to generate the clumpy and asymmetrically distributed silicon layer that is inferred from pre-maximum spectropolarimetric observations of SN 2004dt. As another alternative, Benetti et al. (2004) propose that IMEs produced at deeper layers may simply be more efficiently mixed outward in HV SNe Ia than is typical. A prediction of this mechanism is that while the IME products of explosive carbon burning will be mixed in with the primordial C and O in the outer layers, the C and O should also be mixed inward within these events, and exist at lower velocities than are normally seen.
It is appropriate at this point to mention the recently proposed gravitationally confined detonation (GCD) model of Plewa et al. (2004), which stands as an intriguing alternative to the standard deflagration or delayed-detonation scenarios. The mechanism involves the slightly off-center ignition of a deflagration that produces a buoyancy-driven bubble of material that reaches the stellar surface at supersonic speeds, where it laterally accelerates the outer stellar layers. This material, gravitationally confined to the white dwarf, races around the star and, in 2 s, converges at a point opposite to the location of the bubble’s breakout, creating conditions capable of igniting the nuclear fuel and triggering a detonation that can incinerate the white dwarf and result in an energetic explosion.
Of interest to the present study is the recent work of Kasen & Plewa (2005), who investigate the spectral, and spectropolarimetric, consequences of the GCD model. They focus their investigation on the interaction of the expanding ejecta with an ellipsoidal, metal-rich extended atmosphere formed from the bubble of deflagration products (taken to be 57% Si, 27% S, 7.1% Fe, and 2.7% Ca, plus smaller amounts of other metals; see Khokhlov et al. 1993), and find that a dense, optically thick pancake of metal-rich material is formed at potentially large velocity on the side of the ejecta where the bubble emerged. For low atmosphere masses (e.g., resulting from a bubble of mass ), the pancake of material spans the velocity range 17,000–28,000 km s-1 and is geometrically detached from the bulk of the SN ejecta. This might explain the detached, high-velocity Ca II near-infrared (IR) triplet absorption seen in pre-maximum spectra of some SNe Ia (e.g., SN 2001el, see § 2.3.3). For larger bubble and, hence, atmosphere masses (), the absorbing pancake moves at lower velocities (e.g., 10,000–21,000 km s-1 for ) and could blend with the region of IMEs in the SN ejecta and potentially increase the blueshift of several of the spectral features. This could provide an orientation-dependent explanation for the origin of HV SNe Ia, whereby sight lines in which the pancake more completely blocks the photosphere produce the anomalously large velocities. The spectropolarimetric consequences of this model are discussed in § 2.3.1.
2.3 Spectropolarimetric Properties of SN Ia
2.3.1 Supernova Polarization Mechanisms
The first definitive proof that some SNe are polarized came from observations of the Type II SN 1987A (Cropper et al. 1988), which exhibited a modest temporal increase in continuum polarization during the photospheric phase, as well as sharp polarization modulations across strong P-Cygni flux lines (Jeffery 1991b). While intrinsic polarization has now been established in over a dozen SNe (for recent reviews, see Wheeler 2000; Filippenko & Leonard 2004; Leonard & Filippenko 2005), including at least three SNe Ia, the exact origin of both continuum and line polarization remains controversial.
There are essentially two mechanisms by which supernova continuum polarization is thought to be produced: (1) a globally aspherical photosphere and electron-scattering atmosphere (e.g., Shapiro & Sutherland 1982; Höflich 1991; Jeffery 1991a; Leonard et al. 2000a; Wang et al. 2001), and (2) ionization asymmetry produced by the decay of asymmetrically distributed radioactive , perhaps flung out into (Chugai 1992; Höflich et al. 2001) or beyond (Kawabata et al. 2002; Leonard et al. 2002a) the expanding ejecta in clumps. The simplest, and most well-studied, globally aspherical geometry is that of an ellipsoid, and we shall make frequent reference to the “ellipsoidal model” in the following discussion. In the second model, in which an ionization asymmetry is present, continuum polarization is generated by light from the (either spherical or aspherical) photosphere scattering off of asymmetrically distributed free electrons that exist in clouds surrounding clumps of radioactive . Variations on both of these polarization mechanisms are also possible. For instance, an aspherical distribution of could also result in SN polarization by providing an asymmetry in a source of optical photons (produced by the thermalization of -rays) relative to the scattering medium.
To explain polarization modulations seen across spectral lines, it is important to differentiate between the emission peaks and blueshifted absorption troughs that are characteristic of P-Cygni profiles in total-flux spectra of SNe. Line peaks have usually been assumed to consist of intrinsically unpolarized photons. This is because although resonance scattering by a line is an inherently polarizing process (Jeffery 1991a), directional information for scattered photons is lost in an SN atmosphere since the timescale for randomizing collisional redistribution of the relative level populations within the fine structure of the atomic levels of a line transition is much shorter than the characteristic timescale for absorption and reemission in a line (Höflich et al. 1996). The assumption of intrinsically unpolarized emission lines is also commonly used to derive the interstellar polarization (ISP; § 2.3.2). Note, though, that if ionization asymmetry exists above the photosphere (from, e.g., clumps of radioactive ), then even intrinsically unpolarized emission-line photons may become polarized by electron scattering within the SN atmosphere.
For SNe Ia, line-blanketing, due largely to Fe, is particularly severe at wavelengths below 5000 Å, where theoretical models (Howell et al. 2001) suggest that nearly complete depolarization of any “continuum” light may be assumed. Conversely, the broad spectral region Å is largely devoid of line opacity (Kasen et al. 2004; Howell et al. 2001), at least near maximum light, and thus may give a good indication of true continuum polarization level.
The explanation of polarization changes in absorption troughs is controversial. One well-studied hypothesis, which follows logically from the ellipsoidal model, is that selective blocking of more forward-scattered and, hence, less polarized, light in P-Cygni absorption troughs results in trough polarization increases (Jeffery 1991a; Leonard et al. 2000b, 2001), potentially producing “inverted” P-Cygni polarization profiles when coupled with emission peak depolarization. Some SN modelers have claimed that this “geometrical dilution” mechanism, however, is rather poor at polarizing SN Ia light, and that polarization decreases should actually be seen in absorption troughs, since much of the light reaching the observer in those spectral regions has been absorbed and reemitted by the line (Howell et al. 2001).
A key point is that, in either case, to produce line trough polarization changes under the ellipsoidal model, some continuum polarization must exist. In fact, Leonard & Filippenko (2001) show that the strength of a line trough polarization feature can be used to place a lower bound on the true intrinsic continuum polarization level under the ellipsoidal model according to
| (1) |
where is the interpolated value of the continuum flux at the location of the line trough, is the total flux at the line’s flux minimum, and is the total polarization change observed in the line trough. Thus, a critical test of the ellipsoidal model is to see whether the continuum polarization observed in the spectral region 6800–7800 Å is sufficient to explain observed line trough polarization changes. Lack of significant continuum polarization in an object with strong line features argues against the ellipsoidal model. An additional prediction is that no rotation of the polarization angle (PA) should be seen across the line, since the continuum and line-forming regions share the same geometry.
A final way to produce a polarization change in a line trough is through asymmetry in the distribution of elements in the ejecta material located above the photosphere along the line-of-sight (l-o-s), hereafter referred to as the “clumpy ejecta” model. Asymmetry in the distribution of material with significant optical depth may unevenly block the underlying photospheric light, thereby producing a net polarization change and/or PA rotation in a line trough, even when the photosphere is spherical. The GCD model discussed in § 2.2 provides a natural mechanism by which to generate line-trough polarization through this model, since it predicts an optically thick pancake of high-velocity, metal-rich material overlying the photosphere on the side in which the bubble emerged. In particular, if the GCD model provides the correct mechanism by which to produce HV SNe Ia, then polarization changes in the absorption troughs of the strong, HV metal lines in these objects should be particularly pronounced since the l-o-s necessarily intercepts a substantial fraction of the pancake.
For SNe Ia, an interesting alternative to the simple ellipsoidal model for producing both line and continuum polarization is presented by Kasen et al. (2004), who explore the polarization consequences of a conical hole in the ejecta due to the interaction with a companion star, which we shall refer to as the “ejecta-hole” model. By considering various viewing angles and hole sizes, Kasen et al. (2004) demonstrate that both continuum and line polarization and PA changes can be generated. In general, viewing angles almost directly down the hole yield low continuum polarization with polarization increases in strong line troughs, whereas sight lines more nearly perpendicular to the hole result in larger continuum polarization (prominently seen in the spectral region 6800–7800 Å) and “inverted P-Cygni” line polarization profiles; this latter case is nearly indistinguishable from the predictions of the simple ellipsoidal model.
Ionization asymmetry is also capable of generating both continuum polarization as well as PA and polarization level changes through line features, since both continuum and line photons will scatter off of concentrations of free electrons in (or beyond) the ejecta. An impressive example of this mechanism potentially being at work is given by Chugai (1992) for the case of SN 1987A, in which the spectropolarimetry data, as well as asymmetries in the flux line profiles, are convincingly reproduced by the effects of two clumps of in the far (receding) hemisphere of the ejecta.
2.3.2 Removing Interstellar Polarization
A problem that plagues interpretation of all SN polarization measurements is proper removal of the ISP. Since directional extinction resulting from aspherical interstellar dust grains aligned by some mechanism along the l-o-s to an SN can contribute a large polarization to the observed signal, an attempt must be made to remove it prior to analyzing SN spectropolarimetry data. This is notoriously difficult, although a number of different techniques have been advanced over the years, which we here summarize.
An excellent way to derive Galactic ISP is through observations of distant, intrinsically unpolarized, “probe stars” close to (within 0.5) the l-o-s to the SN (e.g., Leonard et al. 2002a, b). Deriving the total ISP, which includes the contribution from dust in the host galaxy, however, is more difficult.
The most basic technique is to place limits on the ISP from reddening considerations. Since the same dust that polarizes starlight should redden it as well, it seems logical to expect a correlation between reddening and ISP. Because the alignment of dust grains is not total (or has multiple preferred orientations due to non-uniformity of the magnetic field along the l-o-s), and grains are probably only moderately elongated particles, it is not surprising that, through the analysis of thousands of reddened Galactic stars, only an upper bound on the polarization efficiency of Galactic dust can be derived (Serkowski et al. 1975): . However, the polarization efficiency of the dust in external galaxies is not well studied, and in one of the few investigations carried out to date, Leonard et al. (2002b) find compelling evidence for polarization efficiency well in excess of the empirical Galactic limit for dust in NGC 3184 along the l-o-s to the Type II-P SN 1999gi. It is not clear at this point whether meaningful constraints can thus be placed on the ISP of extragalactic SNe that are significantly reddened by host-galaxy dust. Nonetheless, total reddening arguments are still often used to set “reasonable” limits on the ISP.
Another method to get a handle on the ISP is to assume axisymmetry for any SN asphericity, a situation that reveals itself through a straight-line distribution of points when the spectropolarimetry is plotted in the – plane. If axisymmetry exists, the ISP is constrained to lie along the axis defined by the line (Howell et al. 2001). Its absolute value, however, is uncertain without additional input.
A more precise technique relies on the theoretical expectation that unblended emission lines consist of unpolarized light, and that any polarization observed in emission-line photons comes from the ISP (Jeffery 1991b; Tran et al. 1997; Wang et al. 1996; Leonard et al. 2001). This assumption is thought to be most valid at early times, when any concentrations are likely to be below the photosphere. Note, though, that to use this method, care must be taken to isolate the emission-line photons from the underlying continuum light (e.g., Tran et al. 1997), which may be intrinsically polarized.
A related method is to assume that a particular spectral region is intrinsically completely unpolarized, with all of the observed polarization therefore coming from ISP. Some empirical support exists that, in some objects, this may be the case for very strong emission lines (Kawabata et al. 2002; Leonard et al. 2002a; Wang et al. 2004). For SNe Ia in particular, it has sometimes been assumed that the far blue spectral region (e.g., typically Å) satisfies this criterion due to the effect of the heavy line-blanketing and multiple, depolarizing, line scatters, largely due to iron-group elements. This qualitative expectation is demonstrated quantitatively by Howell et al. (2001), who present model polarization spectra resulting from delayed-detonation models in realistic SN Ia atmospheres. More recently, Wang et al. (2005a) update this approach by choosing only specific spectral regions at blue wavelengths ( Å) that are not dominated by obvious individual line features in either flux or polarization for the ISP determination, rather than the arbitrary blue edge of the spectrum, as adopted by Howell et al. (2001). The central idea here is that while strong individual line features might impart their own polarization signature (e.g., through geometrical dilution in ellipsoidal models, or through blocking of the parts of the photosphere in clumpy-ejecta models), the spectral regions in between specific features probably decrease any effective continuum polarization by the numerous overlapping spectral lines at blue wavelengths.
Finally, if polarimetry is obtained after the electron-scattering optical depth of the atmosphere has dropped well below unity, then it may be adequate to assume the observed polarization to be due entirely to ISP across the whole spectrum (e.g., Wang et al. 2003).
Improperly removed, ISP can increase or decrease the derived intrinsic polarization, and it can change “valleys” into “peaks” (or vice versa) in the polarization spectrum. Since it is so difficult to be certain of accurate removal of ISP, it is generally safest to focus on (a) temporal changes in the polarization with multiple-epoch data, (b) distinct line features in spectropolarimetry having high signal-to-noise ratio (S/N), and (c) continuum polarization unlike the characteristic “Serkowski-law” wavelength dependence imparted by dust (e.g., Whittet et al. 1992).
2.3.3 Previous SN Ia Polarimetry Studies
Evidence for intrinsic polarization in SNe Ia was initially difficult to find, as the first investigations detected only marginally significant polarization among normal-brightness events observed near maximum, % (e.g., Wang et al. 1996, 1997). Broad-band polarimetry of one overluminous event observed over a month after maximum also found no intrinsic polarization down to a level of (Wang et al. 1996). Significant advances have been made in the last few years. Leonard et al. (2000b) reported the first convincing, albeit weak, features in the polarization of an SN Ia, SN 1997dt, which was likely a subluminous event; these data are presented and analyzed in more detail in the present study.
The first thorough spectropolarimetric study of an SN Ia is that by Howell et al. (2001). In spectropolarimetry obtained at maximum light, the subluminous SN 1999by exhibits a polarization change of 0.8% from 4800 Å to 7100 Å, and a sharp polarization modulation of 0.4% across the strong Si II absorption. These features are explained within the context of an ellipsoidal model with a global asphericity of 20%, observed equator-on. This physical picture was achieved by assuming the ISP to be the observed polarization at the blue edge of the spectrum, which was about Å. With this choice of ISP, the inferred intrinsic polarization rises from to about from blue to red, with a sharp depolarization from to near across the Si II feature. An argument supporting both the ellipsoidal model as well as the ISP choice is that after ISP removal the PA becomes nearly independent of wavelength. Howell et al. (2001) note, on the other hand, that a wavelength-independent PA also results if one assumes the ISP to be the observed polarization of the far red edge of the spectrum; in this case, the polarization modulation across the Si II becomes a polarization increase. Such a scenario could result from selective blocking of forward-scattered light, as described in § 2.3.1. However, Howell et al. (2001) find the theoretical arguments supporting the former ISP to be more compelling. With this ISP, the redward rise in intrinsic polarization is attributed to the decreasing importance of line opacities, and the increased influence of continuum electron scattering at longer wavelengths. The depolarization across the Si II absorption is also attributed to the depolarizing effect of line scattering. Despite the detection of intrinsic polarization for SN 1997dt and SN 1999by, their unusual (subluminous) nature nevertheless left some doubt about intrinsic polarization in normal SNe Ia.
That doubt has recently been put to rest with the work of Kasen et al. (2003) on SN 2001el. For this normal-luminosity event, the percent polarization changed from blue to red by 0.4% in spectropolarimetry obtained 1 week before maximum brightness. However, the extraordinary feature here is the existence of distinct high-velocity Ca II near-infrared (IR) triplet absorption ( = 18,000–25,000 km s-1) in addition to the usual, lower-velocity Ca II feature. A similar, but much weaker, high-velocity feature had been previously observed in SN 1994D, and perhaps in other SNe Ia as well; the number of pre-maximum spectra covering the near-IR spectral range is small. The polarization is seen to change dramatically in this feature, by 0.4%. The Ca II near-IR feature is examined by Kasen et al. (2003) in an elegant study, which concludes that it is likely due to photospheric obscuration by a clumped shell of high-velocity material. Using multi-epoch data, Wang et al. (2003) demonstrate that the nature of the polarization changes over the course of two weeks following this early epoch, becoming nearly undetectable a week after maximum brightness, further solidifying the case for intrinsic polarization at early times. Although not commented on by either study, it appears that the Si II line also shows a polarization modulation in the earliest epoch, and with a different PA from the Ca II near-IR feature. Although it does not affect the main results, a cautionary note on the difficulty of ISP determination is set by the fact that the two studies arrive at quite different values: Kasen et al. (2003) derive an ISP of very nearly by assuming the blue edge of the spectrum to be unpolarized, whereas Wang et al. (2003) obtain an ISP of 0.6% by attributing the observed polarization days after maximum light, when SN 2001el is argued to be in the nebular phase, entirely to ISP.
Most recently, Wang et al. (2005a) analyze a single epoch of pre-maximum spectropolarimetry of SN 2004dt, an HV SN Ia for which an ISP of and is derived from the observed polarization of a handful of narrow, blue spectral regions in which no single spectral feature dominates in the total-flux spectrum. This results in rather low continuum polarization, , but very strong modulations across spectral lines. The polarization spikes reach in the deep troughs due to Si II and ; lesser peaks are observed in features identified with Mg II , a blend of Si II and Fe II , and the Ca II near-IR triplet. All line polarization has similar directional behavior in the – plane, suggesting a common origin. Interestingly, whereas other strong line features in the total-flux spectrum are characterized by strong polarization modulations, O I shows no polarization signature. These features are explained in terms of optically thick bubbles of IMEs, the result of partial burning, that are asymmetrically distributed within an essentially spherical oxygen substrate that remains from the progenitor. Note that Wang & Wheeler (1997) find polarization variation at a level of across the strong Si II feature of another HV SN Ia, SN 1997bp, in unpublished spectropolarimetry obtained near maximum light.
From this small sample, the observations thus far suggest that normal and, perhaps, overluminous events are weakly polarized (), with subluminous ones possessing somewhat larger values (). HV SNe Ia have modest continuum polarization, but possess the highest line polarization of all, achieving polarizations of up to in the strongest features. We assess the robustness of these tentative trends with the present study of four SNe Ia.
2.4 The Type Ia Supernovae 1997dt, 2002bf, 2003du, and 2004dt
SN 1997dt was discovered (Qiao et al. 1997) by the Beijing Astronomical Observatory Supernova Survey (Li et al. 1996) on 1997 November 22.44 (UT dates are used throughout this paper) at an unfiltered magnitude of 15.3 in the Sbc galaxy NGC 7448. Images of the same field taken eight days earlier show no star at the position of the SN to a limiting unfiltered magnitude of about 18.5. An optical spectrum obtained immediately (0.06 days) after discovery showed it to be a Type Ia event (Qiao et al. 1997); a subsequent examination by Li et al. (2001b) estimates the age at discovery to be days relative to maximum light, which places the date of maximum at very roughly 1997 November 29. Tonry et al. (2003) report that SN 1997dt suffers from a host extinction of , the median of the values derived from MLCS and “Bayesian Adapted Template Match Method” (J. L. Tonry et al. 2005, in preparation; Tonry et al. 2003) analyses of its unpublished light curves. An MLCS2k2 fit (S. Jha et al., in preparation) suggests that it is subluminous, with (corresponding to a mag; see § 2.1), although there is a long shoulder of probability to lower values, indicating that there is a wide range of light-curve shapes that can fit the sparse number of photometric points (2 in , 3 in , and 2 in ). From a pre-maximum spectrum posted at the Center for Astrophysics’ Recent Supernovae Page,222http://cfa-www.harvard.edu/cfa/oir/Research/supernova/RecentSN.html we estimate (Si II) (see Nugent et al. 1995), which implies mag from the correlation derived by Benetti et al. (2004), also consistent with a somewhat subluminous classification.
SN 2002bf was discovered (Martin & Li 2002) by the Lick Observatory and Tenagra Observatory Supernova Searches (LOTOSS; Schwartz et al. 2000) on 2002 February 22.30 at an unfiltered magnitude of 17, very close to the nucleus of the Sb galaxy PGC 029953. An image of the same field taken twenty days earlier showed nothing at the position of SN 2002bf to a limiting unfiltered magnitude of 19. Optical spectra obtained on 2002 March 6.21 by Matheson et al. (2002) and on 2002 March 7.41 by Filippenko et al. (2002) identified it as a Type Ia event. Both groups noted that the expansion velocity derived from the absorption minimum of the Si II Å line was significantly greater than normal for an SN Ia near maximum light, indicating that it may be an HV SN Ia. A “spectral feature age” (Riess et al. 1997) of days was derived from the March 6 spectrum (Matheson et al. 2002). The MLCS2k2 analysis of the light curves presented in § 4.2.1 yields 2002 March as the date of maximum light, consistent with the age on March 6 derived by Matheson et al. (2002).
SN 2003du was discovered (Schwartz & Holvorcem 2003) by LOTOSS on 2003 April 22.4 at an unfiltered magnitude of 15.9 in the SBd galaxy UGC 9391. An image of the same field taken fifteen days before discovery showed nothing at the position of SN 2003du to a limiting unfiltered magnitude of 19. An optical spectrum obtained shortly thereafter, on 2003 April 24.06, identified it as a Type Ia event roughly two weeks before maximum light (Kotak et al. 2003). The MLCS2k2 analysis of the light curves presented in § 4.2.1 yields 2003 May as the date of maximum light, consistent with the earlier spectral age estimate. It also agrees with the epochs of maximum determined by the recent photometric studies of SN 2003du by Anupama et al. (2005) and Gerardy et al. (2004).
SN 2004dt was discovered (Moore & Li 2004) by the Lick Observatory Supernova Search (Filippenko et al. 2003) at an unfiltered magnitude of 16.1 in the SBa galaxy NGC 799 on 2004 August 11.48. An image of the same field taken ten days earlier showed nothing at the position of SN 2004dt to a limiting unfiltered magnitude of 18. Spectra taken within 2 days of discovery by Gal-Yam (2004), Patat et al. (2004), and Salvo et al. (2004) confirmed it to be an SN Ia before maximum light. Patat et al. (2004) noted that several absorption lines showed high expansion velocities, a result confirmed by the recent study by Wang et al. (2005a), suggesting that, like SN 2002bf, SN 2004dt is an HV SN Ia. A preliminary analysis of the light curves of SN 2004dt shows that maximum light occurred near 2004 August 20 (W. Li, personal communication). A series of Hubble Space Telescope (HST) UV spectral observations was obtained as part of program GO-10182 (P.I. Filippenko), and will be analyzed in a future paper.
3 Observations and Reductions
We obtained single-epoch spectropolarimetry of SN 1997dt, SN 2002bf, SN 2003du, and SN 2004dt on days 21, 3, 18, and 4 (respectively) after maximum light. We also obtained additional optical spectroscopy and photometry of SN 2002bf and SN 2003du. For SN 2002bf, our photometry samples to days from the time of maximum light, with one additional flux spectrum taken on day 9 after maximum. For SN 2003du, our ground-based photometry covers to days from maximum, with one additional epoch on day 436 taken using the High Resolution Channel (HRC) of the Advanced Camera for Surveys (ACS) on board HST. Five additional spectral epochs sample its development from days to after maximum.
3.1 Photometry
3.1.1 Ground-Based Photometry of SN 2002bf and SN 2003du
All ground-based photometric data were obtained using either the 0.76-m Katzman Automatic Imaging Telescope (KAIT; Filippenko et al. 2001; Li et al. 2003) or the Nickel 1 m reflector (Li et al. 2001a), both located at Lick Observatory. Figures 1 and 2 show KAIT images of PGC 029953 and UGC 9391, the host galaxies of SN 2002bf and SN 2003du, respectively. Also labeled in the KAIT images are the “local standards” in both fields that were used to measure the relative SN brightness on non-photometric nights. We obtained 12 epochs of Johnson-Cousins photometry (Johnson et al. 1966, for ; Cousins 1981, for ) for SN 2002bf, all taken with KAIT, and 38 epochs of photometry for SN 2003du, 33 of them taken with KAIT and five with the Nickel telescope. We also obtained three pre-maximum unfiltered observations of SN 2002bf with KAIT (approximating the band, see Li et al. 2003), and one additional epoch of photometry with KAIT of SN 2003du.
For the photometry we employed the usual techniques of galaxy “template” subtraction (Li et al. 2000, and references therein), point-spread function fitting (Stetson 1991, and references therein), and using “local standards” to determine the brightnesses of the SNe on non-photometric nights; in general, we closely followed the technique detailed by Leonard et al. (2002d). We note that the galaxy subtraction procedure for SN 2002bf was particularly challenging since it is only from its host galaxy’s center.
The absolute calibration of the SN 2002bf field was accomplished on the photometric nights of 2002 May 14 and 2004 March 17 with the Nickel telescope, and 2003 February 3 and 2004 March 18 with KAIT, by observing several fields of Landolt (1992) standards over a range of airmasses in addition to the SN 2002bf field. The absolute calibration of the SN 2003du field was similarly derived from data taken on the photometric nights of 2003 May 31, June 1, June 26, and August 27 with the Nickel telescope, and of 2003 May 22 and 2004 March 18 with KAIT. The color terms used to transform the filtered instrumental magnitudes to the standard Johnson-Cousins system are those of Foley et al. (2003). We list the measured magnitudes and the uncertainties, taken as the quadrature sum of a typical photometric error and the scatter of the photometric measurements from all of the photometric nights, of the local standard stars in Tables 1 and 2.
After deriving the magnitudes of the SNe based on a comparison with each of the local standards, we took the weighted mean of the individual estimates as the final standard magnitude of the SNe at each epoch in each filter. The results of our ground-based photometric observations are given in Tables 3 and 4 and shown in Figures 3 and 4. The reported uncertainties come from the quadratic sum of the photometric errors (reported by DAOPHOT) and the transformation errors. For SN 2002bf, the uncertainty produced by the difficult galaxy-subtraction process contributed the majority of the error on nights with low S/N.
3.1.2 Hubble Space Telescope Photometry of SN 2003du
We obtained HST images during the course of two orbits of a field of view centered on SN 2003du on 2004 July 15, 434 days after , with the ACS/HRC detector through filters F435W, F555W, F625W, and F814W (hereafter referred to as , respectively), as part of our Snapshot survey program (GO-10272; P.I. Li) to investigate the late-time photometric behavior and environment of nearby SNe. SN 2003du was detected in all images. Total exposure times in were, respectively, (data archive designation j8z441011/3011), (j8z442011/4011), (j8z441021/3021), and (j8z442021/4021).
To derive the HST photometry, we followed as closely as possible the procedure detailed by Sirianni et al. (2005), including correction for the effects of SN light contaminating the background region, aperture corrections, the “red-halo” effect (for the -band), and CTE degradation (Riess 2004). We translated the resulting instrumental magnitudes to the standard Johnson-Cousins system by using the coefficients and color corrections tabulated by Sirianni et al. (2005). The final results of our HST photometry are included in Table 4 and displayed in Figure 4.
3.2 Spectropolarimetry and Spectroscopy
We obtained single epochs of spectropolarimetry for SN 2002bf and SN 2003du on 2002 March 7 and 2003 May 24, respectively, with the Low-Resolution Imaging Spectrometer (Oke et al. 1995) in polarimetry mode (LRISp; Cohen 1996)333Instrument manual available at http://www2.keck.hawaii.edu/inst/lris/pol_quickref.html. at the Cassegrain focus of the Keck-I 10-m telescope. We observed SN 1997dt on 1997 December 20 with LRISp using the Keck II 10-m telescope, and SN 2004dt on 2004 August 24 with the Kast double spectrograph (Miller & Stone 1993) with polarimeter at the Cassegrain focus of the Shane 3-m telescope at Lick Observatory. We reduced the polarimetry data according to the methods outlined by Miller et al. (1988) and detailed by Leonard et al. (2001) and Leonard & Filippenko (2001).
The polarization angle offset between the half-wave plate and the sky coordinate system was determined by observing the following polarized standard stars from the list of Schmidt et al. (1992) and setting the observed -band polarization position angle (i.e., , the debiased, flux-weighted average of the polarization angle over the wavelength range 5050–5950 Å; see Leonard et al. 2001) equal to the cataloged value: BD (1997 December 20), BD (2002 March 7), and HD 161056 (2003 May 24). On the night of 2004 August 24, we averaged the polarization angle offsets derived from observations of three polarized standards from the Schmidt et al. (1992) list, HD 204827, BD , and HD 19820; the individual offsets were internally consistent to within . To check for instrumental polarization, the following null standards taken from the lists of Turnshek et al. (1990), Mathewson & Ford (1970), Schmidt et al. (1992), and Berdyugin et al. (1995), were also observed: HD 94851 (1997 December 20), HD 57702 (2002 March 7), HD 109055 and BD (2003 May 24), and HD 212311 (2004 August 24). All stars were measured to be null to within , which is also our estimate of the systematic uncertainty of a continuum polarization measurement made with either the Keck or Lick spectropolarimeters (e.g., Leonard et al. 2001).
Additional specifics of the observations of SN 2002bf taken on 2002 March 7, including an investigation of the potential impact of second-order light contamination and instrumental polarization (both shown to be minimal) in the setup used on this night, are given by Leonard et al. (2002a). Second-order light contamination is not a concern for our observation of SN 1997dt due to its limited spectral range. For SN 2003du, the use of a dichroic (D560) to split the beam near 5600 Å eliminates second-order light contamination on the red side. Our spectropolarimetric observation of SN 2004dt was taken in a setting that included the use of an order-blocking filter (GG455) to prevent contamination by second-order light at red wavelengths. Beyond 9000 Å, however, second-order contamination may exist, but for reasons similar to those discussed by Leonard et al. (2002a) we believe it to have minimal impact for this particular object.
To derive the total-flux spectra, we extracted all one-dimensional sky-subtracted spectra optimally (Horne 1986) in the usual manner. Each spectrum was then wavelength and flux calibrated, and was corrected for continuum atmospheric extinction and telluric absorption bands (Wade & Horne 1988; Bessell 1999; Matheson et al. 2000). With the exception of the spectropolarimetric observations of SN 1997dt and SN 2002bf, all spectra were taken near the parallactic angle (Filippenko 1982), so the spectral shape should be quite accurate. Table 5 lists the spectropolarimetric and spectral observations for all four SNe. Figures 5–8 show the observed spectropolarimetry data of the four objects, and Figures 9 and 10 show the complete series of spectra obtained for SN 2002bf and SN 2003du, respectively.
4 Analysis
4.1 Spectroscopy
Our spectrum of SN 1997dt, taken 21 days after maximum, shows typical features for an SN Ia at this phase (Fig. 5a). Similarly, our spectral sequence of SN 2003du (Fig. 10) closely follows the evolution of the normal-luminosity SN Ia 1994D (Patat et al. 1996; Filippenko 1997) in terms of the strengths and blueshifts of line features. This is consistent with the analyses of Anupama et al. (2005) and Gerardy et al. (2004), in which spectra taken before and shortly after maximum light were also examined. This convincingly establishes SN 2003du as a spectroscopically “typical” SN Ia (Branch et al. 1993).
As discussed in § 2.4, the spectra of both SN 2002bf and SN 2004dt are peculiar in one regard: the blueshifts of many of the spectral lines, most noticeably Si II , occur at significantly higher velocity than is typical for an SN Ia at this phase, and indicate that these are both HV SNe Ia.
For comparison, we have measured the velocities of the Si II line in a number of other HV SNe Ia from our database, along with the spectroscopically normal SN 1994D, the subluminous SN 1991bg (e.g., Filippenko et al. 1992a), and the overluminous SN 1991T (e.g., Filippenko et al. 1992b). We present the results in Table 6 and Figure 11, from which it is clear that both SN 2002bf and SN 2004dt belong to the class of HV SNe Ia; indeed, SN 2002bf is the most extreme HV SN Ia yet observed for its epochs. The figure also suggests that line velocity is not strongly correlated with luminosity, although the expansion velocity of the subluminous SN 1991bg is somewhat lower than typical values.
Figure 12 presents a spectral comparison near maximum light of three HV SNe Ia (SN 2002bf, SN 2002bo, and SN 2004dt) with the spectroscopically normal SN 1994D. The excessive blueshift of the Si II trough is obvious for the three HV SN Ia compared with SN 1994D. While it must be cautioned that the spectra span a range of ages of about five days near maximum light, a time when significant spectral development occurs, the blueshift differences are much greater than can be explained by age differences alone. In addition, the Si II line is significantly stronger in the HV SNe Ia compared with SN 1994D, with equivalent widths of Å compared with 100 Å for SN 1994D. Conversely, the O I absorption is relatively weaker in the HV SN Ia events, with equivalent widths of Å in the HV SNe Ia compared with Å for SN 1994D. The fact that the Si II line is significantly stronger in the HV SNe Ia sample, and the O I line relatively weaker, is consistent with the scenario in which a greater fraction of C and O is burned to IMEs in HV SN Ia than in more typical events; it also follows naturally from the GCD model, since the obscuring pancake is formed from the products of oxygen burning.
While HV SNe Ia share many spectral characteristics, it is clear that they also exhibit spectral diversity. For instance, whereas the absorption trough of the Ca II near-IR triplet is significantly blueshifted for SN 2002bf and SN 2002bo relative to SN 1994D ( and for SN 2002bf and SN 2002bo, respectively, compared with 10,900 km s-1 for SN 1994D, where we have assumed for the Ca II near-IR triplet, a value derived using the prescription given by Leonard et al. 2002c), it has a more normal blueshift ( km s-1) in SN 2004dt. The equivalent widths of the Ca II near-IR lines also show a suggestive trend, with both SN 2002bf and SN 2002bo having widths of Å, while both SN 2004dt and SN 1994D have equivalent widths of 100 Å. This may indicate that the explosive nucleosynthesis did not proceed up to Ca as far out in the atmosphere (or in the bubble in the GCD scenario) of SN 2004dt as it did in the other two HV SNe.
Finally, it is clear from Figure 12 that not all lines share the extreme velocities seen in the Si II feature. For instance, as first noticed by Wang et al. (2005a) in a pre-maximum spectrum of SN 2004dt, the S II “W” feature in the spectra of SN 2002bo and SN 2004dt indicates velocities comparable to those in SN 1994D; for SN 2002bf they are somewhat larger, but still not near the velocity of the Si II line. Wang et al. (2005a) propose that this may indicate that sulfur is more confined to the lower-velocity, inner region.
4.2 Photometry
4.2.1 Ground-Based Photometry
The results of the MLCS2k2 application to the photometry of SN 2002bf and SN 2003du are given in Table 7. For details of the MLCS2k2 procedure used, see S. Jha et al. (in preparation); an overview of the technique is provided by Riess et al. (2005). The MLCS2k2 analysis finds SN 2002bf to be of typical luminosity. SN 2003du is slightly overluminous, although its pre-maximum spectral evolution (Anupama et al. 2005) demonstrates that it is not a SN 1991T-like event, as the strength of the Si II feature is comparable to that seen in spectra of normal SNe Ia.
For SN 2002bf, occurred on 2002 March , which is days after discovery and 5 days before our filtered observations commenced. For SN 2003du, occurred on 2003 May , which is days after discovery, and the same day that our observations began. Our derived date of maximum light for SN 2003du agrees with those found by Anupama et al. (2005) and Gerardy et al. (2004) using independent data sets.
4.2.2 HST Photometry of SN 2003du
Late-time photometry (e.g., ) of SNe Ia exists for only a handful of objects (see, e.g., Milne et al. 2001, and references therein). From the small sample, there are two main features of note. First, SN Ia decline rates are typically much faster than the decay slope of of predicts. This decay mechanism is thought to be primarily responsible for powering the luminosity from the early nebular phase out to 1000 days for SNe of all types. Essentially, the decays release most of their energy in the form of -rays, which, given enough optical depth, can become trapped in the ejecta and Compton scatter off free electrons. The energetic electrons generate optical photons primarily through ionization and excitation of atoms, and the ejecta are transparent to these photons. A small portion (3.5%, see Arnett 1979) of the total decay energy comes in the form of positrons, which may deposit their kinetic energy in the ejecta and then annihilate with electrons, producing two -ray photons of energy . The steeper decline seen in the late-time photometry of SNe Ia has been explained by significant transparency of the ejecta to -ray photons (Milne et al. 1999) and positron escape (Milne et al. 2001).
A quantitative measure of the late-time decline is given by Cappellaro et al. (1997), who investigate how the decline from maximum to 300 days after peak brightness, denoted , correlates with intrinsic SN brightness as derived from the parameter. Although limited by small sample size (5 objects), they find a convincing correlation, with going from 6.7 mag to 8.4 mag as the sample runs from overluminous (SN 1991T) to subluminous (SN 1991bg) events, with the normal-brightness SN 1994D characterized by mag. A second feature that has thus far been seen in only two SN Ia events (SN 1991T and SN 1998bu; see Schmidt et al. 1994 and Cappellaro et al. 2001, respectively) is a sudden flattening of the late-time optical light curves, which has been attributed to the contribution of a light echo from foreground dust clouds.
Our photometric data from HST, taken days after , allow us to investigate the late-time photometric behavior of SN 2003du. From the inset of Figure 4, it is clear that SN 2003du, like all SNe Ia analyzed before it, declines significantly faster than the decay rate. In fact, we measure the average decay rate in (shown by Milne et al. 2001 to track the bolometric luminosity of an SN Ia quite accurately) of SN 2003du between our last two photometric epochs on days and to be . The slope also appears to have been rather constant throughout the period between our two last epochs, as indicated by the good agreement of the late-time data taken from Anupama et al. (2005) near day 300 and the decay slope determined from our data alone. Using the Anupama et al. (2005) data point and our estimate of (Table 7), we derive , which is most consistent with the values found by Cappellaro et al. (1997) for overluminous events. That SN 2003du may be somewhat overluminous was also suggested by its peak magnitude of mag, which is 0.17 mag brighter than the fiducial template used in the MLCS2k2 procedure (Table 2). There is no evidence from our data of any contribution to the SN brightness from a light echo, although we note that the major indications of additional contributions to the apparent brightness of SNe 1991T and 1998bu did not become obvious until epochs .
4.3 Reddening
4.3.1 Techniques to Estimate SN Ia Reddening
Accurate determination of SN reddening is crucial both for deriving intrinsic SN properties as well as interpreting spectropolarimetry, since the same dust that reddens SN light can also polarize it as discussed in § 2.3.2. When multi-band photometry is available, the MLCS2k2 technique can accurately estimate the total extinction (see Riess et al. 2005 for discussion). When this is lacking, other methods must be used.
Galactic extinction along the l-o-s is accurately estimated by the dust maps of Schlegel et al. (1998, hereafter SFD) to an estimated precision of 15%. For host-galaxy extinction, a rather crude approach, to which many investigators resort in the absence of photometry, is to employ the rough correlation found between the total equivalent width () of the interstellar (IS) Na I D doublet () and reddening (Barbon et al. 1990). The Barbon et al. correlation has been subsequently improved upon by Munari & Zwitter (1997), who derive a more precise relation that uses just the equivalent width of the Na I D2 () line. Both relations, however, warrant healthy degrees of skepticism since sodium is known to be only a fair tracer of the hydrogen gas column (especially in dense environments, where sodium may be heavily depleted; e.g., Cohen 1973), from which the dust column is then estimated. The dust-to-gas ratio also varies significantly among galaxies (e.g., Issa et al. 1990), and it could well be that in the case of SNe, circumstellar, rather than interstellar, dust is present, for which the dust-to-gas ratio (or the extinguishing properties of the dust itself) could be unusual. A final complication is that, at the resolution typical of most optical spectra, individual absorption components along the l-o-s, whose contributions should be considered separately to determine the total reddening, are blended into a single profile. In such situations, the Munari & Zwitter (1997) relation formally yields an upper limit to the reddening, and caution must be used since the derived value could seriously overestimate the actual reddening. Nonetheless, the Munari & Zwitter (1997) relation is still frequently used to get approximate reddening values, or upper limits, especially in the case of null detections of IS Na I D lines.
4.3.2 The Reddening of the Four SNe Ia
For SN 2002bf and SN 2003du we shall adopt the MLCS2k2 values of mag and mag (respectively) reported in Table 7 (for ). For SN 1997dt, Tonry et al. (2003) report a host-galaxy reddening value of mag (assuming ), the median of the values derived from MLCS2k2 and “Bayesian Adapted Template Match Method” analyses. The SFD dust maps predict mag for SN 1997dt, for a total estimate of mag.
Our spectrum of SN 1997dt also exhibits strong Na I D IS absorption at both the redshift of the host galaxy and the MW. The resolution of our spectrum, 5 Å (Table 5), while sufficient to deblend the Na I D doublet, is not fine enough to resolve the individual absorption components that likely contribute to the D1 and D2 profiles. For host-galaxy absorption, we measure Å, with Å and Å. This translates to mag from the Munari & Zwitter (1997) relation. For the MW, we measure Å, with Å and Å, yielding mag from the Munari & Zwitter relation. The values given by SFD and Tonry et al. (2003) are consistent with the upper limits derived from the sodium relation. The purported accuracy of the SFD Galactic reddening value and the upper limit set by the Munari & Zwitter relation for the host reddening would indicate an upper reddening limit of mag. This limit will prove to have important implications when we examine the spectropolarimetry of SN 1997dt in § 4.4.2. The fact that the Munari & Zwitter relation overpredicts the reddening for both the host galaxy and, especially, the MW, may indicate that multiple, unresolved components make up the IS line profiles. Given the upper reddening limit, we conclude mag for SN 1997dt.
For SN 2004dt, mag, and Wang et al. (2005a) report a range of to 0.2 mag from analysis of the color of their pre-maximum spectrum. However, they also note that SN 2004dt does not show noticeable Na I D IS lines at the redshift of NGC 799. We confirm the lack of Na I D lines in our spectrum as well, although its poor resolution (18 Å, see Table 5) makes deriving even an upper limit to the strength of the Na I D IS lines difficult. Formally, our procedure yields Å for host-galaxy Na I D, which translates to a predicted upper limit of mag. We thus confirm the discrepancy noted by Wang et al. (2005a) between the lack of IS sodium absorption and reddening inferred from other methods. It could be that the spectroscopic peculiarities of HV SNe Ia produce photometric irregularities that affect the general reddening relations. As mentioned in § 2.2, Benetti et al. (2004) do find photometric peculiarities, albeit minor, in their study of another HV SN Ia, SN 2002bo. However, since the Na I D relation, especially for the host galaxy, is also prone to error, we have no convincing way to decide between the two estimates. We thus take the simple average of the low and high reddening estimates, and incorporate the disparity into our final estimate’s uncertainty. This yields mag as our best reddening estimate for SN 2004dt.
4.4 Spectropolarimetry of Four SNe Ia
To summarize: SN 1997dt is likely a somewhat subluminous event that is thought to be reddened by mag, with an upper limit of mag. SN 2002bf and SN 2004dt are HV SNe Ia, with SN 2002bf being the most extreme example yet observed. Finally, SN 2003du is a slightly overluminous event that is minimally reddened. At maximum light, a previous subluminous event has been found to be moderately polarized (), whereas normal to overluminous examples have been less so (). The two HV SNe Ia that have reported polarization measurements show the greatest polarization features yet observed for any SN Ia type, with values approaching in the strongest lines of SN 2004dt (§ 2.3.3).
We now examine our single-epoch spectropolarimetry of SN 1997dt, SN 2002bf, SN 2003du, and SN 2004dt obtained on days 21, 3, 18, and 4, respectively, after maximum light. For each SN, we shall first discuss the observed polarization and then attempt to remove the ISP through the technique of Wang et al. (2005a), which assumes that spectral regions lacking strong individual flux or polarization features at blue wavelengths ( Å) are intrinsically unpolarized. Since the choice of the specific spectral regions to use for ISP determination is admittedly somewhat subjective, we shall be careful to point out how our conclusions would change with other ISP choices.
Following ISP removal and examination of the data in the – plane, we calculate the intrinsic polarization of the SN by rotating the – axes through a single angle, , that places the greatest degree of polarization change across the spectrum along the rotated axis. The angle by which the axes are rotated is determined through a uniform-weight, least-squares fit to the ISP-subtracted data in the – plane. The polarization degree measured along the rotated axis is then referred to as the rotated Stokes parameter (RSP; Tran 1995; Leonard et al. 2001), whereas that measured along the rotated axis is denoted URSP.444Note that RSP and URSP, as defined here, are identical to the Wang et al. (2001) definitions of the polarization along the “dominant” and “orthogonal” axes, and , respectively. That is, by definition, RSP shows polarization strength variation along the chosen polarization angle (i.e., the dominant axis), whereas the URSP shows polarization strength variation along the axis that is orthogonal to the dominant axis in the – plane. The main difference between our construction of the RSP in the observed polarization plots (Figures 5–8) and the ISP-subtracted data (Figures 15, 17, and 19) is that in the former the polarization angle about which the RSP is determined is a smoothly varying function of wavelength (i.e., it is the polarization angle, , smoothed over many bins; see Leonard et al. (2001) for more details on the procedure), whereas in the latter, RSP and URSP are determined with respect to a single, unchanging polarization angle. For consistency with spectropolarimetry work in other fields, as well as our own prior studies, we shall continue to use the RSP and URSP designations, rather than the and designations of Wang et al. (2001).
We shall then analyze the resulting spectropolarimetry within the context of the models described in § 2.3.1. By construction, the greatest degree of polarization change, especially from the continuum regions, should occur in the RSP. Examination of URSP is especially important in the line features, however, as it can be used to discriminate between the predictions of the ellipsoidal and clumpy-ejecta models. In particular, the simple ellipsoidal model demands the existence of a single value of capable of placing all line polarization changes along the RSP (i.e., URSP should show no polarization features).
4.4.1 Two HV SNe Ia: SN 2002bf and SN 2004dt
We begin by considering the spectropolarimetry of the two HV SNe Ia, SN 2002bf and SN 2004dt, which are displayed in Figures 6 and 8, respectively. Both objects show very low levels of observed polarization, with , for SN 2002bf and , for SN 2004dt, where and approximate the rest-frame -band polarization and polarization angle derived by calculating the debiased, flux-weighted averages of and over the interval 5050–5950 Å (see Leonard et al. 2001). The polarization of SN 2004dt may exhibit an upward trend with wavelength, increasing from about at blue wavelengths to 1.0% at the red edge ( Å); a similar but smaller trend exists in the data for SN 2002bf. Neither object shows significantly different polarization in the “continuum” region 6800–7800 Å from that observed in the heavily line-blanketed region below 5000 Å (§ 2.3.1), suggesting that the intrinsic continuum polarization is quite low for both objects.
The salient features of both data sets are the extraordinarily large polarization modulations (2%) across certain P-Cygni lines, most notably the Ca II near-IR triplet for SN 2002bf and the Si II line for SN 2004dt. Smaller features may be discerned across other lines in both objects.
Before attempting ISP removal, it is instructive to compare our SN 2004dt data with those obtained by Wang et al. (2005a) taken eleven days earlier, when the SN was about seven days before maximum light. The interval separating the two observations is one marked by rapid spectral and photometric evolution. For SN 2004dt, the velocity of the minimum of the high-velocity Si II line recedes by about (from to ), and the weaker, lower-velocity lines such as S II ( Å) decrease by about (from to ). Remarkably, in spite of the great changes that occur in the flux spectrum between the two epochs, we find the spectropolarimetry to be virtually unchanged. The overall polarization, in both magnitude and polarization angle, is consistent with the earlier epoch, and the detected line-polarization features, most notably those at Si II and the Ca II near-IR triplet, are also very similar. As with the Wang et al. data, our observations do not show significant polarization modulation across the important O I line, although this line is now much weaker in the total-flux spectrum than it was earlier. Weaker polarization features, which are clearly detected in the earlier epoch, are difficult to confirm in our lower S/N data, but our data are not inconsistent with the earlier measurements, within the errors.
As discussed in § 2.3.3, Wang et al. (2005a) explain the spectropolarimetry of SN 2004dt in terms of optically thick bubbles of IMEs that are asymmetrically distributed within an essentially spherical oxygen substrate that remains from the progenitor material. Wang et al. (2005a) further note that the polarization behavior of the high-velocity lines is similar to the low-velocity lines in the early epoch, implying that the structures that obscure the photosphere have great radial extent. Within this context, then, it may not be surprising that the polarization features have not evolved significantly between the two epochs, despite the great evolution of line velocity.
In order to directly compare the spectropolarimetry of SN 2002bf and SN 2004dt with each other, we must attempt to remove the ISP. To establish the ISP, we apply the technique of Wang et al. (2005a) and choose the spectral regions indicated in Figures 6a and 8a. For SN 2002bf, this yields , or ISP at at an assumed peak wavelength of the ISP of Å. For SN 2004dt we derive , which is within the uncertainty of the ISP found by Wang et al. (2005a) through this same approach, . In order to facilitate direct comparisons between our data and those of Wang et al. (2005a), we shall adopt their ISP value for our study of SN 2004dt as well.
After removal of the small amount of ISP for SN 2002bf, we derive a best-fitting axis with (Fig. 13), about which we calculate the intrinsic RSP and URSP shown in Figure 15. In a similar way, for SN 2004dt we derive a best-fitting axis of , which may be compared with the PA of 150 found by Wang et al. (2005a). Again, since the two values do not differ significantly, we adopt the Wang et al. direction for ease of comparison between the two data sets. The axis and ISP choices for SN 2004dt are indicated in Figure 14, and the resulting RSP and URSP are shown in Figure 15.
From examination of Figure 15, it is clear that the two events have spectropolarimetric similarities. Both show low overall polarization and modulations across the Si II and Ca II near-IR triplet absorptions. The detailed character of the line polarizations do differ, however. For SN 2002bf there is a polarization change across the Ca II feature, with a more modest (0.4%) feature detected in the Si II line. (When discussing overall “polarization change” across a line feature without specific reference to either the RSP or URSP, we effectively mean the quadrature sum of the changes seen in the two parameters.) For SN 2004dt, the situation is reversed. In the case of the Ca II line, this may be related to its relative strength and velocity in the two spectra, as both the equivalent width and velocity of the feature in the flux spectrum are much greater in SN 2002bf than in SN 2004dt. As discussed earlier (§ 4.1), it is possible that burning to Ca occurred more extensively in SN 2002bf than it did in SN 2004dt. The explanation for the Si II line disparity, however, is not so obvious, as the lines have similar strengths and velocities.
Clearly, strong line and weak continuum polarization levels disfavor the simple ellipsoidal model. Applying Eq. (1) to the data for SN 2002bf and SN 2004dt yields lower bounds on the expected continuum polarization of and , respectively. For both objects, however, we measure in both the observed and ISP-subtracted data for the spectral region 6800–7800 Å, which is largely devoid of line opacity in SNe Ia near maximum (§ 2.3.1). The ellipsoidal model therefore appears to be ruled out as the explanation for the polarization characteristics of these objects.
The clumpy-ejecta model, on the other hand, provides a natural explanation for high line and low continuum polarization levels (§ 2.3.1). In particular, the GCD scenario can successfully explain (1) the high line velocities, (2) the large polarization change in the line troughs, (3) the great radial extent of the obscuring material (i.e., for , the obscuring pancake spans the range 10,000–21,000 km s-1), and (4) the lack of significant continuum polarization. A remaining challenge is to explain the lack of any polarization change across the O I line, especially in the earlier Wang et al. (2005a) data for SN 2004dt, when this line is extremely strong in the total-flux spectrum. Recent nucleosynthesis calculations based on multi-dimensional (2D and 3D) hydrodynamical simulations of the thermonuclear burning phase in SNe Ia show that as much as to of the ejected matter in SNe Ia is unburned carbon and oxygen (Travaglio et al. 2004). This has led Wang et al. (2005a) to propose that the primordial oxygen is nearly spherically distributed, within which asymmetrically distributed IME clumps, or an absorbing pancake in the GCD model, are embedded.
With this in mind, an important prediction of the clumpy-ejecta model (including the GCD scenario) is that the O I line should, in fact, show a polarization change with a polarization angle that differs by from what is observed in the Si II and Ca II lines since its distribution is essentially the inverse of these IMEs. However, some oxygen is probably also contained in the clumps or pancake, since it is produced by explosive carbon burning in small quantities and should be present when such burning products as magnesium exist, whose spectral signature is unequivocally seen in the spectra. This would tend to reduce the polarization level in the O I line. Neither our data, nor those of Wang et al. (2005a), are of sufficiently high S/N to detect such a change, and it must be left to future, higher-S/N studies focused especially at early times when the O I feature is strong. Finding such a PA change would further strengthen the case for the clumpy-ejecta and/or GCD scenario.
We note that the ejecta-hole model of Kasen et al. (2004) is also capable of producing large line polarization with weak continuum polarization for sight-lines near to the hole (§ 2.3.1). Arguing against this model in these cases, though, is that it offers no natural explanation for why high line velocities should be associated with sight lines near to the hole. In fact, the Kasen et al. models predict lower absorption velocities when viewing down the hole.
In all, then, our study finds that HV SNe Ia are, as a group, characterized by much stronger line-polarization features than are seen in other SN Ia varieties. The ellipsoidal model is incapable of explaining the polarization characteristics of these objects, whereas the clumpy-ejecta and ejecta-hole models are more successful. On balance, the case for clumpy ejecta appears to be the most convincing explanation, with the GCD model investigated by Kasen & Plewa (2005) able to reproduce many of the observed spectral and spectropolarimetric features.
4.4.2 SN 1997dt
We next turn to the likely subluminous SN 1997dt, which was observed about three weeks past maximum light. Figure 5 reveals an extraordinarily high level of observed polarization, at . This is by far the largest polarization yet observed for an SN Ia. A distinct polarization feature is detected in the Fe II trough and probably also in the Si II + Na I D and Si II lines. The degree of change in the Fe II feature reaches nearly in the parameter.
This amount of observed continuum polarization is surprising, given that our best total reddening estimate predicts an upper bound on the ISP of only from the Serkowski et al. (1975) relation (see § 2.3.2). If we trust both the reddening estimate and the upper ISP bound, then an intrinsic SN polarization of at least must exist to explain the observed polarization, far higher than has been indicated for any previous SN Ia. However, the technique of Wang et al. (2005a) suggests a much higher ISP level: , or ISP, , for Å, the wavelength of maximum ISP that yields the most convincing Serkowski-law fit to the observed polarization (Fig. 5d). If this truly is the ISP, then it implies an extraordinarily high polarization efficiency for the dust along the l-o-s to SN 1997dt: , which is double the observed Galactic limit of . Of course, some of this discrepancy could be removed if the true reddening were greater than we suspect. However, even allowing the reddening to equal the upper limit of mag set in § 4.3.2 still requires the dust-polarization efficiency to exceed the Galactic limit.
It thus appears that we face a stark choice: either SN 1997dt has the highest intrinsic polarization of any SN Ia yet observed, or the dust along the l-o-s has an exceptionally high polarization efficiency. The epoch of our observation of SN 1997dt is unique for a subluminous SN Ia, so there is no empirical database from which to draw expectations and help decide between these two options.
The situation for SN 1997dt, while perplexing, in fact is not unique: a similar palette of possibilities presented themselves in our previous study of a single epoch of spectropolarimetry of SN 1999gi, an SN II-P that also had a low reddening and large observed polarization (Leonard & Filippenko 2001; Leonard et al. 2002d). Like SNe Ia, SNe II-P as a group have historically shown very low intrinsic continuum polarization. After considering many polarization production mechanisms, including polarization due to newly formed dust in the SN ejecta and dust reflection by one or more off-center dust blobs external to the SN, we concluded that the most likely explanation for the polarization of SN 1999gi was that the host-galaxy dust along the l-o-s possesses a very high polarization efficiency, , which remains the largest value yet inferred for a single sight line in either the MW or an external galaxy (Leonard et al. 2002b).
There are arguments favoring a similar explanation here. First, a Serkowski law reasonably fits the observed continuum polarization of SN 1997dt (Fig. 5d). Further, at 21 days past maximum, SN 1997dt may be nearing the end of its photospheric phase, a time when spectropolarimetry may be losing its efficacy as an asymmetry probe due to a lack of electrons available to scatter the light. If we believe this to be the case, then we should not expect large polarization, even if the SN is highly aspherical. If we accept the large ISP, then we naturally would like to know whether it is due to dust in the MW or NGC 7448. Unfortunately, we have not observed any distant Galactic “probe” stars (§ 2.3.2) near to the l-o-s to estimate the Galactic ISP. There are, however, reasons to suspect that it is low. First, 20 stars within of the l-o-s are listed in the agglomeration of stellar polarization catalogs by Heiles (2000), and the greatest observed polarization is only . Second, the great majority of the reddening is due to host-galaxy dust, since mag while mag (§ 4.3.2). As was the case with SN 1999gi, we would again conclude that it is the dust within the host galaxy that must have the extraordinarily high polarization efficiency.
There are arguments to oppose this, however. Previous SN Ia polarization studies have found intrinsic polarizations increasing toward red wavelengths (§ 2.3.3), which could certainly mimic a Serkowski law over the limited wavelength band covered by our observations. Further, the line polarization features demonstrate that the SN must possess at least some intrinsic polarization. Finally, the relatively late phase of the observation, invoked previously to argue against high intrinsic polarization, can also be used to argue in favor of it: at the stage immediately before an SN begins the transition to the nebular phase, the deepest layers of the ejecta are revealed. Although in need of confirmation by detailed modeling, for this epoch one can plausibly argue that an optical photosphere still exists with sufficient optical depth to electron scattering, perhaps even reaching the single-scattering limit, which is the most polarizing atmosphere (Höflich 1991). If the explosion mechanism itself is asymmetric, the largest imprint of the asymmetry would presumably be in the innermost layers, which could lead to a very large intrinsic polarization that reveals itself just at this late phase.
In fact, such an effect is seen in the spectropolarimetry of the SN II-P 2004dj as it transitions to the nebular phase (D. C. Leonard et al., in preparation). However, in the case of SN 2004dj, the strong increase is observed primarily in the “continuum” region 6800–7800 Å (and in a few strong line troughs), not in the overall level across the whole spectrum. Although in need of confirmation by detailed modeling, depolarizing line blanketing may also be significant for SNe Ia at blue wavelengths at this epoch, which would again argue for a large ISP as the explanation of the high observed polarization. One possibility that circumvents this difficulty is that asymmetrically distributed concentrations of radioactive Ni, recently uncovered in the thinning ejecta at this relatively late epoch, are responsible for the large polarization.
Curiously, the single, high-polarization observation of SN 1999gi occurred at a similar stage of its evolution, right at the end of the optical plateau that characterizes the photospheric phase in SNe II-P. It is thus unfortunate that no other spectropolarimetric epochs were obtained for either event (SN 1999gi and SN 1997dt) to serve as a basis for comparison. Multi-epoch data covering the transition from the photospheric to the nebular phases of SNe of all types will certainly help reveal more definitively the physical explanation for such high observed polarizations at these late times.
It may be possible to gain insight into the cause of the observed polarization from examination of the spectropolarimetry data in the – plane, shown in Figure 16. ISP originating from a single source (i.e., characterized by a single PA) will spread intrinsically unpolarized data points along a line in a direction that intersects the origin in the – plane. Finding that data lie predominantly along such a line, and exhibit a Serkowski law spectral shape, provides compelling evidence that a large, single source of ISP dominates the observed signal. Such was the case for SN II-P 1999gi (Leonard et al. 2002b). Similarly, for SN 1997dt, an elongation of the data points from blue to red wavelengths in a direction that roughly points back toward the origin also exists.
When the ISP derived earlier (ISP, , for Å) is removed, the wavelength dependence of the polarization largely disappears (Fig. 16), strengthening the argument for a single, dominant ISP source. The data are then seen to lie along an axis with a fairly well-defined PA of (Fig. 16), against which we calculate the RSP and URSP shown in Figure 17. Although of individually low to moderate significance, the polarization features in the Fe II and Si II troughs, seen in both RSP and URSP, do seem to prefer the same general direction, with most of the modulation occurring along the URSP axis (e.g., the direction perpendicular to the main axis in the – plane). Taken at face value, consistent line-trough polarization changes in a direction differing from that preferred by the continuum favors an origin in the selective blocking of photospheric light by clumpy and asymmetrically distributed intermediate and iron-peak elements overlying the photosphere as opposed to an ellipsoidal scenario.
Other plausible ISP choices, however, yield different conclusions. For instance, a smaller ISP of at the same PA yields a more nearly spherical constellation of points centered near , with the line excursions now pointing back toward the origin. Since some modelers predict that, in SNe Ia with an ellipsoidal asphericity, polarization decreases may exist in absorption troughs (§ 2.3.1), the ellipsoidal model cannot therefore be ruled out in this case as the cause of the polarization. Given the marginal significance of the weaker features, additional interpretation of the line-trough polarization degrees and directions is probably not warranted with these data.
In conclusion, we find evidence for a large ISP contribution to the observed polarization of SN 1997dt, probably in the range . This implies a polarization efficiency for the dust along the l-o-s in NGC 7448 that exceeds the Galactic limit. We do, however, also find evidence for polarization intrinsic to the object, most convincingly in specific line features and, perhaps, in the continuum as well. A combination of asymmetrically distributed radioactive Ni and synthesized IMEs overlying the photosphere may provide the simplest explanation for the line and potential continuum polarization at this late phase, although the ellipsoidal model cannot be definitively ruled out.
4.4.3 SN 2003du
Our spectropolarimetry of SN 2003du represents the highest S/N data of our study, and permits a more detailed analysis of line features than has been possible for the other objects. SN 2003du presents a low level of observed polarization across most of the spectrum, with , (Fig. 7). The polarization exhibits an increasing trend with wavelength, rising from nearly zero at blue wavelengths to 0.2% at the red edge of the spectrum. There are distinct and significant polarization changes across several absorption features, including the Ca II near-IR triplet, the Si II line, probably a few weaker lines such as Fe II , and very tentatively the Ca II H & K absorption.
Applying the technique of Wang et al. (2005a), and choosing the regions indicated in Figure 7a to estimate the ISP, yields , or ISP, , for an assumed Å. This very low ISP is consistent with the negligible reddening found earlier. Furthermore, on the same night the SN 2003du data were taken, we observed the distant Galactic star BD (spectral type F8, mag), located just from the l-o-s of SN 2003du, and found it to be null to within . From its spectroscopic parallax, we estimate BD to be at least pc away which, at a Galactic latitude of , satisfies the criterion of Tran (1995) that a good MW “probe” star be more than 150 pc from the Galactic plane. We thus have multiple reasons to suspect little ISP contaminating the data.
After removal of the minimal ISP, a well-defined axis with is derived (Fig. 18), about which we calculate the intrinsic RSP and URSP, shown in Figure 19. Compared with what was seen in the HV SNe Ia, and even SN 1997dt, the line-polarization features are not large, amounting to no more than . However, the very high S/N of these data makes the detections unequivocal, and establishes intrinsic polarization in a spectroscopically and photometrically normal SN Ia at the latest phase yet observed.
The behavior of the line-trough polarization for the Ca II near-IR triplet and Si II are very similar. Both show sharp increases of 0.2% in RSP, as well as overall increases in URSP. Modest RSP increases of may also be discerned in the Fe II and Ca II H & K absorptions. At this phase, the O I feature in SNe Ia is quite weak and, coupled with telluric A-band contamination, makes definitive detection of polarization modulation in this important region difficult; the observed changes are at about the level of the statistical noise.
The commonality between the polarization behavior of the Si and Ca lines argues for similar origins. Given the high S/N of the data, we can examine rather closely the basic predictions of the ellipsoidal model that (a) the polarization angle should be independent of wavelength, and (b) the overall polarization should increase from blue to red wavelengths, with an expectation of at Å (if the line opacity remains strong in these regions at the epoch of observation; § 2.3.1).
With our initial choice of ISP, the first criterion is clearly not satisfied, as there are obvious excursions in URSP throughout the spectrum, with especially sharp modulations occurring across the strongest lines. In fact, for ISP values constrained to lie along the symmetry axis we are unable to find any value that convincingly satisfies both criteria of the ellipsoidal model: values in the upper-right quadrant (e.g., ) produce a polarization decrease with wavelength across the spectrum, while ISP values in the lower-left quadrant that satisfy the criterion of at blue wavelengths (e.g., ) result in strong PA changes across the spectral lines. Choosing an ISP point far beyond the constellation of data points, which may serve to make the PA changes less objectionable (although still statistically significant), has the unfortunate consequence of straining the limits implied from the very low reddening, at least for dust with normal polarizing efficiency.
In addition, examining the URSP behavior of the Si II and Ca II near-IR lines in Figure 19 more closely, we see that the generally increasing trends in URSP across the lines show sharp decreases right at the locations of peak RSP modulation, although the statistical significance of the modulations, especially for Ca II, is not high. If the abrupt changes in URSP are real, such structure is readily explained under the clumpy-ejecta model by variations in the distribution of the IMEs as a function of radius in the expanding ejecta. Chugai (1992) also demonstrates that such sharp changes in line features can be produced by excitation asymmetry. On the other hand, there is no obvious mechanism to produce such an effect in the simple ellipsoidal models. We thus conclude that it is difficult to reconcile the basic predictions of the ellipsoidal model with the data for SN 2003du.
We therefore suspect either clumps in the ejecta overlying the photosphere or ionization asymmetry as the cause of the inferred line and, perhaps, continuum polarization, and are led again to disfavor the ellipsoidal model as the cause of the intrinsic polarization of this SN.
5 Conclusions
We present post-maximum single-epoch spectropolarimetry of four SNe Ia, bringing to six the number of SNe Ia thus far examined in detail with spectropolarimetry during the early phases. The four objects span a range of spectral and photometric properties, yet all are demonstrated to be intrinsically polarized. This suggests that asphericity and/or asymmetry may be a ubiquitous characteristic of SNe Ia in the first weeks after maximum light. The nature and degree of the polarization varies considerably within the sample, but in a way that is consistent with, and extends, previously suspected trends. Our main spectropolarimetry results are as follows:
-
1.
SN 2002bf and SN 2004dt, both HV SNe Ia observed shortly after maximum brightness, exhibit the largest polarization features yet seen definitively for any subtype of SN Ia, with modulations of up to 2% in the troughs of the strongest lines. The overall polarization level of both objects is minimal, at least at blue wavelengths; there is a possible trend of increasing polarization with wavelength for both objects, though neither shows significant polarization in the “continuum” region 6800–7800 Å. The ISP contamination is not thought to be large in either object.
-
2.
SN 1997dt, believed to be a somewhat subluminous event, has the highest observed overall polarization of any SN Ia yet studied, , at 21 days past maximum light. This demands either an extraordinarily large polarization efficiency for the dust along the l-o-s in NGC 7448, the largest intrinsic SN Ia polarization thus far found, or perhaps some combination of the two. The observed polarization rises by about from blue ( Å) to red ( Å) wavelengths, approximating a Serkowski-law ISP curve rather convincingly, albeit one with a somewhat unusual peak wavelength ( Å). A polarization modulation of nearly in the strong Fe II absorption, and a more modest change of in the Si II line, demonstrate that the SN does possess intrinsic polarization features. However, we conclude that ISP is responsible for the bulk of the overall polarization that is observed, with , and that the polarization efficiency of the dust along the l-o-s in NGC 7448 likely exceeds the empirical Galactic limit.
-
3.
SN 2003du is a slightly overluminous SN Ia. Our spectropolarimetry, taken 18 days after maximum light, is the highest S/N data obtained for our sample of objects. It reveals a low continuum polarization that increases by 0.3% from blue to red wavelengths, with distinct changes of 0.2% detected in the Si II and Ca II near-IR triplet lines; smaller changes may be detected in weaker lines. The very similar behavior of the polarization in the two strongest lines, in both magnitude and direction in the – plane, suggests a common polarization origin. ISP is thought to be minimal.
Ordered by increasing strength of line-polarization features in SNe Ia, we find as follows: ordinary/overluminous subluminous HV SNe Ia, with the strength of the line-polarization features increasing from in the slightly overluminous SN 2003du to in both HV SNe Ia in our study. Absolute continuum polarization levels are more difficult to establish, due largely to uncertainties in the ISP, but there are compelling reasons to believe that at least three of our objects possess very little intrinsic polarization in spectral regions outside of specific line features. The Howell et al. (2001) study of SN 1999by and our data on SN 1997dt provide some evidence that continuum polarization may be higher in subluminous objects than in other types.
There are a number of alternatives from which to choose for the origin of polarization in SNe Ia, including global asphericity (e.g., the ellipsoidal model), ionization asymmetry, and clumps in the ejecta overlying the photosphere. The small, redward rise in the overall polarization level that is discerned in at least three of our objects can be reproduced by models possessing either global asphericity or an ionization asymmetry. Under the ellipsoidal model, the levels of continuum polarization for SN 2002bf, SN 2003du, and SN 2004dt imply minor to major axis ratios of around if viewed equator-on (Höflich 1991; Wang et al. 2003). This level of asphericity would produce a luminosity dispersion of about 0.1 mag for random viewing orientations (Höflich 1991), which could explain some of the dispersion seen in the brightness-decline relation of SNe Ia. If the proposed global asphericity is more complicated, then the luminosity of a single SN Ia may depend on viewing angle in a non-trivial way such that, even for a large sample of objects, an overall bias to slightly higher or lower values may result.
The potential for significantly greater continuum polarization, perhaps of 1%, in the likely subluminous SN 1997dt observed 21 days after maximum would imply a more severe distortion, of at least , from the models of Höflich (1991). Since most cosmological applications of SNe Ia rely on data acquired closer to maximum light, such a late-time asphericity, even if common, would not seriously affect the utility of SNe Ia as distance indicators.
To explain the ubiquitous line polarization, the simple ellipsoidal model is effectively ruled out for three of our objects, including, most convincingly, the two HV events. From a number of lines of reasoning, the most convincing explanation is partial obscuration of the photosphere by clumps of newly synthesized IMEs forged in the explosion.
For the HV SNe Ia, in particular, the GCD model studied by Kasen & Plewa (2005) provides a plausible explanation for many of the observed spectral and spectropolarimetric characteristics. It predicts the existence of an optically thick pancake of material with significant radial extent that partially obscures the optical photosphere, producing larger line velocities and equivalent widths for many spectral features, and stronger line-trough polarization than is seen in more typical events. These qualitative expectations are borne out by our data: The line features of SN 2002bf and SN 2004dt possess the strongest polarization modulations and greatest equivalent widths of our sample. The astonishing similarity between our epoch of spectropolarimetry of SN 2004dt, 4 days after maximum, and that presented by Wang et al. (2005a) from 11 days earlier, provides compelling evidence that the obscuring material also possesses great radial extent in the thinning ejecta.
That SNe Ia may be separable into different groups based on their spectropolarimetric characteristics yields one more clue to assist in narrowing down progenitor possibilities and/or models for the physics of the explosion. The assertion that some fraction of the IMEs in the ejecta of SNe Ia may be confined to bubbles or filaments is, however, a rather blunt discriminatory tool: At the present stage of theoretical modeling, deflagration, delayed-detonation, off-center delayed-detonation, and GCD models can all plausibly be argued to produce clumps in the ejecta (e.g., Wang et al. 2005a, and references therein). The specific predictions of the GCD model in particular need to be further examined, preferably in full three-dimensional simulations, to test whether the explosion mechanism itself is viable, and, if so, whether it can quantitatively reproduce the observed characteristics of at least some SNe Ia in detail. On the observational front, higher S/N data, preferably obtained at multiple epochs, will help to narrow down the possibilities as well. With the steady advances being made in the theoretical understanding of these events, and the growing rate of SNe Ia studied in detail with spectropolarimetry, prospects for improving our understanding of these events are bright.
References
- Altavilla et al. (2004) Altavilla, G., et al. 2004, MNRAS, 349, 1344
- Anupama (1997) Anupama, G. C. 1997, AJ, 114, 2054
- Anupama et al. (2005) Anupama, G. C., Sahu, D. K., & Jose, J. 2005, A&A, in press (astro-ph/0409494)
- Arnett (1969) Arnett, W. D. 1969, Ap&SS, 5, 180
- Arnett (1979) Arnett, W. D. 1979, ApJ, 230, L37
- Barbon et al. (1990) Barbon, R., Benetti, S., Rosino, L., Cappellaro, E., & Turatto, M. 1990, A&A, 237, 79
- Barbon et al. (1989) Barbon, R., Rosino, L., & Iijima, T. 1989, A&A, 220, 83
- Benetti et al. (2004) Benetti, S., et al. 2004, MNRAS, 348, 261
- Benetti et al. (2005) Benetti, S., et al. 2005, ApJ, submitted; astro-ph/0411059
- Berdyugin et al. (1995) Berdyugin, A., Snare, M.-O., & Teerikorpi, P. 1995, A&A, 294, 568
- Bessell (1999) Bessell, M. S. 1999, PASP, 111, 1426
- Branch (1987) Branch, D. 1987, ApJ, 316, L81
- Branch et al. (1993) Branch, D., Fisher, A., & Nugent, P. 1993, AJ, 106, 2383
- Branch & van den Bergh (1993) Branch, D., & van den Bergh, S. 1993, AJ, 105, 2231
- Cappellaro et al. (1997) Cappellaro, E., Mazzali, P. A., Benetti, S., Danziger, I. J., Turatto, M., Della Valle, M., & Patat, F. 1997, A&A, 328, 203
- Cappellaro et al. (2001) Cappellaro, E., et al. 2001, ApJ, 549, L215
- Chugai (1992) Chugai, N. N. 1992, Soviet Astronomy Letters, 18, 168
- Cohen (1973) Cohen, J. G. 1973, ApJ, 186, 149
- Cousins (1981) Cousins, A. W. J. 1981, South African Astronomical Observatory Circular, 6, 4
- Cropper et al. (1988) Cropper, M., Bailey, J., McCowage, J., Cannon, R. D., & Couch, W. J. 1988, MNRAS, 231, 695
- Filippenko (1982) Filippenko, A. V. 1982, PASP, 94, 715
- Filippenko (1997) —. 1997, ARA&A, 35, 309
- Filippenko (2004) —. 2004, in Carnegie Observatories Astrophysics Series, Vol. 2: Measuring and Modeling the Universe, ed. W. L. Freedman (Cambridge: Cambridge Univ. Press), 270
- Filippenko (2005) —. 2005, in White Dwarfs: Probes of Galactic Structure and Cosmology, ed. E. M. Sion, H. L. Shipman, and S. Vennes (Dordrecht: Kluwer), in press (astro-ph/0410609)
- Filippenko et al. (2002) Filippenko, A. V., Chornock, R., Leonard, D. C., Moran, E. C., & Matheson, T. 2002, IAU Circ., 7846, 3
- Filippenko & Leonard (2004) Filippenko, A. V., & Leonard, D. C. 2004, in Cosmic Explosions in Three Dimensions: Asymmetries in Supernovae and GRBs, ed. P. Höflich, P. Kumar, & J. C. Wheeler (Cambridge: CUP), 30
- Filippenko et al. (2001) Filippenko, A. V., Li, W., Treffers, R. R., & Modjaz, M. 2001, in Small Telescope Astronomy on Global Scales, ed. W. P. Chen, C. Lemme, & B. Paczyński (San Francisco: ASP), 121
- Filippenko et al. (1992a) Filippenko, A. V., et al. 1992a, AJ, 104, 1543
- Filippenko et al. (1992b) Filippenko, A. V., et al. 1992b, ApJ, 384, L15
- Filippenko et al. (2003) Filippenko, A. V., et al. 2003, IAU Circ., 8229, 2
- Foley et al. (2003) Foley, R. J., et al. 2003, PASP, 115, 1220
- Foley et al. (2005) Foley, R. J., Filippenko, A. V., Leonard, D. C., Riess, A. G., Nugent, P., & Perlmutter, S. 2005, ApJ, in press (astro-ph/0504481)
- Gal-Yam (2004) Gal-Yam, A. 2004, The Astronomer’s Telegram, 321, 1
- Gerardy et al. (2004) Gerardy, C. L., et al. 2004, ApJ, 607, 391
- Hamuy et al. (1996) Hamuy, M., Phillips, M. M., Suntzeff, N. B., Schommer, R. A., Maza, J., & Aviles, R. 1996, AJ, 112, 2391
- Heiles (2000) Heiles, C. 2000, AJ, 119, 923
- Höflich (1991) Höflich, P. 1991, A&A, 246, 481
- Höflich et al. (2001) Höflich, P., Khokhlov, A., & Wang, L. 2001, in 20th Texas Symposium on Relativistic Astrophysics, ed. J. C. Wheeler & H. Martel (New York: AIP), 459
- Höflich et al. (1996) Höflich, P., Wheeler, J. C., Hines, D. C., & Trammell, S. R. 1996, ApJ, 459, 307
- Horne (1986) Horne, K. 1986, PASP, 98, 609
- Howell (2001) Howell, D. A. 2001, ApJ, 554, L193
- Howell et al. (2001) Howell, D. A., Höflich, P., Wang, L., & Wheeler, J. C. 2001, ApJ, 556, 302
- Issa et al. (1990) Issa, M. R., MacLaren, I., & Wolfendale, A. W. 1990, A&A, 236, 237
- Jeffery (1991a) Jeffery, D. J. 1991a, ApJ, 375, 264
- Jeffery (1991b) —. 1991b, ApJS, 77, 405
- Jha (2002) Jha, S. 2002, Ph.D. thesis, Harvard University
- Jha et al. (2005) Jha, S., et al. 2005, AJ, submitted
- Johnson et al. (1966) Johnson, H. L., Iriarte, B., Mitchell, R. I., & Wisniewskj, W. Z. 1966, Communications of the Lunar and Planetary Laboratory, 4, 99
- Kasen et al. (2004) Kasen, D., Nugent, P., Thomas, R. C., & Wang, L. 2004, ApJ, 610, 876
- Kasen & Plewa (2005) Kasen, D., & Plewa, T. 2005, ApJ, 622, L41
- Kasen et al. (2003) Kasen, D., et al. 2003, ApJ, 593, 788
- Kawabata et al. (2002) Kawabata, K. S., et al. 2002, ApJ, 580, L39
- Khokhlov et al. (1993) Khokhlov, A., Mueller, E., & Hö flich, P. 1993, A&A, 270, 223
- Khokhlov (1991) Khokhlov, A. M. 1991, A&A, 245, 114
- Kotak et al. (2003) Kotak, R., Meikle, W. P. S., & Rodriguez-Gil, P. 2003, IAU Circ., 8122, 3
- Leibundgut (2000) Leibundgut, B. 2000, A&A Rev., 10, 179
- Leibundgut et al. (1993) Leibundgut, B., et al. 1993, AJ, 105, 301
- Lentz et al. (2001) Lentz, E. J., Baron, E., Branch, D., & Hauschildt, P. H. 2001, ApJ, 547, 402
- Leonard & Filippenko (2001) Leonard, D. C., & Filippenko, A. V. 2001, PASP, 113, 920
- Leonard & Filippenko (2005) —. 2005, in 1604–2004, Supernovae as Cosmological Lighthouses, ed. M. Turatto et al., in press (astro-ph/0409518)
- Leonard et al. (2001) Leonard, D. C., Filippenko, A. V., Ardila, D. R., & Brotherton, M. S. 2001, ApJ, 553, 861
- Leonard et al. (2000a) Leonard, D. C., Filippenko, A. V., Barth, A. J., & Matheson, T. 2000a, ApJ, 536, 239
- Leonard et al. (2002a) Leonard, D. C., Filippenko, A. V., Chornock, R., & Foley, R. J. 2002a, PASP, 114, 1333
- Leonard et al. (2002b) Leonard, D. C., Filippenko, A. V., Chornock, R., & Li, W. 2002b, AJ, 124, 2506
- Leonard et al. (2000b) Leonard, D. C., Filippenko, A. V., & Matheson, T. 2000b, in Cosmic Explosions, ed. S. S. Holt & W. W. Zhang (New York: AIP), 165
- Leonard et al. (2002c) Leonard, D. C., et al. 2002c, PASP, 114, 35
- Leonard et al. (2002d) Leonard, D. C., et al. 2002d, AJ, 124, 2490
- Li et al. (2003) Li, W., Filippenko, A. V., Chornock, R., & Jha, S. 2003, PASP, 115, 844
- Li et al. (2001b) Li, W., Filippenko, A. V., Treffers, R. R., Riess, A. G., Hu, J., & Qiu, Y. 2001b, ApJ, 546, 734
- Li et al. (1996) Li, W., Qiu, Y. L., Qiao, Q. Y., Ma, J., Hu, J. Y., Wang, L., & Wheeler, J. C. 1996, IAU Circ., 6379, 1
- Li et al. (2000) Li, W., et al. 2000, in Cosmic Explosions, ed. S. S. Holt & W. W. Zhang (New York: AIP), 445
- Li et al. (2001a) Li, W., et al. 2001a, PASP, 113, 1178
- Martin & Li (2002) Martin, P., & Li, W. 2002, IAU Circ., 7836, 1
- Massey & Gronwall (1990) Massey, P., & Gronwall, C. 1990, ApJ, 358, 344
- Matheson et al. (2000) Matheson, T., Filippenko, A. V., Ho, L. C., Barth, A. J., & Leonard, D. C. 2000, AJ, 120, 1499
- Matheson et al. (2002) Matheson, T., Jha, S., Challis, P., Kirshner, R., & Berlind, P. 2002, IAU Circ., 7846, 2
- Mathewson & Ford (1970) Mathewson, D. S., & Ford, V. L. 1970, MmRAS, 74, 139
- Miller et al. (1988) Miller, J. S., Robinson, L. B., & Goodrich, R. W. 1988, in Instrumentation for Ground-Based Optical Astronomy, ed. L. B. Robinson (New York: Springer), 157
- Miller & Stone (1993) Miller, J. S., & Stone, R. P. S. 1993, Lick Obs. Tech. Rep., 66
- Milne et al. (1999) Milne, P. A., The, L.-S., & Leising, M. D. 1999, ApJS, 124, 503
- Milne et al. (2001) —. 2001, ApJ, 559, 1019
- Moore & Li (2004) Moore, M., & Li, W. 2004, IAU Circ., 8386, 1
- Munari & Zwitter (1997) Munari, U., & Zwitter, T. 1997, A&A, 318, 269
- Nomoto et al. (1984) Nomoto, K., Thielemann, F.-K., & Yokoi, K. 1984, ApJ, 286, 644
- Nugent et al. (1995) Nugent, P., Phillips, M., Baron, E., Branch, D., & Hauschildt, P. 1995, ApJ, 455, L147
- Oke & Gunn (1983) Oke, J. B., & Gunn, J. E. 1983, ApJ, 266, 713
- Oke et al. (1995) Oke, J. B., et al. 1995, PASP, 107, 375
- Patat et al. (1996) Patat, F., Benetti, S., Cappellaro, E., Danziger, I. J., Della Valle, M., Mazzali, P. A., & Turatto, M. 1996, MNRAS, 278, 111
- Patat et al. (2004) Patat, F., Pignata, G., Benetti, S., & Aceituno, J. 2004, IAU Circ., 8387, 3
- Perlmutter et al. (1999) Perlmutter, S., et al. 1999, ApJ, 517, 565
- Phillips et al. (1999) Phillips, M. M., Lira, P., Suntzeff, N. B., Schommer, R. A., Hamuy, M., & Maza, J. 1999, AJ, 118, 1766
- Phillips et al. (1992) Phillips, M. M., Wells, L. A., Suntzeff, N. B., Hamuy, M., Leibundgut, B., Kirshner, R. P., & Foltz, C. B. 1992, AJ, 103, 1632
- Plewa et al. (2004) Plewa, T., Calder, A. C., & Lamb, D. Q. 2004, ApJ, 612, L37
- Qiao et al. (1997) Qiao, Q. Y., Qiu, Y. L., Li, W., Hu, J. Y., Esamdin, A., Wei, J. Y., Cao, L., & Gu, Q. S. 1997, IAU Circ., 6775, 1
- Richmond et al. (1995) Richmond, M. W., et al. 1995, AJ, 109, 2121
- Riess (2004) Riess, A. G. 2004, Instrument Science Report, ACS 03-09, STScI
- Riess et al. (1998b) Riess, A. G., Nugent, P., Filippenko, A. V., Kirshner, R. P., & Perlmutter, S. 1998b, ApJ, 504, 935
- Riess et al. (1996) Riess, A. G., Press, W. H., & Kirshner, R. P. 1996, ApJ, 473, 88
- Riess et al. (1997) Riess, A. G., et al. 1997, AJ, 114, 722
- Riess et al. (1998a) Riess, A. G., et al. 1998a, AJ, 116, 1009
- Riess et al. (2001) Riess, A. G., et al. 2001, ApJ, 560, 49
- Riess et al. (2004) Riess, A. G., et al. 2004, ApJ, 607, 665
- Riess et al. (2005) Riess, A. G., et al. 2005, ApJ, in press (astro-ph/0503159)
- Salvo et al. (2004) Salvo, M., Schmidt, B., & Wood, P. 2004, IAU Circ., 8387, 2
- Schlegel et al. (1998) Schlegel, D. J., Finkbeiner, D. P., & Davis, M. 1998, ApJ, 500, 525
- Schmidt et al. (1994) Schmidt, B. P., Kirshner, R. P., Leibundgut, B., Wells, L. A., Porter, A. C., Ruiz-Lapuente, P., Challis, P., & Filippenko, A. V. 1994, ApJ, 434, L19
- Schmidt et al. (1992) Schmidt, G. D., Elston, R., & Lupie, O. L. 1992, AJ, 104, 1563
- Schwartz & Holvorcem (2003) Schwartz, M., & Holvorcem, P. R. 2003, IAU Circ., 8121, 1
- Schwartz et al. (2000) Schwartz, M., Li, W. D., Filippenko, A. V., Modjaz, M., & Treffers, R. R. 2000, IAU Circ., 7514, 2
- Serkowski et al. (1975) Serkowski, K., Mathewson, D. L., & Ford, V. L. 1975, ApJ, 196, 261
- Shapiro & Sutherland (1982) Shapiro, P. R., & Sutherland, P. G. 1982, ApJ, 263, 902
- Sirianni et al. (2005) Sirianni, M., et al. 2005, PASP, submitted (available at http://acs.pha.jhu.edu/instrument/calibration/photometry/)
- Stetson (1991) Stetson, P. B. 1991, in Third ESO/STECF Data Analysis Workshop, ed. P. J. Grosbøl & R. H. Warmels (Garching: ESO), 187
- Stone (1977) Stone, R. P. S. 1977, ApJ, 218, 767
- Tonry et al. (2003) Tonry, J. L., et al. 2003, ApJ, 594, 1
- Tran (1995) Tran, H. D. 1995, ApJ, 440, 565
- Tran et al. (1997) Tran, H. D., Filippenko, A. V., Schmidt, G. D., Bjorkman, K. S., Jannuzi, B. T., & Smith, P. S. 1997, PASP, 109, 489
- Travaglio et al. (2004) Travaglio, C., Hillebrandt, W., Reinecke, M., & Thielemann, F.-K. 2004, A&A, 425, 1029
- Turnshek et al. (1990) Turnshek, D. A., Bohlin, R. C., Williamson, R. L., Lupie, O. L., Koornneef, J., & Morgan, D. H. 1990, AJ, 99, 1243
- Wade & Horne (1988) Wade, R. A., & Horne, K. 1988, ApJ, 324, 411
- Wang et al. (2005a) Wang, L., Baade, D., Höflich, P., Wheeler, J. C., Kawabata, K., Khokhlov, A., Nomoto, K., & Patat, F. 2005a, ApJ, submitted (astro-ph/0409593)
- Wang et al. (2004) Wang, L., Baade, D., Höflich, P., Wheeler, J. C., Kawabata, K., & Nomoto, K. 2004, ApJ, 604, L53
- Wang et al. (2001) Wang, L., Howell, D. A., Höflich, P., & Wheeler, J. C. 2001, ApJ, 550, 1030
- Wang & Wheeler (1997) Wang, L., & Wheeler, J. C. 1997, IAU Circ., 6622, 2
- Wang et al. (1997) Wang, L., Wheeler, J. C., & Höflich, P. 1997, ApJ, 476, L27
- Wang et al. (1996) Wang, L., Wheeler, J. C., Li, Z., & Clocchiatti, A. 1996, ApJ, 467, 435
- Wang et al. (2003) Wang, L., et al. 2003, ApJ, 591, 1110
- Wang et al. (2005b) Wang, X., Wang, L., Zhou, X., Lou, Y., & Li, Z. 2005b, ApJ, 620, L87
- Wheeler (2000) Wheeler, J. C. 2000, in Cosmic Explosions, ed. S. S. Holt & W. W. Zhang (New York: AIP), 445
- Whittet et al. (1992) Whittet, D. C. B., Martin, P. G., Hough, J. H., Rouse, M. F., Bailey, J. A., & Axon, D. J. 1992, ApJ, 386, 562
- Woosley & Weaver (1986) Woosley, S. E., & Weaver, T. A. 1986, ARA&A, 24, 205
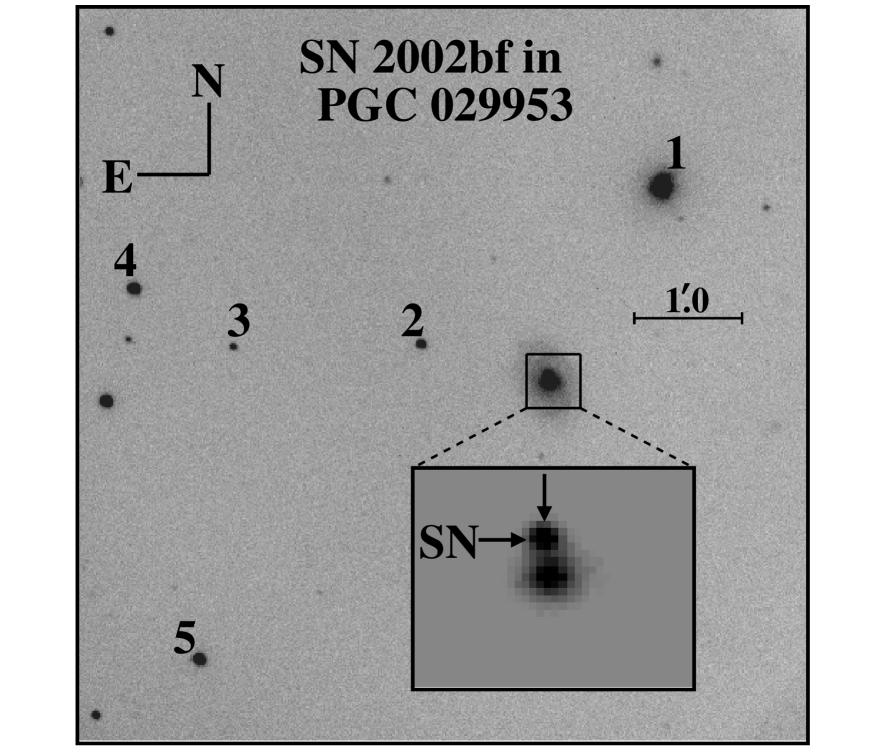
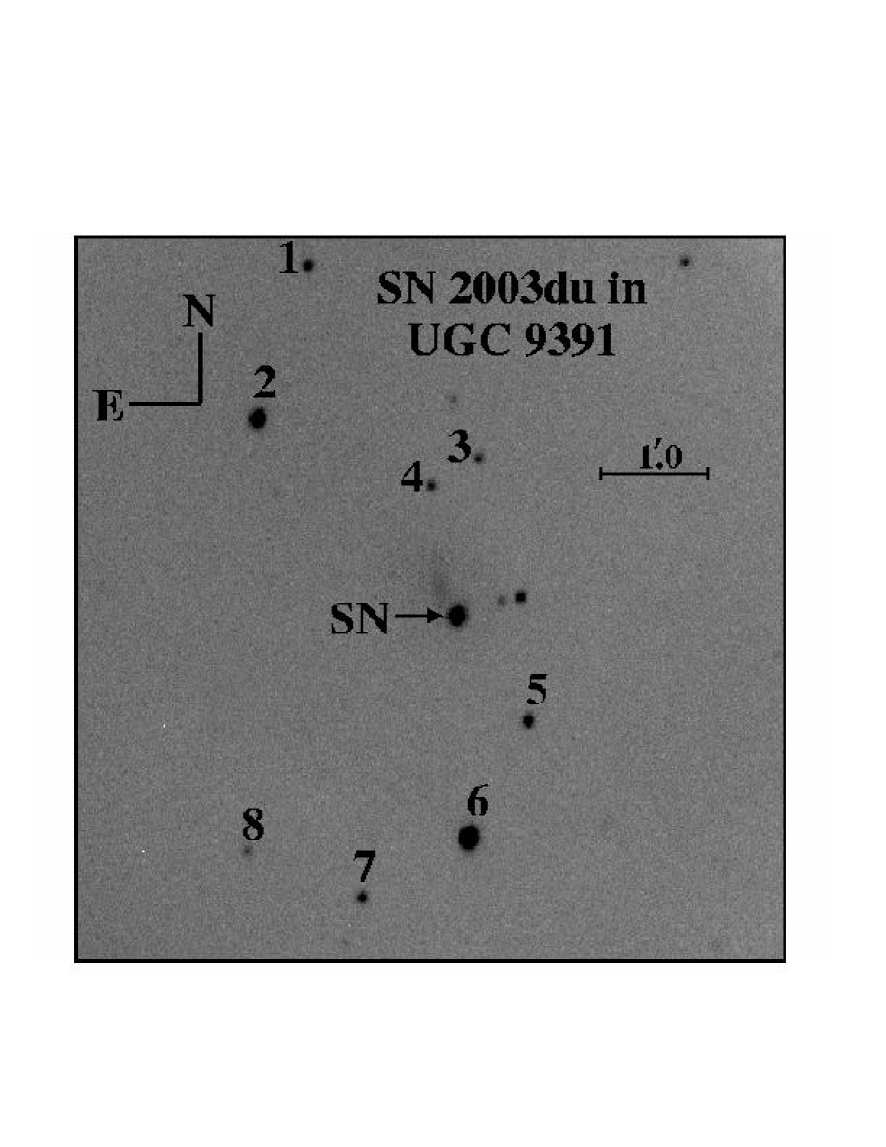


| Star | ||||
|---|---|---|---|---|
| 1 | 12.640 (0.014) | 12.226 (0.011) | 11.986 (0.020) | 11.709 (0.003) |
| 2 | 17.112 (0.021) | 16.485 (0.010) | 16.116 (0.006) | 15.776 (0.027) |
| 3 | 17.930 (0.025) | 17.441 (0.021) | 17.143 (0.014) | 16.792 (0.010 ) |
| 4 | 16.305 (0.028) | 14.861 (0.006) | 13.924 (0.016) | 12.874 (0.024) |
| 5 | 15.624 (0.012) | 14.764 (0.028) | 14.299 (0.025) | 13.850 (0.003) |
| Star | ||||
|---|---|---|---|---|
| 1 | 16.973 (0.013) | 16.291 (0.021) | 15.875 (0.018) | 15.508 (0.023) |
| 2 | 14.944 (0.025) | 14.329 (0.017) | 13.965 (0.011) | 13.614 (0.028) |
| 3 | 17.898 (0.022) | 17.025 (0.016) | 16.515 (0.015) | 16.050 (0.027) |
| 4 | 17.580 (0.032) | 16.903 (0.020) | 16.508 (0.016) | 16.171 (0.018) |
| 5 | 16.431 (0.026) | 15.813 (0.021) | 15.431 (0.014) | 15.119 (0.020) |
| 6 | 13.873 (0.025) | 13.351 (0.024) | 13.004 (0.025) | 12.746 (0.030) |
| 7 | 17.630 (0.028) | 16.295 (0.029) | 15.339 (0.027) | 14.226 (0.019) |
| 8 | 17.977 (0.031) | 17.508 (0.028) | 17.206 (0.023) | 16.849 (0.025) |
| UT Dateaayyyy-mm-dd. | DaybbDays since estimated date of maximum brightness, 2002-03-04.37 UT (HJD 2,452,337.87), taken at the midpoint of the complete series of exposures. | () | () | () | () |
|---|---|---|---|---|---|
| 2002-02-22 | -10.07 | 17.546(0.452)ccDerived from unfiltered image; see text for details. | |||
| 2002-02-24 | -8.10 | 16.759(0.136)ccDerived from unfiltered image; see text for details. | |||
| 2002-02-28 | -3.95 | 16.303(0.105)ccDerived from unfiltered image; see text for details. | |||
| 2002-03-09 | 4.95 | 16.488(0.116) | 16.185(0.119) | 16.057(0.116) | 16.407(0.123) |
| 2002-03-12 | 7.95 | 16.750(0.048) | 16.285(0.058) | 16.217(0.029) | 16.929(0.101) |
| 2002-03-15 | 10.93 | 16.974(0.044) | 16.553(0.136) | 16.421(0.030) | 17.110(0.096) |
| 2002-03-19 | 14.92 | 17.401(0.060) | 16.691(0.040) | 16.657(0.033) | 17.061(0.145) |
| 2002-03-25 | 20.90 | 18.140(0.102) | 16.998(0.039) | 16.697(0.036) | 16.957(0.076) |
| 2002-03-29 | 24.99 | 18.217(0.571) | 17.019(0.183) | 16.460(0.178) | 16.804(0.048) |
| 2002-04-01 | 27.84 | 18.667(0.054) | 17.481(0.051) | 16.876(0.077) | 16.811(0.072) |
| 2002-04-04 | 30.95 | 18.953(0.034) | 17.760(0.029) | 17.090(0.018) | 17.101(0.090) |
| 2002-04-07 | 33.89 | 19.106(0.064) | 17.856(0.048) | 17.252(0.042) | 17.255(0.172) |
| 2002-04-13 | 39.86 | 19.193(0.072) | 18.042(0.179) | 17.451(0.230) | 17.383(0.414) |
| 2002-04-22 | 48.86 | 19.352(0.056) | 18.083(0.051) | 17.752(0.152) | 17.761(0.115) |
| 2002-04-30 | 56.81 | 19.334(0.079) | 18.400(0.174) | 18.061(0.120) |
| UT Dateaayyyy-mm-dd. | DaybbDays since estimated date of maximum brightness, 2003-05-06.12 UT (HJD 2,452,765.62), taken at the midpoint of the complete series of exposures. | () | () | () | () |
|---|---|---|---|---|---|
| 2003-05-01 | -4.74 | 13.795(0.085) | 13.938(0.035) | ||
| 2003-05-06 | 0.22 | 13.508(0.028) | 13.602(0.052) | 13.572(0.035) | 13.920(0.031) |
| 2003-05-10 | 4.27 | 13.613(0.036) | 13.637(0.019) | 13.611(0.015) | 14.058(0.034) |
| 2003-05-11 | 5.25 | 13.650(0.017) | 13.665(0.019) | 13.644(0.016) | 14.105(0.037) |
| 2003-05-12 | 6.21 | 13.698(0.033) | 13.686(0.021) | 13.674(0.021) | 14.164(0.025) |
| 2003-05-13 | 7.21 | 13.752(0.031) | 13.714(0.031) | 13.729(0.024) | 14.220(0.034) |
| 2003-05-14 | 8.26 | 13.852(0.035) | 13.759(0.017) | 13.795(0.033) | 14.280(0.059) |
| 2003-05-15 | 9.20 | 13.886(0.031) | 13.778(0.043) | 13.847(0.017) | 14.336(0.028) |
| 2003-05-16 | 10.23 | 13.981(0.059) | 13.842(0.024) | 13.941(0.023) | 14.427(0.026) |
| 2003-05-17 | 11.26 | 14.105(0.131) | 13.908(0.044) | 14.004(0.036) | 14.524(0.028) |
| 2003-05-18 | 12.24 | 14.141(0.047) | 13.973(0.034) | 14.083(0.020) | 14.572(0.032) |
| 2003-05-19 | 13.27 | 14.246(0.022) | 14.004(0.019) | 14.161(0.015) | 14.638(0.047) |
| 2003-05-20 | 14.20 | 14.327(0.016) | 14.079(0.018) | 14.227(0.023) | 14.681(0.044) |
| 2003-05-22 | 16.25 | 14.570(0.031) | 14.197(0.021) | 14.327(0.028) | 14.710(0.032) |
| 2003-05-24 | 18.19 | 14.764(0.023) | 14.298(0.029) | 14.363(0.026) | 14.671(0.043) |
| 2003-05-26 | 20.26 | 15.018(0.034) | 14.404(0.021) | 14.408(0.020) | 14.632(0.031) |
| 2003-05-28 | 22.20 | 15.207(0.016) | 14.498(0.018) | 14.428(0.012) | 14.578(0.033) |
| 2003-05-30 | 24.23 | 15.404(0.039) | 14.607(0.033) | 14.439(0.026) | 14.529(0.031) |
| 2003-05-31† | 25.22 | 15.565(0.035) | 14.677(0.014) | 14.437(0.021) | 14.467(0.022) |
| 2003-06-01 | 26.19 | 15.591(0.027) | 14.702(0.028) | 14.475(0.023) | 14.507(0.038) |
| 2003-06-01† | 26.20 | 15.630(0.032) | 14.722(0.027) | 14.468(0.015) | 14.403(0.022) |
| 2003-06-04 | 29.21 | 15.866(0.018) | 14.868(0.024) | 14.570(0.021) | 14.454(0.032) |
| 2003-06-07 | 32.15 | 16.167(0.090) | 15.054(0.072) | 14.686(0.030) | 14.493(0.065) |
| 2003-06-10 | 35.17 | 16.270(0.025) | 15.206(0.014) | 14.883(0.013) | 14.636(0.037) |
| 2003-06-13 | 38.19 | 16.372(0.055) | 15.388(0.017) | 15.083(0.014) | 14.851(0.038) |
| 2003-06-16 | 41.13 | 16.511(0.031) | 15.526(0.034) | 15.241(0.031) | 15.036(0.047) |
| 2003-06-19 | 44.10 | 16.606(0.015) | 15.639(0.042) | 15.374(0.022) | 15.208(0.051) |
| 2003-06-22 | 47.11 | 16.655(0.023) | 15.748(0.022) | 15.486(0.015) | 15.349(0.039) |
| 2003-06-25 | 50.09 | 16.705(0.025) | 15.841(0.022) | 15.591(0.025) | 15.511(0.039) |
| 2003-06-26† | 51.17 | 16.772(0.022) | 15.842(0.020) | 15.629(0.037) | 15.495(0.027) |
| 2003-06-27† | 52.15 | 16.789(0.023) | 15.872(0.019) | 15.664(0.027) | 15.548(0.042) |
| 2003-06-28 | 53.09 | 16.777(0.025) | 15.926(0.025) | 15.697(0.033) | 15.648(0.045) |
| 2003-07-02 | 57.09 | 16.839(0.034) | 16.031(0.017) | 15.824(0.021) | 15.840(0.035) |
| 2003-07-06 | 61.09 | 16.918(0.017) | 16.135(0.016) | 15.953(0.014) | 16.028(0.040) |
| 2003-07-10 | 65.09 | 16.913(0.018) | 16.245(0.017) | 16.088(0.016) | 16.202(0.032) |
| 2003-07-14 | 69.09 | 17.052(0.029) | 16.358(0.014) | 16.192(0.022) | 16.331(0.035) |
| 2003-07-18 | 73.08 | 17.090(0.024) | 16.456(0.030) | 16.322(0.013) | 16.516(0.030) |
| 2003-07-22 | 77.08 | 17.193(0.035) | 16.583(0.019) | 16.461(0.018) | 16.692(0.034) |
| 2003-08-27† | 113.06 | 17.717(0.014) | 17.367(0.054) | 17.506(0.023) | 17.787(0.038) |
| 2004-07-15∗ | 435.94 | 22.33(0.03) | 22.10(0.04) | 23.44(0.08) | 21.68(0.07) |
Note. — All photometric observations were made with KAIT, except those marked with a dagger (†), which were taken with the 1-m Nickel telescope at Lick Observatory, and those marked with an asterisk (∗), which were taken with HST’s ACS/HRC.
| HJD | RangeccWavelength range of the calibrated flux spectrum. In some cases, the ends are very noisy and are not shown in the figures. | Res.ddApproximate spectral resolution derived from night-sky lines. | P.A.eePosition angle of the spectrograph slit. | Par. P.A.ffParallactic angle (Filippenko 1982) at midpoint of observation, or PA range for each set of observations. | See.iiAverage value of the full width at half maximum of the spatial profile for each set of observations, rounded to the nearest 05. | Slit | Exp. | |||||||
|---|---|---|---|---|---|---|---|---|---|---|---|---|---|---|
| UT Date | Object | DayaaDays since estimated dates of maximum brightness, for SN 1997dt (1997-11-29; HJD 2,450,782), SN 2002bf (2002-03-04.37; HJD 2,452,337.87), SN 2003du (2003-05-06.12; HJD 2,452,765.62), and SN 2004dt (2004-08-20; HJD 2,453,238). The epoch of maximum is particularly uncertain for SN 1997dt, and thus the phase our our single observation is not well known; this uncertainty is indicated by a colon. | 2,400,000 | Tel.bbL3(p) = Lick 3-m/Kast Double Spectrograph (Miller & Stone 1993); “p” denotes polarimeter attached); KI(II) = Keck-I (II) 10-m/Low-Resolution Imaging Spectrometer (LRIS; Oke et al. 1995); “p” denotes polarimeter attached. | (Å) | (Å) | (deg) | (deg) | Air.ggAirmass at midpoint of observation, or airmass range for each set of observations. | Flux Std.hhThe standard stars are as follows: F34 = Feige 34, BD28 = BD+28∘4211—Stone (1977), Massey & Gronwall (1990); HD84 = HD 84937, BD26 = BD+26∘2606, BD17 = BD+17∘4711—Oke & Gunn (1983). | (arcsec) | (arcsec) | (s) | ObserversjjAB = Aaron Barth; RC = Ryan Chornock; LD = Louis-Benoit Desroches; RF = Ryan Foley; AF = Alex Filippenko; MG = Mohan Ganeshalingam; DH = Deborah Hutchings; WL = Weidong Li; EM = Edward Moran; KS = Karin Sandstrom. |
| 1997-12-20.27 | SN 1997dt | 20.77: | 50802.77 | KIIp | 4310–6820 | 5 | 98 | 77–78 | 1.34–1.57 | HD84 | 1.8 | 1.0 | AF, AB | |
| 2002-03-07.41 | SN 2002bf | 3.03 | 52340.91 | KIp | 3900–8800 | 13 | 98 | 172–178 | 1.24–1.25 | BD26 | 1.5 | 1.5 | AF, DL, EM | |
| 2002-03-11.44 | SN 2002bf | 7.06 | 52344.94 | L3 | 3300–5400 | 5 | 98 | 98 | 1.26 | F34 | 2.0 | 2.0 | 1078 | RC, WL |
| 2002-03-11.44 | SN 2002bf | 7.06 | 52344.94 | L3 | 5200–10400 | 11 | 98 | 98 | 1.27 | HD19 | 2.0 | 2.0 | 1161 | RC, WL |
| 2003-05-24.46 | SN 2003du | 18.34 | 52783.96 | KIp | 3220–5710 | 9 | 150 | 122–153 | 1.35–1.58 | F34 | 1.5 | 1.5 | RC, DL | |
| 2003-05-24.46 | SN 2003du | 18.34 | 52783.96 | KIp | 5700–9420 | 9 | 150 | 122–153 | 1.35–1.58 | BD17 | 1.5 | 1.5 | RC, DL | |
| 2003-05-30.40 | SN 2003du | 24.28 | 52789.90 | L3 | 3100–5400 | 5 | 102 | 97–101 | 1.29–1.32 | F34 | 1.5 | 2.0 | RF, LD, DH | |
| 2003-05-30.40 | SN 2003du | 24.28 | 52789.90 | L3 | 5200–10400 | 11 | 102 | 97–101 | 1.29–1.32 | HD84 | 1.5 | 2.0 | RF, LD, DH | |
| 2003-06-07.39 | SN 2003du | 32.27 | 52797.89 | L3 | 3300–5400 | 5 | 96 | 96 | 1.34 | F34 | 2.0 | 3.0 | 700 | RF, KS |
| 2003-06-07.39 | SN 2003du | 32.27 | 52797.89 | L3 | 5200–10400 | 11 | 96 | 96 | 1.34 | BD17 | 2.0 | 3.0 | 700 | RF, KS |
| 2003-07-06.34 | SN 2003du | 61.22 | 52826.84 | L3 | 3286–5452 | 5 | 88 | 87 | 1.46 | F34 | 2.0 | 2.0 | 600 | RF, LD, MG |
| 2003-07-06.34 | SN 2003du | 61.22 | 52826.84 | L3 | 5150–10200 | 11 | 88 | 87 | 1.46 | BD26 | 2.0 | 2.0 | 600 | RF, LD, MG |
| 2003-07-27.20 | SN 2003du | 82.08 | 52847.70 | L3 | 3300–5400 | 5 | 120 | 117 | 1.18 | BD28 | 1.0 | 2.0 | 900 | AF, RF, LD |
| 2003-07-27.20 | SN 2003du | 82.08 | 52847.70 | L3 | 5200-10400 | 11 | 120 | 117 | 1.18 | BD17 | 1.0 | 2.0 | 900 | AF, RF, LD |
| 2004-08-24.43 | SN 2004dt | 3.93 | 53241.93 | L3p | 4500–9800 | 18 | 150 | 145–156 | 1.34–1.48 | BD17 | 4 | 4.0 | AF, RF, MG |
| Velocity | Velocity | |||||
|---|---|---|---|---|---|---|
| Supernova | Epoch | km s-1 | Supernova | Epoch | km s-1 | |
| SN 1984A | ||||||
| SN 1997bp | ||||||
| SN 1991T | SN 2002bf | |||||
| SN 2002bo | ||||||
| SN 1991bg | ||||||
| SN 2003du | ||||||
| SN 1994D | ||||||
| SN 2004dt | ||||||
Note. — Velocities of absorption minima of the Si II line, derived using the relativistic Doppler formula. All velocities were measured directly from spectra in our database, except for SN 1984A, for which the Si II minima wavelengths reported by Barbon et al. (1989) were used, and the day data for SN 2004dt, for which the wavelength of minimum reported by Wang et al. (2005a) was used. All spectra were first deredshifted according to the values reported in NED. The adopted recession velocities and dates of maximum are as follows: SN 1984A — km s-1, on 1984 Jan. 17 (Barbon et al. 1989); SN 1991T — km s-1, on 1991 Apr. 28 (Phillips et al. 1992); SN 1991bg — km s-1, on 1991 Dec. 15 (Leibundgut et al. 1993); SN 1994D — km s-1, on 1994 Mar. 20 (Richmond et al. 1995); SN 1997bp — km s-1, on 1997 Apr. 7 (Riess et al. 1998b); SN 2002bf — km s-1, on 2002 Mar. 4 (this work); SN 2002bo — km s-1, on 2002 Mar. 23 (Benetti et al. 2004); SN 2003du — km s-1, on 2003 May 6 (this work); SN 2004dt — km s-1, on 2004 Aug. 20 (W. Li, private communication).
| ()aaStatistical uncertainty only. | ()aaStatistical uncertainty only. | ()cc-band absolute magnitude at the time of peak -band brightness, on the distance scale used here. The fiducial template has the following peak magnitudes at maximum light: mag, mag, mag, and mag. | ()ddHost-galaxy extinction, assuming an extinction law. | ffObserver frame, no -correction, no extinction correction. -band peak at is 0.01 mag brighter than (at ) for both objects. | (at )ffObserver frame, no -correction, no extinction correction. -band peak at is 0.01 mag brighter than (at ) for both objects. | |||
|---|---|---|---|---|---|---|---|---|
| SN | (mag) | (Mpc) | ()bbMLCS2k2 light-curve shape parameter, with lower values of corresponding to brighter, more slowly declining light curves, relative to the “fiducial” template, which has mag. | (mag) | (mag) | ()eeHeliocentric Julian date minus 2,400,000 for the time of -band peak. The time of -band maximum for both SNe is about 1 day after the time of -band peak. | (mag) | (mag) |
| SN 2002bf | 35.47(0.13) | 124(8) | 0.11(0.07) | 19.58(0.05) | 0.26(0.13) | 52337.87(0.50) | 16.22 | 16.18 |
| SN 2003du | 33.18(0.05) | 43(1) | 0.25(0.03) | 19.67(0.02) | 0.04(0.03) | 52765.62(0.50) | 13.56 | 13.58 |