Where are the X-ray QPOs in active galaxies?
Abstract
In this paper we address the question of whether existing X-ray observations of Seyfert galaxies are sufficiently sensitive to detect quasi-periodic oscillations (QPOs) similar to those observed in the X-ray variations of Galactic Black Holes (GBHs). We use data from XMM-Newton and simulated data based on the best RXTE long-term monitoring light curves, to show that if X-ray QPOs are present in Seyfert X-ray light curves – with similar shapes and strengths to those observed in GBHs, but at lower frequencies commensurate with their larger black hole masses – they would be exceedingly difficult to detect. Our results offer a simple explanation for the present lack of QPO detections in Seyferts. We discuss the improvements in telescope size and monitoring patterns needed to make QPO detections feasible. The most efficient type of future observatory for searching for X-ray QPOs in AGN is an X-ray All-Sky Monitor (ASM). A sufficiently sensitive ASM would be ideally suited to detecting low frequency QPOs in nearby AGN. The detection of AGN QPOs would strengthen the AGN-GBH connection and could serve as powerful diagnostics of the black hole mass, and the structure of the X-ray emitting region in AGN.
keywords:
galaxies: active – galaxies: Seyfert: general – X-ray: galaxies1 Introduction
One of the most powerful approaches to studying Galactic Black Holes (GBHs), and X-ray binaries (XRBs) in general, is through X-ray timing. See van der Klis (1995, 2005) and McClintock & Remillard (2005) for detailed reviews. Perhaps the most widely used tool of time series analysis is the power spectrum, sometimes known as the power spectral density (PSD; see van der Klis 1989a for a thorough review of power spectral methods as applied to XRBs).
The power spectra of XRBs are usually described in terms of two types of variability The first is aperiodic variability, usually called ‘noise,’ which is often band-limited, meaning that the power spectrum is a broad continuum over a wide (but finite) frequency range. The second type of variation are quasi-periodic oscillations (QPOs). These represent a concentration of variability power over a limited frequency range, usually revealed by a well-resolved peak in the power spectrum111This type of variation should not be confused with strictly periodic oscillations, in which all the power in concentrated entirely at specific frequencies resulting in unresolved peaks in power spectra. Strictly periodic variations have been observed in neutron star XRBs, but not GBHs.. QPOs are one of the most powerful diagnostics of XRBs: they depend on the evolution of the source through different accretion states and the highest frequency QPOs are thought to be tracers of matter orbiting in the strongly curved spacetime around the black hole.
For many years it has been known that the radio-quiet Active Galactic Nuclei (AGN), and Seyfert galaxies in particular, show substantial X-ray variability (e.g. Barr & Mushotzky 1986; Lawrence et al. 1987). For almost as many years the X-ray variability characteristics of AGN have been compared to those of the better-understood GBHs (e.g. McHardy 1988). This comparison is based on the premise that the physics of accretion on to stellar-mass black holes ( ) should be essentially the same for accreting supermassive black holes ( ) that power AGN. Indeed, it has now been shown that the X-ray variations of Seyfert galaxies have noise power spectra that are remarkably similar to those of GBHs (see e.g. Edelson & Nandra 1999; Uttley, McHardy & Papadakis 2002; Markowitz et al. 2003; Vaughan, Fabian & Nandra 2003; McHardy et al. 2004, 2005). The available data are broadly consistent with the hypothesis that Seyfert galaxies possess the same noise power spectra as GBHs, but with much lower characteristic frequencies due to these frequencies scaling with , i.e. the characteristic variability timescales depend linearly on the mass (size) of the central black hole. Given this connection between the noise spectra of Seyferts and GBHs, it seems reasonable to suppose Seyfert galaxies might also possess X-ray QPOs similar to those of GBHs, albeit at accordingly lower frequencies. Curiously, despite improvements in observing sensitivity and scheduling flexibility, there are still no robust detections of X-ray QPOs in Seyferts, notwithstanding occasional claims to the contrary (see Benlloch et al. 2001; Vaughan 2005 and Vaughan & Uttley 2005 for discussions).
The purpose of this paper is to answer the following question: is the lack of X-ray QPO detections in Seyferts due to insufficient observational sensitivity or a genuine absence of QPOs in Seyferts? The latter would indicate an important difference between supermassive and stellar mass accreting black holes. The plan of the paper is as follows. Section 2 gives a very brief review of the two main QPO types commonly observed in GBHs and how these might appear if present in Seyfert galaxies. Section 3 uses the best available XMM-Newton observations of Seyferts to search for high frequency QPOs, and section 4 discusses whether long-term RXTE monitoring is capable of detecting low frequency QPOs. Finally, section 5 argues that the lack of a robust, positive detection of an X-ray QPO in a Seyfert is not inconsistent with the idea that at least some AGN possess QPOs similar to those of GBHs, and describes the observational improvements needed for more sensitive QPO searches.
2 What should we expect for AGN QPOs?
From an observational perspective QPOs are loosely defined as resolved peaks in the PSD (van der Klis 1989b). The QPOs commonly observed in GBHs are often described by a Lorentzian profile in the PSD,
| (1) |
where is the frequency of the Lorentzian, is the quality factor that determines its width () and is a normalisation factor giving the total strength of the QPO (for high values is approximately equal to the fractional rms amplitude of variability in the QPO). essentially denotes the coherence of the variation, becoming infinite in the strictly periodic case, though by definition this is never realised for QPOs. The distinction between a QPO and band limited noise becomes unclear for very broad profiles (), perhaps indicating a common physical origin for these features (e.g. Nowak 2000; Belloni, Psaltis & van der Klis 2002). However, for the purpose of the present discussion, QPOs shall be defined as those PSD components with (i.e. relatively coherent oscillations).
In simple terms, the Lorentzian profile is the PSD of an exponentially decaying sinusoid. However, the Lorentzian shape can be produced by a variety of different mathematical models, for example by a single oscillation that is perturbed in frequency, amplitude or phase, or through filtering a purely stochastic process (a broad-band noise spectrum) to suppress variability power below and above the peak frequency. Naturally, this insensitivity to the exact form of the light curves means that there is considerable scope for different physical models to produce QPOs; higher order statistics (beyond the power spectrum) may be required to distinguish between specific models for the origin of QPOs (e.g. Maccarone & Schnittman 2005). It is therefore simplest to use the empirical phenomenology of GBH QPOs to infer what might be expected to be observed in AGN, rather than assume a specific physical model of their origin.
There are two broad classes of QPO observed in GBHs: low frequency QPOs (LF QPOs) in the range mHz to Hz, and high frequency QPOs (HF QPOs) usually at frequencies Hz. HF QPOs are the highest-frequency variations yet observed from GBHs, with quasi-periods similar to the expected dynamical time-scales in the inner accretion disk. There is tentative evidence that HF QPOs occur at specific, fixed frequencies for each source, perhaps related to the black hole mass (Abramowicz et al. 2004; McClintock & Remillard 2005). They are relatively weak variations, with per cent rms, and values ranging from (see e.g. Remillard et al. 2002a). HF QPOs seem to be preferentially detected in the very high states of GBHs.
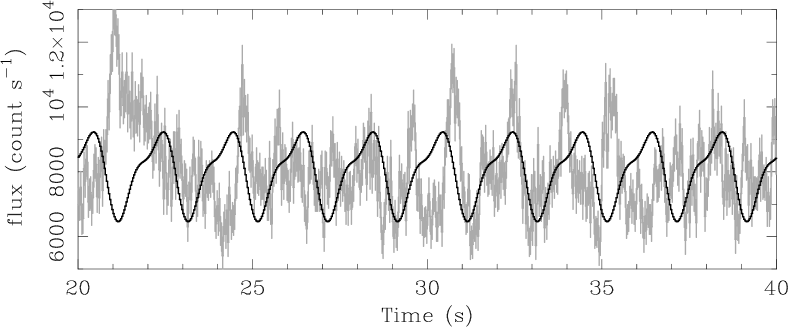
By contrast, the LF QPOs can be quite narrow () and strong (with per cent rms) and have been observed in both the low/hard and intermediate/very high states of GBHs. Such well-defined, strong peaks are much less common in the high/soft state. In any given source the frequencies of LF QPOs can vary substantially (but on time-scales of hours or more, which correspond to centuries or even longer for AGN). Because of this variability, similar LF QPOs can be observed over at least a decade range in frequency. In this paper only the strongest LF QPOs observed in GBHs, which are most likely to be detectable in AGN, will be considered. Figure 1 shows a short segment of an X-ray light curve of GRS 1915+105, a GBH, which showed a strong QPO at Hz, per cent and . The observation was made on 1996 Jul 23. The QPO also shows a weaker harmonic at Hz. This QPO was modelled in the time domain by fitting a sum of sinusoids to the single ‘cycle’ between and s on the time axis, and extrapolating the sinusoidal model to lower and higher times for comparison with the data. It is clear from the figure that the variations are neither strictly periodic nor do they show a well-defined profile. Even with this very strong, coherent QPO, observation of many ‘cycles’ is required before the quasi-periodicity can be distinguished from the aperiodic signal (i.e. the underlying band-limited noise).
If Seyfert galaxies (and AGN in general) are the supermassive analogues of GBHs, and show similar broad-band noise variability in X-rays, it seems plausible that Seyferts should also show similar QPOs to those seen in GBHs. The simplest hypothesis is that the QPOs retain the same relative strengths and shapes (i.e. same and ) as seen in GBHs, but with greatly reduced frequencies due to the inverse scaling of frequency with black hole mass. For LF QPO frequencies of order Hz in GBHs, assuming a typical black hole mass of , the analogous LF QPOs in a Seyfert galaxy should occur around Hz (i.e. timescales of ks). For HF QPOs, the Hz QPO in GRO J1655-40 (Strohmayer 2001) was taken as being representative of the class. Assuming a black hole mass of (Shahbaz et al. 1999), the inverse scaling between frequency and black hole mass yields an expected frequency of Hz (i.e. timescales s) for the analogous HF QPO in Seyfert galaxies.
The other important point to consider when comparing AGN and GBHs is the energy range involved. QPOs tend to have relatively hard spectra in GBHs, i.e. the relative amplitude of the QPO increases with energy through the keV band (e.g. Belloni et al. 1997; Tomsick & Kaaret 2001). As no QPOs have been detected in AGN, the energy of the peak amplitude of the QPOs (if they exist) is unknown, but, assuming QPOs are associated with the non-thermal X-ray emission component they should occur within the bandpass of current X-ray missions (e.g. keV for XMM-Newton and keV for RXTE) since over these energy ranges AGN spectra are dominated by the non-thermal component. See Done & Gierlinski (2005) for a discussion of some other effects of bandpass on the comparison between GBHs and AGN.
In the following two sections existing and simulated data are used to test whether these LF and HF QPOs could be detected if they are present in the Seyfert galaxies which have been most intensively observed in X-rays.
3 Can we detect high frequency QPOs?
According to the arguments given above, a low mass Seyfert galaxy ( ) could be expected to show a HF QPO at mHz frequencies. These are accessible using XMM-Newton long-look observations which span ks with uninterrupted sampling and high signal-to-noise, and constrain the variability on timescales as short as s. The XMM-Newton long-looks reliably constrain the PSD over a range of Hz.
In order to test whether a HF QPO could be present in existing Seyfert data, the three orbit XMM-Newton observation of the bright Seyfert 1 galaxy MCG6-30-15 was extracted from the public archive. These data represent the longest XMM-Newton observation of a Seyfert galaxy performed to date. The PSD of these data was originally presented by Vaughan et al. (2003). For the present analysis a background-subtracted light curve of the source was produced in the keV band with -s time bins.
A periodogram (the modulus squared of the Fourier transform) was computed for each orbit of data. The three orbits were then combined and the resulting periodogram was averaged over frequency bins to produce a power spectrum estimate. The data were normalised to units of (see van der Klis 1997). This normalisation is such that integrating the PSD between two frequencies gives the variance, relative to the mean flux, within that frequency range.
The binning was logarithmic in frequency, meaning that bins cover a range where is a constant that defines the resolution of the data. [The frequency bins are therefore equally spaced in logarithmic frequency by .] The only other constraint is that a minimum of periodogram points were included in each bin in order to obtain reasonable estimates of the mean power and its uncertainty (see Papadakis & Lawrence 1993). The fractional resolution of the binned data is therefore kept roughly constant, meaning that a QPO of fixed width, , will occupy the same number of bins over the frequency range of the PSD. The search for QPOs is made more sensitive by binning the data so that the frequency resolution matches the expected width of the QPO being sought (see section 5.3 of van der Klis 1989). In the present analysis the binning was optimised to search for QPOs with (i.e. ) which seems to be typical for GBHs (Remillard et al. 2002a,b). The resulting PSD is shown in Fig. 2.

As reported by Uttley et al. (2002), Vaughan et al. (2003) and most recently (with new long-term monitoring data) by McHardy et al. (2005), the PSD of MCG6-30-15 is adequately explained by a simple broken (or bending) power law model. A broken power law was fitted by adjusting the parameters of the model to minimise the statistic. For the present analysis the best fit was obtained using standard minimisation of an analytical model, rather than through Monte Carlo simulations (see Uttley et al. 2002; Vaughan et al. 2003). This latter approach more fully accounts for distortions on the continuum PSD due to spectral leakage effects, which can alter the continuum slope (aliasing is not a problem for the XMM-Newton long-looks because the data are contiguously sampled). The much faster method of direct fitting of an analytical model was used in the present analysis since the sampling distortions should not substantially affect the detectability of HF QPOs. The broken power law model (plus a constant Poisson noise background level) provided a good fit to the data ( for degrees of freedom, dof) with a break timescale consistent with that previously measured by Vaughan et al. (2003). Both an exponentially cut-off power law and a smoothly bending power law (McHardy et al. 2004) provided worse fits.

The simple broken power law model provided a satisfactory fit to the data and, significantly, there were no obvious systematic residuals to indicate the presence of a QPO (bottom panel of Fig. 2). Therefore, in order to constrain the strength of any possible weak QPOs a Lorentzian was included in the model with a quality factor . Figure 3 shows the contours for QPO strength () against frequency, over the useful bandpass of the data ( Hz). These values represent approximate and per cent joint confidence regions on the frequency and power of a QPO. The contours show that a QPO above a few mHz is constrained to have (corresponding to a total QPO strength of per cent rms).
Vaughan et al. (2003) estimated a mass for MCG6-30-15 of based on comparing the PSD break frequency to that of Cyg X-1. This estimate was refined by McHardy et al. (2005), who also included estimates based on host galaxy gas kinematics and photoionisation modelling, to arrive at a figure of . Assuming a mass of the expected frequency of a HF QPO is Hz. As shown in figure 3, around this frequency range a QPO of strength per cent cannot be ruled out. The data are more sensitive to QPOs at high frequencies, but even there a per cent QPO would have been difficult to detect (the data are more sensitive to narrower QPOs, so if the constraint on is tighter).

The above analysis was repeated for the single-orbit XMM-Newton long-looks at the highly variable Seyfert 1 galaxies NGC 4051, NGC 4395 and Mrk 766. These light curves have previously been discussed by McHardy et al. (2004), Vaughan et al. (2005) and Vaughan & Fabian (2003), respectively. The black hole mass for NGC 4051 is thought to lie in the range (Shemmer et al. 2003), which would correspond to a HF QPO frequency of mHz. For NGC 4395 the black hole mass is much lower, lying in the range (Filippenko & Ho 2003). This corresponds to a HF QPO frequency of mHz. For Mrk 766 the black hole mass is probably in the range based on its optical emission and absorption line widths (using the stellar velocity dispersion from Botte et al. 2005, and the relation of Tremaine et al. 2002, gives ). Therefore, for Mrk 766 a HF QPO might be expected to appear around mHz.
In each case a broken power law provided an acceptable fit to the XMM-Newton PSD with fitted parameters similar to those of the previous analyses (cited above). Neither Mrk 766 not NGC 4395 show any QPO-like residuals. For Mrk 766 the strength of a QPO was constrained to be per cent rms, at frequencies above a few mHz, while for NGC 4395 the limits were slightly worse owing to the much lower mean count rate in that source (which raises the Poisson noise level of the power spectrum).
The binned PSD for NGC 4051 was reasonably well fitted by a broken power law ( for dof). Interestingly, the data/model residuals showed a positive excess at mHz which could indicate a HF QPO. After adding a Lorentzian (with ) to the model to fit the residual feature, the fit improved dramatically, from to (for the addition of two free parameters, centroid frequency and normalisation). However, it may be that these residuals are caused by the use of an inappropriate continuum model rather than a genuine QPO.
McHardy et al. (2004) performed a simultaneous analysis of this XMM-Newton observation and long-term RXTE monitoring data and found a bending power law model gave the best fit to the broad band power spectrum. The low frequency slope, constrained by the RXTE data, was . Thus, in order to better model the continuum power spectrum a bending power law was fitted, with a low frequency slope fixed at . This gave for dof, a slight improvement over the broken power law. Including an additional Lorentzian QPO in the model, at Hz with a fixed width (), improved the fit to for dof. The strength of the Lorentzian was per cent, which is plausible for a HF QPO. An -test yields a probability of only for this improvement222 As noted by Protassov et al. (2002), the -test is often inappropriate for calculating the significance of additive features such as QPOs, due to the null values of the additional parameters lying on the boundary of the possible parameter space. In the present context the only additional free parameter was the Lorentzian normalisation, which was allowed to be positive or negative, hence the null value (zero) was formally not on the boundary. The probability was then adjusted for the number of possible trials (frequencies searched). . However, this does not account for the number of frequencies searched. A lower limit on this is the number of bins, in this case . A lower limit on the ‘global’ probability for the QPO candidate is therefore , using . Taken on its own this indicates a possible QPO detection at per cent confidence. One should, however, also account for confirmation bias: this is the best QPO candidate found from an analysis of four datasets. The significance should therefore be more accurately considered as per cent, not strong enough to be considered a confident detection of a HF QPO. However, this does illustrate that QPOs with strengths of order per cent rms are only just below the sensitivity of the available data. The analysis of these data by McHardy et al. (2004) used much coarser frequency binning and therefore therefore was not sensitive to this fairly narrow feature. But the presence of a QPO does not substantially affect the results of that analysis. Even after allowing for a Lorentzian HF QPO in the XMM-Newton data, the bend frequency was Hz, consistent with the value of Hz measured by McHardy et al. (2004) using the combined RXTE and XMM-Newton data.
Figure 5 shows the limits on the QPO strength over the available frequency bandpass (calculated as for figure 3, assuming no QPOs are present).

These power spectral fitting results suggest that the best available high frequency data from XMM-Newton can rule out strong ( few per cent), narrow () HF QPOs at the expected frequencies. However, the data are not quite sensitive enough to detect weaker QPOs ( per cent) with confidence.
4 Can we detect low frequency QPOs?
In the case of LF QPOs, the expected quasi-periods in Seyferts (assuming scaling from a Hz QPO in a 10 GBH) are of the order of days–months (for – black holes) and therefore require reasonably well-sampled long-term X-ray monitoring to have any chance of being detected. Such monitoring has been obtained by RXTE since it began operating in 1996. The All-Sky Monitor (ASM) on RXTE is not sensitive enough to accurately monitor Seyfert galaxies (see e.g. Uttley et al. 2002), and so pointed observations are required. In order to maximise the PSD frequency-bandwidth while reducing the required observing time, the highest-quality RXTE Seyfert monitoring light curves consist of ks duration pointed observations following several different temporal sampling patterns which cover a range of sampling intervals, from a few hours to several days (e.g. see Markowitz et al. 2003; McHardy et al. 2004, 2005). With these data, it has been possible to show that all Seyfert PSDs measured to date are consistent with simple power laws or (in the majority of cases) broken or bending power laws (e.g. Uttley et al. 2002; Markowitz et al. 2003; McHardy et al. 2004, 2005). Therefore, there is as yet no firm evidence for LF QPOs in Seyfert X-ray light curves. However, it is important to understand whether LF QPOs could even have been detected using the best existing RXTE monitoring data to date, if they are present in the light curves.
Simulations were used to answer this question. X-ray light curves were generated with the same PSD shape as actually observed in GRS 1915+105, except scaled down in frequency by the ratio of black hole masses. For the input ‘true’ PSD shape, the keV PSD of the 1997 Feb 9 RXTE observation of GRS 1915+105 was chosen, as this showed a very prominent QPO at Hz (with per cent, ). Fig. 6 shows the PSD of this observation, in units of frequencypower to better highlight the QPO. The QPO is one of the strongest observed in GRS 1915+105 at this relatively high (for a LF QPO) frequency; the combination of high fractional rms and relatively high frequency (and hence more observed cycles) should make it more easily detectable with the existing RXTE monitoring sampling patterns. To obtain the power at each Fourier frequency in the simulation the observed PSD was interpolated between adjacent bins, and above a frequency of 15 Hz where the observed GRS 1915+105 PSD becomes noisy, the PSD was extrapolated using the best-fitting Hz power law (index of ). Light curves with this PSD were simulated using the method of Timmer & König (1995).

Arguably the highest-quality long-term monitoring data obtained to date is for the Narrow Line Seyfert 1 NGC 4051 (McHardy et al. 2004), which RXTE has monitored for more than 8 years, including observations every 2 days over the last 4 years, as well as a two month period of observations every 6 hours. The exact sampling pattern of the NGC 4051 monitoring was used to simulate the Seyfert light curve. In addition, a single ‘long-look’ light curve, of duration ks, with continuous sampling binned into s time intervals, was included to simulate an XMM-Newton observation (which can constrain the PSD at high-frequencies), since many of the Seyferts with good RXTE monitoring have also been observed by XMM-Newton. Although the LF QPOs will occur at lower frequencies than can be observed by a single XMM-Newton orbit, the continuous sampling of the data constrains the high-frequency shape of the PSD, allowing aliasing effects (which distort the RXTE PSD) to be better constrained, and permitting better detection of any sharp features above a broader PSD continuum.
The input PSD was rescaled by a factor in frequency, corresponding to a ‘typical’ Seyfert black hole mass of (Peterson et al. 2004), and from this a continuous light curve with s resolution was simulated and re-sampled to match the sampling patterns described above. In order to demonstrate the effects of the intrinsic stochastic character of the light curve on detecting a QPO, the effects of photon counting statistics were neglected. In any case, the effects of counting statistics on the highest-quality AGN PSDs measured to date are negligible, except at the highest frequencies (comparable to the s sampling used here). The psresp Monte Carlo method of Uttley et al. (2002) was then used to fit models to the observed PSDs (see also Markowitz et al. 2003, McHardy et al. 2004).
The simulated ‘observed’ PSD is shown in Figure 7, together with the best-fitting broken power law continuum model, assuming a low-frequency slope which was fixed at (i.e. similar to that observed at low frequencies in the GRS 1915+105). To aid the comparison, the simulated Seyfert data is plotted on the same relative scale as the GRS 1915+105 data (Fig. 6), with the frequencies scaled down by a factor of . Note that this model represents only a noise continuum spectrum and contains no QPOs. The figure shows the ‘unfolded’ PSD, i.e. data points have been plotted against the best-fitting model in terms of their positions relative to a model that has been distorted by sampling effects. By analogy with plotting an X-ray spectrum which is unfolded through the instrumental response with respect to an assumed spectral model, the effects of unfolding the PSD are relatively model-independent for the broad continuum model used here. The fitted model has a break at Hz (cf. the QPO frequency of Hz) and high-frequency slope of , and is formally acceptable ( per cent of simulated data sets with the same broken power law model parameters showed worse fits, defined in terms of a statistic, than the ‘observed’ data333See Uttley et al. (2002) for more details of the goodness-of-fit calculation.).

Clearly the strong, sharp QPO that is present in the ‘true’ PSD (Fig. 6) could not be easily discerned in the PSD of the simulated Seyfert data (Fig. 7). This lack of sensitivity to the QPO occurs for two reasons. Firstly, the QPO is spread by the redistribution of power (aliasing) caused by the intermittent sampling and finite duration of the intensive 6-hourly monitoring (e.g. see van der Klis 1989a and Uttley et al. 2002 for discussion of aliasing). Secondly, the error bars on the data are large in the frequency range of interest, because the 2-month duration of the 6-hourly monitoring did not span many cycles of the variability at those frequencies. Even extending the high-frequency end of the low-frequency (long-term monitoring) component of the total PSD to the maximum (Nyquist) frequency ( Hz) of the 2-day sampled monitoring (which lasted 4 years) does not improve the sensitivity to the QPO, because aliasing effects are substantially increased.
The test was repeated using different frequency scalings for the QPO, i.e. to allow for different black hole masses and the range of observed QPO frequencies in GRS 1915+105, but in no case was the QPO clearly distinguishable from a broader broken power law PSD. At lower frequencies, there were too few QPO cycles and error bars are larger, while at higher frequencies the sampling is not sufficiently dense and aliasing effects wash out the sharp QPO peak. Clearly, even this strong QPO could not have been detected if present in the best existing Seyfert monitoring data.
5 Discussion and conclusions
5.1 Where are the AGN QPOs?
The similarities between the variability properties of AGN and GBHs lead us to expect, by analogy, that some AGN will show QPOs similar to those observed in GBHs but at much lower frequencies. This expectation does depend on the physical mechanisms for QPO generation being similar in AGN and GBHs, but there is no clear theoretical reason to expect otherwise. Therefore, given the limits on the strength of any HF QPOs and simulations of LF QPOs presented above, it is possible to answer why the best, presently available (XMM-Newton and RXTE) data have not revealed the expected QPOs.
5.1.1 High-frequency QPOs
In the case of HF QPOs, the most obvious reason why they have not yet been observed is that the current observations are not sensitive enough to detect them, even if they are present.
Even for the most variable AGN so far observed with XMM-Newton – which probably have low black hole masses and hence the HF QPOs should be well-sampled by XMM-Newton (with typically cycles) – the observations are only sensitive to QPO strengths of per cent. Given that many detected HF QPOs in GBHs are less coherent than the assumed and that HF QPO strengths greater than a few per cent are not very common, it is perhaps not surprising that none were detected in the Seyfert light curves.
In order to detect a QPO in a time series, the series must be sufficiently long that is spans many cycles of the quasi-period. The number depends on the width of the QPO, but a general rule-of-thumb, based on the analysis of section 3, is that considerably more than quasi-periods must be observed before the errors on the PSD are small enough to distinguish weak HF QPOs from sampling fluctuations in the underlying aperiodic noise spectrum. (The signal must be sampled at more than twice the peak frequency of the QPO otherwise the QPO falls above the Nyquist frequency of the PSD, which is not directly measured and is aliased onto the wrong frequencies.) It would therefore be sensible to treat with caution any claim of quasi-periodic variations in AGN light curves that is based on only a small number of cycles of the claimed QPO peak frequency.
HF QPOs are rather rare even in GBH light curves; they have been detected in per cent of observations in less than of GBH candidates (see tables in Remillard et al. 2002a,b; McClintock & Remillard 2005). Although not often present, HF QPOs in GBHs appear to be confined to sources in the ‘very-high’ state, an apparently distinct accretion state which shows X-ray spectra with a strong, steep power law component and in some cases a strong thermal component also (McClintock & Remillard 2005; van der Klis 2005). If the AGN observed to date are not in this state (which most likely corresponds to high accretion rates), perhaps HF QPOs would not be expected.
Another factor which may reduce the likelihood of observing HF QPOs in AGN light curves, at least in XMM-Newton data, is the fact that the HF QPO strength increases towards higher X-ray energies (Strohmayer 2001; Remillard 2002a) whereas XMM-Newton is most sensitive in the soft X-ray band (2 keV). Unfortunately, most GBHs are quite heavily obscured in soft X-rays by large Galactic column densities ( cm-2; McClintock & Remillard 2005) so that it is not possible to say for certain what their timing properties are at low energies, but simple extrapolation from the energy-dependent behaviour above 2 keV would suggest that their soft X-ray QPO strengths are even weaker than are observed at higher energies.
Of course, absence of evidence is not evidence of absence. It is not possible to rule out the possibility that weak ( per cent) and/or low-coherence () QPOs might exist in AGN, or that transient QPOs might exist in AGN that are not easily detected in GBHs (especially if their frequencies are variable). However, since the ubiquitous aperiodic variability can easily mimic apparent quasi-periodicities one must be careful in assessing whether these apparent signals are significant and represent QPOs in any meaningful sense. Any claimed QPOs must be coherent and long-lasting enough that they form peaks that lie significantly above the expected statistical variations in the continuum level of the PSD (e.g. see Benlloch et al. 2001, Vaughan 2005).
5.1.2 Low-frequency QPOs
Despite the fact that LF QPOs are typically much stronger than the HF QPOs, the detection of LF QPOs is made difficult by the relatively sparse sampling of the available monitoring light curves, which although excellent for constraining the shapes of broad continua, are not intensively sampled for long enough to detect even strong QPOs. However, despite this lack of sensitivity it is interesting to note that the broad-band shape of the simulated PSD shown in Figure 7 is quite distinctive, showing a strong deficit in low-frequency power (i.e. the power is clearly band-limited) and is similar to the broad continuum shape of the input PSD. Therefore, with data like Fig. 7, a PSD similar to that of GRS 1915+105 on 1996 Feb 9, which shows a strong QPO, might be mistaken for a PSD like that of GBHs in the low/hard state, which have a similar band-limited PSD shape (e.g. McClintock & Remillard 2005; van der Klis 2005). Currently, two AGN show evidence for a band-limited PSD shape with a low-frequency cut-off in power: the broad line Seyfert NGC 3783 (Markowitz et al. 2003) and the NLS1 Ark 564 (Pounds et al. 2001; Papadakis et al. 2002; Markowitz et al. 2003). These AGN may be good candidates for future LF QPO searches with longer periods of intensive sampling.
Of the other AGN, NGC 4051 and MCG6-30-15 show the highest-quality PSDs, with relatively short characteristic time-scales so that any low-frequency cut-offs similar to that seen in Figure 7 should be easily observed. In fact, these PSDs show no evidence for low-frequency cut-offs, instead showing flickering extending down to the lowest observed frequencies ( Hz), a fact which makes them appear similar to the PSDs of certain GBHs (e.g. Cyg X-1) in the high/soft state.
5.2 How might AGN QPOs be detected in the future?
5.2.1 High-frequency QPOs
The two characteristics of the observations that most strongly affect the sensitivity to QPOs are count rate (more specifically, the signal-to-noise of the source fluxes) and the length of the observation. (If the sampling is not contiguous then the sampling pattern will also be an important factor.) The frequency of the QPO relative to the other components present in the spectrum determines which of these two is dominant. If the Poisson noise is the strongest continuum component at the QPO frequency (i.e. at the Poisson noise level is above the intrinsic red noise continuum power) then the sensitivity to QPOs is a strong function of the count rate. The Poisson noise level is inversely proportional to the count rate, meaning a larger telescope collecting area will drastically reduce the Poisson noise level, revealing weaker QPOs. As discussed by van der Klis (1989b), the significance (in units of sigma) at which a QPO can be detected against a Poisson noise background is given approximately by , where is the mean count rate, is the QPO strength, is the observing time and is the width of the QPO.
If however the intrinsic red noise is greater than the Poisson noise at the QPO frequency (i.e. the dominant source of noise is the aperiodic variability of the source), then reducing the Poisson noise level with a larger telescope will have little effect. (In essence the signal-to-noise is already good enough that Poisson noise is not the main contaminant at the QPO frequency.) In this case the most important factor is the number of cycles observed, i.e. the duration of the observation, or the number of repeat observations. The errors on the PSD (binned over a fixed frequency range) scale as . A large increase in the total amount of data will reduce the sampling fluctuations in the measured red noise continuum, allowing weak QPOs to be detected.
Figure 8 and illustrate these two effects. The figures show simulated PSDs for NGC 4051 generated using a broken power law continuum and a QPO at Hz (with ), and including Poisson noise at the appropriate level. This QPO model was chosen to correspond to the feature in the NGC 4051 data discussed in section 3, which is plausible for a HF QPO but is not a significant detection based on the existing data. The QPO is at a frequency where the power density in the intrinsic red noise is comparable to the Poisson noise level in the XMM-Newton observation. Panel shows the PSD derived from orbits of XMM-Newton data, with a combined exposure time of Ms. Panel shows the PSD derived from a simulation of a ks observation with the Wide-Field Imager (WFI) camera on-board ESA’s proposed next generation X-ray telescope, XEUS, with a collecting area of order m2 (Parmar et al. 2001)444 The XEUS WFI count rate was estimated by fitting the XMM-Newton EPIC NP spectrum with a simple model and convolving this with the publically available XEUS response matrices available from ftp://www.rssd.esa.int/pub/XEUS/RESPONSE/ . The errors in the continuum PSD are reduced using the several XMM-Newton orbits, but the Poisson noise level stays the same, whereas the Poisson noise level is greatly reduced using the same observation length but a much larger collecting area. It is clear from the figures that both of these observations are capable of detecting the QPO, with very high confidence, but the many-orbit XMM-Newton observation provides the best detection, despite the Poisson noise level being a factor higher than in the XEUS data.


5.2.2 Low frequency QPOs


In order to detect LF QPOs, observed AGN light curves must satisfy two criteria: they must have a long duration, so that QPO cycles can be sampled, and they must have good sampling, so that sharp QPO features are not smeared out by aliasing effects. Enormous amounts of on-source observing time are required to satisfy these criteria, so that LF QPO detection programmes will be prohibitively expensive for pointed observations. Instead, the detection of LF QPOs in AGN can be achieved relatively cheaply by future, sensitive X-ray All-Sky Monitors (ASMs).
The power of long-baseline, continuous observations of AGN with ASMs was demonstrated using simulations. Artificial time series were generated using the same input PSD as used in Section 4 (i.e. assuming a black hole), sampled on 1-d time-scales over baselines of 2 years, 5 years and 10 years. Since the data are continuously sampled on day time-scales, aliasing effects are negligible, the data can be binned in frequency and fitted in the same way as for continuous long-look observations (see Section 3). In order to test the significance of the QPO detections, a broken power-law was first fitted (with all parameters left free) as a null hypothesis, to which Lorentzian QPO features were added to model the QPO fundamental and harmonic. The -test was used to determine if the QPO features are required by the data. The simulated PSDs (and best-fitting broken power-law models) are shown in Figure 9.
For the PSD measured over a 2-year baseline, a Lorentzian QPO at Hz was required by the data at 99.5 per cent confidence, from a naïve application of the -test ( for 2 additional free parameters, FWHM and normalisation). The number of frequencies searched should be accounted for separately, by adjusting the confidence level to account for the number of trials (e.g. see Vaughan 2005). Since the QPO feature contributes primarily to 2 out of 14 frequency bins (see Figure 9), the actual confidence limit, with no a priori expectation of a QPO at that frequency is more like per cent (i.e. a 2- detection).
Extending the baseline of the simulated light curve to 5 years, the QPO at Hz was detected at per cent confidence (i.e. -) after accounting for the number of bins sampled, although the harmonic could not be significantly detected. Finally, for the 10-year baseline simulation the QPO fundamental [at Hz] was required at per cent confidence (i.e. -), and the harmonic is detected at twice the fundamental frequency at per cent confidence. Considering the number of sources which will be monitored by a sensitive ASM (and hence the increased likelihood of ‘false alarm’ detections), we should require a QPO signal to be detected at the 3- level or better to be considered robust. Therefore continuous monitoring of sources for 5 years is probably required to significantly detect the presence of the anticipated LF QPOs, while monitoring for 10 years can reveal additional information such as the presence of higher harmonics.
Note that the effects of photon counting statistics were not included in the simulations, which were intended to show the minimum temporal baselines required for detection of the QPO signals. However, the effects of counting statistics on LF QPO detection should be negligible for future ASMs. To demonstrate this fact, the PSDs plotted in Figure 9 show the expected noise levels for sources which are detected at the 10- level in one day, which corresponds to the sensitivity to bright (few erg cm2 s-1) AGN for the proposed Lobster soft X-ray ASM (Priedhorsky, Peele & Nugent 1996; Fraser et al. 2002) and EXIST hard X-ray ASM (Grindlay 2004). Since these instruments can integrate flux on longer time-scales than one day and thus observe fainter AGN, the sample of AGN where LF QPOs (if they exist) could be detected will number in the hundreds, provided the temporal baselines for monitoring are long enough to discern LF QPOs from broken power-law PSDs.
In all the simulations, LF QPO frequencies can be very accurately constrained (to within a few per cent). If additional calibrations can be found to account for the range of possible LF QPO frequencies555In GBHs there is a tight correlation between LF QPO frequency and X-ray spectral index (Vignarca et al. 2003, and see Titarchuk & Fiorito 2004 for a theoretical interpretation). Therefore the X-ray spectral shape may also be a good calibrator of QPO frequency in AGN. then the detection of LF QPOs in AGN PSDs could afford highly accurate estimates of the AGN black hole mass.
Finally, it is worth considering the types of AGN that might be expected to show LF QPOs. Since strong LF QPOs are not observed in GBHs in the high/soft state, but are observed sometimes in the low/hard state and rather frequently in the very high state (e.g. McClintock & Remillard 2005), it is likely that they will be observed in AGN in the equivalent states (if they exist). Since GBHs in the low/hard and very high states can show relatively strong jet emission, radio-loud AGN (and also low-luminosity AGN which are relatively radio-loud) may be the best candidates for these states in AGN [e.g. as recently noted by Jester (2005) and Nagar et al. (2005)] and hence may be the most promising sources to detect LF QPOs.
5.3 Concluding remarks
The above discussion may read as if X-ray timing studies of AGN will always be inferior to those of GBHs. However, in some respects AGN can provide data that are superior to those from the much faster and brighter GBHs. A Seyfert galaxy with is expected to show characteristic variability timescales that are longer than those of a GBH, but the X-ray flux of a typical Seyfert galaxy is only a factor smaller than that of a typical GBH. Therefore, a Seyfert galaxy can provide more photons per characteristic timescale. This much higher counts/timescale rate means that if QPOs can be detected in AGN it should be possible to directly observe the wave-form (in the time domain) with far greater precision than is possible for GBHs. This could in principle allow the details of the X-ray emitting region to be constrained in a manner analogous to modelling of neutron star hot spots (e.g. Weinberg et al. 2001).
The existing XMM-Newton data for the best studied Seyferts (see e.g. Fig 2 and 4) already surpass the best GBH data in terms of measuring the PSD at the very highest frequencies. The XMM-Newton long-looks constrain the intrinsic red noise PSDs up to frequencies at least as high as mHz, which is equivalent to the light-crossing time of gravitational radii for a Seyfert galaxy such as MCG6-30-15 (). For a GBH with the frequency corresponding to the light-crossing time of gravitational radii is kHz, which remains out of reach with current observations (see e.g. Revnivtsev et al. 2000). In this way, X-ray timing studies of AGN and GBHs do offer complimentary views of accretion on to black holes.
Acknowledgements
This thank an anonymous referee for a thorough and constructive referees report. Based on observations obtained with XMM-Newton, an ESA science mission with instruments and contributions directly funded by ESA Member States and the USA (NASA). SV thanks the PPARC for financial support. PU acknowledges support from the National Research Council Research Associateships program.
References
- [1] Barr P., Mushotzky R. F., 1986, Nature, 320, 421
- [2] Belloni T., Psaltis D., van der Klis M., 2002, ApJ, 572, 392
- [3] Benlloch, S., Wilms, J., Edelson, R., Yaqoob, T., Staubert R. 2001, ApJ, 562, L121
- [4] Botte V., Ciroi S., De Mille F., Rafanelli P., Romano A., 2005, MNRAS, 356, 789
- [5] Edelson R., Nandra K., 1999, ApJ, 514, 682
- [6] Filippenko A. V., Ho L. C., 2003, ApJ, 588, L13
- [7] Frank J., King A., Raine D., 1985, Accretion Power in Astrophysics, Cambridge Univ. Press (Cambridge)
- [8] Fraser G. W., et al. , 2002, Proc. SPIE, 4497, 115
- [9] Grindlay J. E., 2004, X-Ray Timing 2003: Rossi and Beyond, eds. P. Kaaret, F. K. Lamb, J. H. Swank, AIP Conference Proceedings, vol. 714, Melville (NY: AIP), p413 (astro-ph/0403539)
- [10] Jester J., 2005, ApJ, 625, 667
- [11] Lawrence, A., Watson, M. G., Pounds, K. A., Elvis, M. 1987, Nature, 325, 694
- [12] Leahy D. A., Darbro W., Elsner R. F., Weisskopf M. C., Kahn S., Sutherland P. G., Grindlay J. E., 1983, ApJ, 266, 160
- [13] Maccarone T. J., Schnittman J. D., 2005, MNRAS, 357, 12
- [14] McClintock, J. E., Remillard, R. A. 2005, in Compact Stellar X-ray Sources, ed. Lewin, W. H. G., van der Klis, M., Cambridge University Press (Cambridge), in press, chapter 4 (astro-ph/0306213)
- [15] McHardy I. M., 1988, X-ray Astronomy with EXOSAT, ed. R. Pallavicini, N. E. White, Mem. Soc. Astr. It., 59, 239
- [16] McHardy I. M., Papadakis I. E., Uttley P., Page M., Mason K., 2004, MNRAS, 348, 783
- [17] McHardy I. M., Gunn K. F., Uttley P., Goad M. R., 2005, MNRAS, 359, 1469
- [18] Markowitz A. et al. 2003, ApJ, 593, 96
- [19] Muno M. P., Remillard R. A., Morgan E. H., Waltman E. B., Dhawan V., Hjellming R. M., Pooley G., 2001, ApJ, 556, 515
- [20] Nagar N. M., Falcke H., Wilson A. S., 2005, A&A, 435, 521
- [21] Nowak M. A., 2000, MNRAS, 318, 361
- [22] Papadakis I. E., Lawrence A., 1993, MNRAS, 261, 612
- [23] Papadakis I. E., Lawrence A., 1995, MNRAS, 272, 161
- [24] Parmar A. N., et al. , 2001, in X-ray Astronomy: Stellar Endpoints,AGN, and the Diffuse X-ray Background., eds. N. E. White, G. Malaguti, G. G. C. Palumbo, AIP Conference Proceedings, 599, 842
- [25] Peterson B M., et al., 2004, ApJ, 613, 682
- [26] Priedhorsky W. C., Peele A. G., Nugent K. A., 1996, MNRAS, 279, 733
- [27] Protassov R., van Dyk D. A., Connors A., Kashyap V. L., Siemiginowska A., 2002, ApJ, 571, 545
- [28] Remillard R. A., Muno M. P., McClintock J. E., Orosz J. A., 2002a, in New Views on Microquasar, ed. Ph. Durouchoux, Y. Fuchs, and J. Rodriguez, Center for Space Physics: Kolkata (India), 49 (astro-ph/0208402)
- [29] Remillard R. A., Muno M. P., McClintock J. E., Orosz J. A., 2002b, ApJ, 580, 1030
- [30] Revnivtsev M., Gilfanov M., Churazov E., 2000, A&A, 363, 1013
- [31] Shahbaz T., van der Hooft F., Casares J., Charles P. A., van Paradijs J., 1999, MNRAS, 306, 89
- [32] Shemmer O., Uttley P., Netzer H., McHardy I. M., 2003, MNRAS, 343, 1341
- [33] Strohmayer T. E., 2001, ApJ, 552, L49
- [34] Timmer J., König M. 1995, A&A, 300, 707
- [35] Titarchuk L., Fiorito R., 2004, ApJ, 612, 988
- [36] Tomsick J. A., Kaaret P., 2001, ApJ, 548, 401
- [37] Tremaine S., et al. 2002, ApJ, 574, 740
- [38] Uttley, P., McHardy, I. M., Papadakis, I., 2002, MNRAS, 332, 231
- [39] van der Klis, M. 1989a, in Timing Neutron Stars, ed. H. Ogelman, E. P. J. van den Heuvel, Kluwer (Dordrecht), NATO ASI Series C 262, p27
- [40] van der Klis, M. 1989b, ARA&A, 27, 517
- [41] van der Klis, M. 1995, in X-ray Binaries, ed. W. H. G. Lewin, J. van Paradijs, E. P. J. van den Heuvel, Cambridge Univ. Press (Cambridge), p252
- [42] van der Klis M., 2005, in Compact stellar X-ray sources, ed., W. H. G. Lewin, M. van der Klis, Cambridge University Press (Cambridge), in press, chapter 2 (astro-ph/0410551)
- [43] Vaughan S., 2005, A&A, 431, 391
- [44] Vaughan S., Fabian A. C., Nandra K., 2003a, MNRAS, 339, 1237
- [45] Vaughan S., Fabian A. C., 2003, MNRAS, 341, 496
- [46] Vaughan S., Iwasawa K., Fabian A. C., Hayashida K., 2005, MNRAS, 356, 524
- [47] Vaughan S., Uttley, P., 2005, Adv. Space Res., in press
- [48] Vignarca F., Migliari S., Belloni T., Psaltis D., van der Klis M., 2003, A&A, 397, 729
- [49] Weinberg N., Miller M. C., Lamb D. Q., 2001, ApJ, 546, 1098