Separating C-stars from Dust in the Central Region of the Seyfert 2 Galaxy NGC 1241
Abstract
The Sy 2 galaxy NGC 1241 presents a 1.5 kpc large circumnuclear ring of star formation (CNR) embracing a small bar plus leading arms. Those structures are P emitters, but barely seen in H. It presents also stellar trailing arms inside the CNR. GEMINI and HST imagery allow the construction of high resolution and color maps as well as a vs. color-magnitude diagram (CMD) of this complex region. The CNR is heavily obscured in V, but a fairly transparent window appears in the direction of the nucleus. Nonetheless, the nucleus presents a color that is redder than the CNR. The CNR is composed of extremely young HII regions still enshrouded in their dust cocoons. However, the nuclear color can not be explained in this manner. Therefore, we propose the contribution of C-Stars as the most feasible mechanism for explaining the colors. If the nuclear stellar population is comparable to that of the LMC bar, 500 C-stars and 25000 AGB O-rich stars inside 50 pc may reproduce the observed colors. C-Stars release enriched material to the nuclear environment, probably fueling the central engine of this Sy 2 galaxy during the lifetime of stars with masses between 2 M⊙ MC-star 6 M⊙ (C-star phase). The ejected material that remains trapped in the central potential might also explain the systematically observed increased strength of the optical CN-bands in Sy 2 galaxies and is consistent with the significant contribution of intermediate age stars to the optical continuum of low luminosity AGNs.
1 INTRODUCTION
NGC 1241 is a Seyfert 2 galaxy (Véron-Cetty et al., 1998) which presents a complex morphology in the innermost 1.5 kpc. P imagery shows the presence of an emitting circumnuclear ring of star formation (CNR) with a brightness peak at a radius of pc. It also shows a 0.3 kpc long bar accompanied by an leading arm both emitting in P and centered on the nucleus. Apparently, they do not have associated absorption features as it might be expected (Reagan & Mulchaey 1999, hereafter RM99). The and images reveal that the CNR is mounted on a smooth inclined disk with approximately elliptical isophotes of varying position angle. The major to minor axis ratio of the outermost isophotes in the and bands reveals a disk inclination of 52°, consistent with the value given by Tully (1988) for the large scale disk. Finally, the image shows the presence of a trailing arm ending at the CNR and centered on the nucleus. These structures (Figure 1) have been kinematically studied by Díaz et al. (2003). RM99 have found that the color map to the southwest of the line of nodes of NGC 1241 is redder than in the northeast area, and reveals an overall dusty morphology consistent with an inclined ring with a color excess of 1.1 mag, whose southwest side is the nearest one. According to these authors, assuming that the dust scale height is small relative to the scale height of the stars, and that the plane of the dust is inclined with respect to the bulge stars, dust absorption might not affect the color of the bulge near the nucleus. As we will see later, the nucleus of NGC 1241 is relatively free of absorption when compared to the color excess of the ring. To reinforce this picture, none of the absorption features normally expected near emitting bars are evident near the 300 pc long bar found by Díaz et al. (2003). These authors have also shown that the ring of dust found by RM99 coincides with the CNR (Figure 2).
In this paper we examine GEMINI (+QUIRC+Hokupa) near-infrared images with pixel-photometry. We detected the presence of an azimuthally symmetric nuclear color excess with respect to the CNR () which would not be easily explainable in terms of dust absorption according to the RM99 results abovementioned. Moreover the color map does not show azimutal symmetry as the () one does. The properties of the and () in the inner 2 kpc are analyzed in terms of the models of Witt, Thronson & Capuano (1992, WTC92) (Dust and transfer of Stellar Radiation within Galaxies), and stellar population synthesis from 2-MASS NIR color magnitude diagrams of bar fields in the Large Magellanic Cloud (LMC), where individual stars are resolved at M (Nikolaev & Weinberg, 2000).
The next section of this paper outlines how our observations were made and discuss the homogenization of Hubble Space Telescope (HST) and GEMINI photometry. In Section 3 our results are discussed and the final remarks are given in the final section.
2 OBSERVATIONS AND METHODS
On September 30, 2000, we used the Quick Start service of the Gemini North 8.1 m telescope for NIR imaging using Hokupa’a natural guide star and curvature-sensing adaptive optics system. The latter feeds the dedicated Quick NIR camera (QUIRC) fitted with a HgCdTe array sensitive to 1-2.5 radiation providing a final scale of 0.0197″ pixel-1. Standard data reduction procedures were applied to the images. The achieved full width at half maximum (FWHM) of the Gemini+Hokupa’a system was about 0.4″ in the band and about 0.3″ in the band both measured on the point spread function of a field star, and estimated on the target galaxy. Image deconvolution was not applied at this stage because of the photometric uncertainties that could be introduced by the methods that are commonly used. This resolution was good enough to compare the Gemini images with the existing HST-NICMOS3 data (Figure 1).
Photometry.
HST imagery with F160W and F606W filters and its calibration have been discussed by RM99. Essentially, the relative fluxes of these frames at each position are given. A transformation was performed in order to match colors derived from the HST fluxes and to the standard color system of our observations. For filter F606W, we obtained from the flux in the Vega-mag system according to Bedin et al. (2005). Coefficients for the transformation of into of Vega-mag system are provided by Holtzman et al. (1995). results mag brighter than in agreement with previous transformation by Malkan, Gorjian & Tam (1995) who determined that would be 0.1 mag to 0.2 mag brighter than . For filter F160W, we calculated according to Stephens et al. (2000). These authors follow two different procedures to transform into , each providing slightly different results. To be coherent with the transformation of into , we adopted the procedure based on the Vega-mag system.
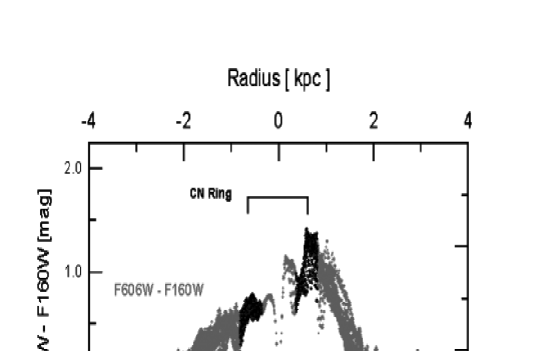
Using homogeneous colors, we carried out pixel photometry to ascertain whether the morphology seen in band images is differentially affected by the presence of dust. After separating all the pixels to the northeast from those to the southwest of the major axis, we integrated the brightness and and colors on half-rings of variable radii and plotted them against the de-projected radius (Figure 3).
Witt, Thronson & Capuano (1992, hereafter WTC92) models of Dust and Transfer of Stellar Radiation within Galaxies have been used to disentangle color properties due to dust from those due to stellar population effects. WTC92 models include the effect of light scattering by dust. Four of the models presented by these authors constitute plausible scenarios for the region under study: 1) The Dusty Galaxy, which considers dust and stars equally distributed within a sphere. 2) The Cloudy Galaxy, which considers the sphere occupied by stars to be larger than that occupied by dust. 3) The Starburst Galaxy, in which also stars occupy a larger sphere than the dust, but follow an distribution. 4) The Dusty Galactic Nucleus, in which a sphere of stars is enshrouded in a cocoon of dust.
Errors in colors for each one of the subsystems quoted in Figure 3 are directly obtained from fluctuations in pixel photometry and propagated to the derived quantities according to the transformation equations of the photometric system.
3 RESULTS & DISCUSSION
Figure 3 shows that the reddening increases inwards, as well as a remarkably similar radial behavior on both sides of the line of nodes. It also shows a plateau at mag at the position of the CNR, with a maximum of about 1.15 mag in the nucleus. The band integrated profile is also symmetric. On the other hand, the upper panel of Figure 3 shows how dramatically different are both sides of the circumnuclear ring in the () color, with an excess in the southwest side with respect to the northeast one, besides a global mean color excess of the CNR with respect to the disk. The nucleus is remarkable too, as its () color is similar to that of the disk outside the CNR, indicating the presence of a transparent window in that direction as suggested by RM99. This conclusion is corroborated by the detection of nuclear H emission (the galaxy is a Sy 2) together with P emission, while the CNR is observed in P, but obscured in H.
Colors in Table 1 can be matched to stellar spectral types using Pickles’ (1998) stellar library. The results are quoted in Table 2. We first note that the () colors of all substructures in Table 1 correspond to younger spectral types than it would be indicated by the color, in spite of the stronger reddening in the band.
The disk.
Its color is similar to the color in the foreground of the LMC fields studied by Nikolaev & Weinberg (2000) and to the Sagittarius comparison fields studied by Cole (2001), both obtained from the Two Micron All Sky Survey (2MASS) data. We obtained similar results by integrating six Milky Way fields around the LMC, as we will show in the results. Nevertheless, the disk () color corresponds to a B9V-A2V stellar population, which leads us to think that star formation occurred not only in the CNR but also reached the inner disk within its innermost 2 kpc.
Circumnuclear Ring (CNR).
Assuming that the difference in the observed () between the far side of the CNR and the disk is caused by extinction, we obtain mag and WTC92 Dusty Galaxy model leads to an extinction solution with and scattered light contributing 45 in band. This model provides theoretical color excesses for the CNR far side amounting to mag and , coherent with the values presented in Table 1. This source of absorption, probably diffuse, is intrinsic to the CNR and different from that discussed by Regan & Mulchaey (1999), which produces the difference in () between the CNR near and far sides, attributed to the dusty one-arm clearly seen in HST F606W filter image by Regan & Mulchaey (1999). Furthermore, within the CNR one should add the H absorbing dust cocoons associated to each one of the P emitting blobs (Figure 1).
Nuclear colors, dust or stellar population?
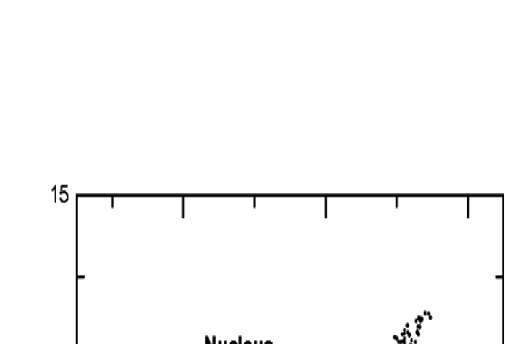
Figure 4 shows the NIR color-magnitude diagram vs. for 0.1″ rebinned pixels in the central region of NGC 1241. The figure presents a color excess of the nucleus with respect to the CNR in a different manner (cf. Figure 3). It is not possible to obtain a WTC92 model fitting of both the very red () color excess and the very blue nuclear (). The reddening arrow in Figure 4 points to the same direction where the nuclear at the top of the CMD bends. Therefore, it suggests that dust may affect in a rather subtle way the nuclear without influencing (). Our solution to this rather tricky issue is that Carbon stars are natural candidates to explain the infrared excess. Considerations on the LMC infrared Color-Magnitude diagram (CMD) of Nikolaev & Weinberg (2000), lead us to propose these substantial contribution from Carbon stars to the nuclear stellar population. Following a procedure similar to that of Nikolaev & Weinberg (2000), we have used the 2MASS All-Sky Point Source Catalog Statistics Service facility at http://irsa.ipac.caltech.edu/applications/Stats/ to obtain an integrated color-magnitude synthesis of the LMC bar and we have compared it to the NGC 1241 nucleus.
The 2MASS service provides CMD diagrams and integrated light photometry in , and inside user selected circular regions. We choose five circular fields along the LMC bar and 2 foreground regions per bar field, one located 10 degrees North and another 10 degrees South of the bar. All regions and fields were selected with 30’ radius. Extractions from the 2MASS Point Source Catalog were performed. Figure 5 shows the CMD diagram corresponding to the center of the LMC bar and to the corresponding comparison field. Then, for each of the five regions the North and South foreground fields were averaged, and the mean brightness subtracted from the corresponding region to correct for foreground contamination. The final integrated surface magnitudes were obtained by flux averaging the five background corrected integrated surface magnitudes of the regions. The results were: mag/arcsec2, mag/arcsec2, mag/arcsec2, . The color closely agrees with the color of the nucleus of NGC 1241. A similar color was obtained by Cole (2001) for the Sagittarius Dwarf galaxy, after correction for our Galaxy contamination.
4 Final Remarks
We have discussed two dimensional photometry of the central 2 kpc of the Sy 2 galaxy NGC 1241, where a circumnuclear ring of star formation and the nucleus present peculiar colors when compared to the underlying disk. HST and GEMINI imagery have been reduced to a uniform photometric system in order to allow the study of the photometric properties of these subsystems. While the dust arm produces the reddening of the CNR near side with respect to the CNR far side, we propose that an additional source of diffuse dust obscures uniformly the CNR, thus producing a global reddening of the CNR compared to the underlying disk. Inside the CNR, there are cocoons of dust associated to the P emitting condensations.
Finally, the very red color of the nuclear region together with the surprising transparency of this region in , led us to propose a CMD for the nucleus similar to that of the LMC bar. C-stars can in fact redden significantly the integrated colors at unresolved scales, a situation similar to that we are facing in the nuclear region of NGC 1241. Carbon stars and asymptotic giant branch oxygen-rich stars evolve rapidly ( yr) and eject considerable amounts of dust and gas with velocities low enough ( km s-1) to be trapped by the gravitational potential barrier of the central mass concentration ( M⊙, pc). The 500 [6 M] C-stars and asymptotic giant branch O-rich stars (according to the LMC bar proportion) inside a radius of about 50 pc that are necessary to explain the nuclear colors, would release material that, gravitationally bounded, could amount to between and M⊙ yr-1 of fuel for the central engine. The intra-nucleus medium contamination may last during the lifetime of stars with masses 2 M MM⊙. This scenario may also explain the systematical increase of the strength of the optical CN-bands observed in the stellar populations of Sy 2 galaxy nuclei (e.g. Gu et al. 2001), and the significant contribution of intermediate age stars to the optical continuum of low luminosity AGNs (e.g. Gonzalez-Delgado 2004).
5 Acknowledgements
HD thanks the brazilian institutions CNPq and CAPES. RD thanks the support from Evencio Mediavilla and Romano Corradi. This research is also partially supported by brazilian grants MEGALIT/Millennium, and the argentinean Agencia Córdoba Ciencia. JFS thanks to the FAPEMIG Foundation (Minas Gerais, Brazil). The 2MASS project is a collaboration between the University of Massachusetts and the IPAC (JPL/Caltech). The Gemini 8-meter telescopes is an international partnership managed by AURA, Inc. under a cooperative agreement with the NSF (USA), PPARC (UK), NRC (Canada), CONICET (Argentina), ARC (Australia), CNPq (Brasil) and CONICYT (Chile). The NASA/ESA Hubble Space Telescope is operated by AURA under NASA contract NAS 5-26555.
References
- Bedin et al. (2005) Bedin, L.R., et al. 2005, MNRAS, 357, 1038.
- Cole (2001) Cole, A.A.,2001, ApJ, 559, L17.
- Díaz et al. (2003) Díaz, R.J., Dottori, H., Vera-Villamizar, N., Carranza, G. 2003, ApJ, 597, 860.
- Gonzalez-Delgado (2004) Gonzalez-Delgado, R., 2004, in The Interplay among Black Holes, Stars and ISM in Galactic Nuclei, L. Ho & H. Schmitt, eds., Cambridge University Press 2004, p. 137-140.
- Gu et al. (2001) Gu, Q., Huang, J., de Diego, J., Dultzin-Hacyan, D., Lei, S. & Benítez, E. 2001, A&A, 374, 932.
- Holtzman et al. (1995) Holtzman, J.A., Burrows, C.J., Casertano, S., Hester, J.J., Trauger, J.T., Watson, A.M., Worthey, G. 1995, PASP, 107, 1065.
- Malkan, Gorjian & Tam (1995) Malkan, M.A., Gorjian, V., Tam, R. 1995, ApJSS, 117, 25.
- Nikolaev & Weimberg (2000) Nikolaev, S., & Weinberg, M. 2000, ApJ, 542,804.
- Pickles (1998) Pickles, A. J. 1998, PASP, 110, 863.
- Regan & Mulchaey (1999) Regan, M.W., & Mulchaey, J.S. 1999, AJ, 117, 2676.
- Véron-Cetty et al. (1998) Véron-Cetty, M., Véron, P. 1998, ESO Sci. Report: A Catalogue of Quasars and Active Nuclei, 8th Edition.
- Stephens et al. (2000) Stephens, A.W., Frogel, J.A, Ortolani, S., Davies, R., Jablonka, P., Renzini, A., Rich, R. M. 2000, AJ, 119, 419.
- Witt et al. (1992) Witt, A.N., Thronson Jr., H.A., Capuano Jr., J.M 1992, ApJ, 393, 611.


| Structure | aa and are standard colors observed with GEMINI. and are derived from HST fluxes. Observed quantities are in bold. | |
|---|---|---|
| () | () | |
| Disk (outwards CNR) | -0.10.2 | 0.550.1 |
| 0.00.2 | ||
| CNR (near side) | 1.50.2 | 0.820.06 |
| 1.350.2 | ||
| CNR (far side) | 0.610.1 | 0.820.06 |
| 0.60.05 | ||
| Nucleus | 0.00.1 | 1.050.03 |
| 0.00.1 |
Stellar spectral types in Pickles’ (1998) stellar library that match the colors in Table 1 Structure disk (outwards CNR) B9V-A2V K0-K2 CNR (near side) G2V-G5V M2-M4 CNR (far side) F0V-F2V M1-M2 Nucleus A3V-A5V M5-M6