Universitá degli Studi di Roma ”La Sapienza”, INAF-Osservatorio Astronomico di Roma INAF-OAR INAF-OAR OMP JILA-Boulder \PACSes\PACSit98.70.Rzgamma-ray sources; gamma-ray bursts \PACSit98.58.CaInterstellar dust grains
GRB environment properties through X and Optical Afterglow observations
Abstract
We present the spectral analysis of 14 gamma-ray bursts (GRB) X-ray afterglows in order to investigate the properties of interstellar matter (ISM) along the line of sight of GRB. We carried out a simultaneous analysis of the NIR-optical and X-band for those afterglows with an optical counterpart too, in order to evaluate and strongly constrain the absorption effect on the spectral energy distribution due to dust extinction from GRB environment. We evaluated the equivalent hydrogen column density from X-ray spectroscopy and rest frame visual extinction by assuming different type of ISM composition and dust grain size distribution. From our analysis we obtained a distribution of the GRB rest frame consistent with the one expected if GRB were embedded in a Galactic-like molecular cloud. Moreover, values of the visual extinction estimated from the simultaneous analysis of NIR-to-X band favour an environment where small dust grain are destroyed by the interaction with the X-ray and UV photons from GRB.
1 Introduction
It’s now generally believed that long-duration GRB are associated with the
collapse of massive stars (e.g. [1]) and so a dense and dusty
environment, typical of star forming regions, is expected in the nearby of the
bursts. Up to now there are some observations that are in good agreement with
this molecular cloud-like scenario, like the emitting and absorbing
features observed in some X-ray afterglows (e.g. [2],
[3]), the detection of a large amount of
dust obtained from the high resolution spectroscopy of three optical
afterglows [4] and the high rest frame visual extinction
inferred in some other optical afterglows (e.g.[5]).
Under this point of view, the non detection of of X-ray
afterglows at optical wavelengths (dark GRB) would be due to the dust
absorption. On the other hand, the spectral energy distribution of
some GRB afterglows indicates that dust reddening is very slow (
[6],[7]). Moreover, for the
observed optical afterglows, on average, the estimated rest frame
visual extinction is a factor 10-100 lower than the expected if an
ISM with dust to gas ratio and an extinction curve similar to the
Galactic one are assumed ([8]). Also, some high redshift
burst showed a larger amount of gas than dust. In a recent work,
Stratta et al.([9]) already pointed out that absorption
properties derived from X-ray and optical afterglows spectral
analysis may require a “non-standard” extinction. A more careful
study is required to probe the ISM of GRB environment.
In this work
we present the results of a systematic multiwavelenght spectra
analysis of a sample of GRB afterglows in order to put some
constraints on the properties of the circumburst environment.
2 X-ray Data Analysis
| GRB | |||||
| (h m s) | ( ∘ ’ ”) | () | |||
| 991216 | 05 09 31 | +11 16 50 | 1.02 | yes | 0.27 |
| 000210 | 01 59 13 | -40 40 46 | 0.846 | no | 0.0223 |
| 000926 | 17 04 10 | +51 46 32 | 2.0375 | yes | 0.0265 |
| 001025 | 08 36 36.5 | -13 04 30.3 | 1 | no | 0.065 |
| 011211 | 11 15 16.4 | -21 55 44.8 | 2.14 | yes | 0.0427 |
| 020322 | 18 00 53.0 | +81 04 48.0 | 1 | no | 0.045 |
| 020405 | 13 57 54 | -31 23 34 | 0.691 | yes | 0.0427 |
| 020813 | 19 46 41 | -19 36 00 | 1.254 | yes | 0.075 |
| 021004 | 00 26 54 | +18 55 50 | 2.328 | yes | 0.0427 |
| 030226 | 11 33 03 | +25 54 20 | 1.986 | yes | 0.0181 |
| 030227 | 04 57 29.0 | 20 29 23.9 | 1.6 | yes | 0.218 |
| 031203 | 08 02 30.0 | -39 50 48.0 | 1 | no | 0.621 |
| 040106 | 11 58 50.5 | -46 47 14.0 | 1 | no | 0.0842 |
| 040223 | 16 39 34.0 | -41 55 45.0 | 1 | no | 0.663 |
We selected from the XMM-Newton and Chandra archives all the X-ray afterglows with an high signal-to-noise ratio (see Tab 1) in order to perform a good spectral analysis. Standard data reduction in the 0.1-10.0 keV energy range was performed using SAS 6.0 for the data of the XMM-Newton EPIC instrument and using CIAO 2.3 for the Chandra ACIS-S instrument. All the spectra were analyzed with Xspec 11.2.0. In order to get Gaussian statistics, thus so to ensure the applicability of the test to evaluate the goodness of our fits, the spectra were rebinned to obtain at least 20 counts per energy channel. For the EPIC spectra we performed simultaneous PN, MOS1 and MOS2 spectral fitting.
2.1 The spectral model
According to the standard fireball model, the spectrum of the X-ray afterglows emission is well described by a simple power law . In this analysis we adopted a spectral model that takes into account also for the photoelectric absorption both Galactic and extragalactic due to the metal rich material along the line of sight of GRB: , where is the is the equivalent hydrogen Galactic column density fixed according to the Dickey Lockman map [10] and is the extragalactic contribution to the absorption, whose value was left free to vary. The redshift values are derived from optical observation when available; otherwise, the value z=1 was adopted, being this the peak value of GRB redshift distribution[11].
2.2 Results
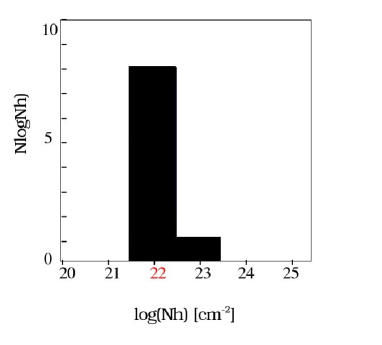
We found an absorption larger than the Galactic value in nine cases
(GRB000210,GRB001025, GRB020322, GRB020405, GRB020813, GRB030226,
GRB030227, GRB031203, GRB040223) with confidence level up to
4. The rest frame equivalent
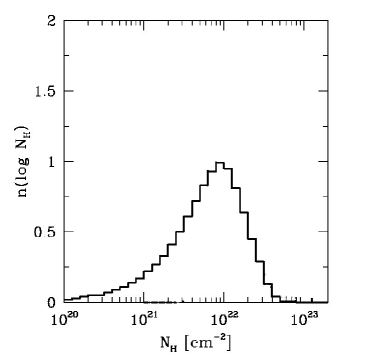
hydrogen column density distribution obtained has a
weighted average of ,
consistent with the theoretical peak expected if GRB are embedded in
a Galactic-like molecular cloud (see Fig.1).
3 Multiband analysis
For the eight afterglows of the sample with an optical counterpart (see Tab1) the analysis was extended to the optical and NIR band, in order to better constrain extinction properties through a fit of spectra as wide as possible. Photometric data have been taken from literature. To perform this large band analysis we applied some correction to data. Firstly, being we extrapolated magnitudes at the same time of X-ray observation, adopting the measured optical-NIR decay index published in literature and then we corrected them from Galactic extinction along GRB line of sight using the IRAS 100 m E(B-V) maps by Schlegel et al. 1998 [13] and by deriving the extinction at different wavelengths using the extinction curve parameterization taken from Cardelli et al. 1989 [14] assuming . Finally, the magnitudes have been converted in fluxes using the effective wavelenghts and normalization fluxes given by Fukugita et al. 1995 [15].
3.1 The spectral model
For the optical/NIR data we adopted a model composed by a powerlaw and an absorption component that takes into account the dust extinction: , where is the visual extinction. Assuming the slow cooling regime as the most probable one for the electron population at the observation time, we assumed that the electron index p is twice the X-ray spectral index previously obtained within confidence level. We fitted the data using both the possibility predicted for this regime: if , if , where is the cooling frequency. We tested different dust composition and dust-to-gas ratio using different extinction curves, assuming that the dust grains distribution is described by a simple power law . The curves are: the Galactic-like (G) from Cardelli et al. 1989 [14], for which , ; the Small Magellanic Cloud-like (SMC) from Pei 1992 ([16]), that’s the same model but with 1/8 of the solar metallicity; two extinction curves (Q1 and Q2) obtained by Maiolino et al 2000 ([17]), from simulation from study of a sample of AGN, for which , and , respective. We have also tested an extinction curve (C) derived by Calzetti et al. 2001 [18] for a sample of local starburst galaxies. For all this different ISM model the rest frame visual extinction has been estimated for all the afterglows sample.
3.2 Results
For GRB991216 and GRB011211 we have obtained only the Galactic
contribution to extinction, a result consistent with the previously
X-ray analysis.
For GRB000926, GRB020405, GRB020813, GRB030226 and
GRB030227 the best fit is obtained assuming an ISM with dust grain
distribution skewed toward large grains (Q1 curve for the first case,
Q2 curve for the other four cases). We also compared the best fit
additional density at GRB’s redshift with the best fit
obtained for the different extinction curves. The
relations have been compared with the corresponding theoretical one:
Galactic, [8];
Small Magellanic Cloud,
[19] ; Q1,
and Q2,
[17]. For the starburst galaxies no
relationship has been derived due the complexity of this kind of
ISM. Assuming a Galactic-like and SMC ISM, this ratio are well above
the expected values, confirming previous studies
(e.g. [7],[9]). A good agreement is
obtained with an ISM with dust grain size distribution skewed toward
large grain (see fig. 2). Such a dust composition
reconciles the typical low reddening observed in the optical afterglows
SEDs with the high amount of dust observed through optical
spectroscopy [4]. This kind of environment can be obtained
in two ways: small dust grain can coagulate into larger producing a
dust distribution biased towards larger grains as expected in high
density medium (e.g.[20]), or the physical state of the gas
and dust are modified by the intense X-ray and UV emission from GRB,
(e.g [21]).
Such an uncertainty will be solved by
monitoring the very early afterglows and the possible evolution of the
extinction effects. The SWIFT satellite and robotic telescopes, such
as REM, will be very useful to provide us these informations.

Acknowledgements.
For a more detailed analysis see Conciatore et al 2005 in prep.References
- [1] \BY Woosley S.E.; Zhang W.; \atqueHeger A. \INAIP Conference ProceedingsVol 7272003
- [2] \BY Antonelli L.A. et al. \INApJ54532000
- [3] \BY Piro L. et al. \INApJL514L731999
- [4] \BY Savaglio S.; Fall M. \atqueFiore F. \INApJ5856382003
- [5] \BYBloom J.S.; Djorgovski S.G. et al. \INApJ50725B1998
- [6] \BYSimon V.; Hudec R. et al. \INA&A3774502001
- [7] \BYGalama T.J. \atqueWijers R.A.M.J. \INApJL549L2092001
- [8] \BYPredehl P. \atqueSchmitt J.H.M.M. \INA&A2938891995
- [9] \BYStratta G.; Fiore F.; Antonelli L.A.; Piro L. \atqueDe Pasquale M. \INApJ608864S2004
- [10] \BYDickey J.M. \atqueLockman F.J. \INAnn. Rev. Ast. Astr.282151990
- [11] \BYDjorgovsky S.G. et al. \TITLEproc. in \TITLEGamma-Ray Bursts in the Afterglow Era: 2nd Workshop, edited by \NAMECosta E.; Frontera F. \atqueHjorth J. (Berlin Heidelberg:Springer 2001, pp.218.
- [12] \BYReichart D.E. \atquePrice P.A. \INApJ5651742002
- [13] \BYSchlegel D.J.; Finkbeiner D.P \atqueDavis, M. \INApJ5005251998
- [14] \BYCardelli J.A.; Clayton G.C \atqueMathis, J.S. \INApJ3452451989
- [15] \BYFukugita M.; Shimasaku K. \atqueIchikawa, T. \INPASP1079451995
- [16] \BYPei Y.C. \INApJ3951301992
- [17] \BYMaiolino A.; Marconi A. \atqueOliva E. \INA&A365372001
- [18] \BYCalzetti D.; Kinney A.L. \atqueStorchi-Bergmann T. \INApJ4295821994
- [19] \BYWeingartmer J.C. \atqueDraine B.T. \INAAS19742072000
- [20] \BYKim S. \atqueMartin P.G. \INApJ462296K1996
- [21] \BYWaxman E. \atqueDraine B.T. \INApJ5377962000