The Vertical Structure of Stars in Edge-on Galaxies
Abstract
We present a summary of our recent work on the vertical distribution of the resolved stellar populations in six low mass, edge-on, spiral galaxies observed with the Hubble Space Telescope Advanced Camera for Surveys (HST/ACS). In each galaxy we find evidence for an extraplanar stellar component extending up to 15 scale heights (3.5 kpc) above the plane. We analyze the vertical distribution as a function of stellar age by tracking changes in the color-magnitude diagram. The young stellar component ( yrs) is found to have a scale height larger than the young component in the Milky Way, suggesting that stars in these low mass galaxies form in a thicker disk. We also find that the scale height of a stellar population increases with age, with young main sequence stars, intermediate age asymptotic giant branch stars, and old red giant branch stars having succesively larger scale heights in each galaxy. This systematic trend indicates that disk heating must play some role in producing the extraplanar stars. We constrain the rate of disk heating using the observed trend between scale height and stellar age, and find that the observed heating rates are dramatically smaller than in the Milky Way. The color distributions of the red giant branch (RGB) stars well above the midplane indicate that the extended stellar components we see are moderately metal-poor, with peak metallicities of [Fe/H]-1 and with little or no metallicity gradient with height. The lack of metallicity gradient can be explained if a majority of extraplanar RGB stars were formed at early times and are not dominated by a younger heated population. Our observations suggest that, like the Milky Way, low mass disk galaxies also have multiple stellar components. We examine our results in light of disk heating and merger scenarios and conclude that both mechanisms likely played a role in forming the disks of our sample galaxies.
U. of Washington, STSci
1. Introduction
The age, morphology and composition of the disk, bulge and halo components found in typical spiral galaxies all provide significant constraints on the mechanisms of galaxy formation. In the Milky Way, the disk of the galaxy has been found to be a complex object, with a thin disk whose scale height depends on stellar age and a separate thick disk component first discovered by Gilmore & Reid (1983) using star counts. The Milky Way thick disk is dominated by old, moderately metal-poor stars (Wyse & Gilmore 1995) and has recently been shown to be chemically distinct from the thin disk (e.g. Bensby et al. 2005).
Outside the Milky Way, very little detailed information exists about disk morphologies in other galaxies. Integrated surface brightness profiles of edge-on spirals have shown that many galaxies appear to have thick disks (e.g. Burstein 1979; Dalcanton & Bernstein 2002; Pohlen et al. 2004), while recent studies in a handful of nearby edge-on galaxies using resolved stars have confirmed that extraplanar stars are old and moderately metal-poor (Mould 2005; Tikhonov et al. 2005).
Many different mechanisms have been used to explain the creation of thin and thick disks. These mechanisms fall into three categories: (1) Creation of thicker components by dynamical heating from a thin disk by molecular clouds, spiral arms, galaxy interaction etc. (e.g. Spitzer & Schwarzschild 1951; Lacey 1991; Gnedin 2003). (2) the slow collapse of the proto-Galaxy forming the thick and thin disk (e.g. Eggen et al. 1962; Gilmore 1984), and (3) the formation of a thick disk from mergers by direct accretion of stars or by in situ formation from accreted gas (e.g. Bekki & Chiba 2001; Gilmore et al. 2002; Abadi et al. 2003; Brook et al. 2004). Testing the applicability of these theories beyond the Milky Way requires detailed observations of galaxies with a range of masses and types. In this paper we focus on the disks of edge-on, low mass, late type spiral galaxies.
The work presented here is a summary of our recently published results, Seth et al. (2005a) (Paper I) and Seth et al. (2005b) (Paper II). A more in depth treatment of this work is presented there. In §2 we present an overview of our galaxy sample and describe out HST/ACS observations. We present our primary results on the vertical distribution of stars and the metallicity of extraplanar stars in our sample galaxies in §3. This is followed by a discussion in §4.
2. Observations and Sample
We obtained HST/ACS images of 16 edge-on (), late type galaxies as part of a Cycle 12 snapshot proposal. A subsample of eight fields in six galaxies were near enough to enable distance measurements using the tip of the red giant branch (RGB). These six galaxies and their distances, morphological types, circular velocities, -band scale lengths and scale heights111We use a functional form to fit our surface density profiles. Scale heights refer to the in this equation. as determined from fits to 2MASS data (Paper I), and the number of ACS fields/pointings are listed in Table 1. Because these galaxies are nearby, the ACS field-of-view does not cover the entire galaxy. For most galaxies the fields are roughly centered on the galaxy, however, for those galaxies with two fields (NGC 55 and NGC 4631), the second field (denoted with a ’-DISK’ suffix) is located further out in the disk. The six galaxies are all late type (Sc+), none have a significant bulge, and all have luminosities and inferred masses significantly lower than the Milky Way.
| Galaxy | Dist. | Type | -band | -band | # of ACS | |
|---|---|---|---|---|---|---|
| [Mpc] | km/sec | [kpc] | [pc] | Fields | ||
| NGC 55 | 2.1 | SBm | 67 | 0.96 | 437 | 2 |
| IC 5052 | 6.0 | SBcd | 79 | 1.57 | 390 | 1 |
| NGC 4144 | 7.5 | SBc | 67 | 1.10 | 458 | 1 |
| NGC 4244 | 4.4 | Sc | 93 | 1.78 | 257 | 1 |
| NGC 4631 | 7.7 | SBcd | 131 | 1.32 | 280 | 2 |
| NGC 5023 | 6.6 | Sc | 77 | 1.28 | 160 | 1 |
The ACS observations consisted of 676 seconds of exposure time in the F606W filter and 700 seconds in the F814W filter. Our photometric pipeline is described in detail in Paper I and yielded 40,000 to 280,000 stars per field. Extensive artificial star tests (5 million stars per field) enabled determination of the completeness as a function of magnitude, color and local surface brightness allowing us to study the number of stars as a function of distance from the disk midplane (’disk height’). To enable adequate correction of the number counts of stars, we restrict all analysis presented here to stars brighter than the 20% completeness level in the highest surface brightness areas (i.e. the midplane).
Figure 1 shows the color-magnitude diagrams (CMDs) for each of the fields analyzed here. In the nearest galaxies, the red giant branch (RGB), Asymptotic Giant Branch (AGB), upper Main Sequence (MS) and red and blue Helium burning star sequences are clearly visible. We use these different stellar populations to separate the stars we see into three broad age categories. Three boxes are shown on each CMD in Fig. 1 for the RGB, AGB, and MS (including helium burning) stars. To determine how well we could isolate different stellar ages we generated synthetic CMDs using the MATCH code (Dolphin 2002) and assuming a constant star formation rate starting 13 Gyr ago. The synthetic CMD was then convolved with the errors obtained from the artificial star tests for each galaxy (See Paper II for more details). The resulting age distribution for stars falling in the MS, AGB, and RGB boxes in NGC 4144 is shown in Figure 2. From this figure it is clear that the MS, AGB, and RGB boxes roughly correspond to young ( Myr), intermediage age (1 Gyr), and old ( Gyr) stellar populations. However there is some overlap between the different boxes, particularly between the AGB and RGB (see Paper II for more details).
3. Results
In this section we present the main results of our work. This includes an analysis of the scale heights of the resolved stellar populations and a determination of the metallicity of the old extraplanar stellar population.
3.1. Vertical Distribution of Stars
Before dividing up the stellar population in different age bins, we first determine the vertical distribution of all the observed stars above the 20% completeness limit. Figure 3 shows the vertical stellar density profile for each field in our sample. This figure was created by determining the number of stars in each galaxy in bins at different disk heights. This number of stars was then corrected for incompleteness and was divided by the image area in each bin to obtain a surface density. The two dashed lines denote the profiles from the two NGC 4631 fields on the side where they are contaminated by stars from nearby companion NGC 4627. The disk heights on the x-axis are scaled by , the disk height containing 50% of the band light () in each galaxy. The two dashed lines show the profile expected for a stellar population with a scale height 1 and 2 times the band light.
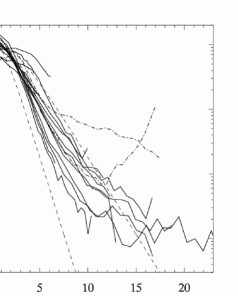
The most notable result from Figure 3 is that we are able to trace the resolved stellar population far above the midplane, out to 15-20 (3-4 kpc). The fact that the star counts continue to decrease all the way to the edge of the images suggests there are few background and foreground contaminants. Assuming a stellar population at large scale heights similar to Galactic globular clusters (using data taken from Buonanno et al. 1994; Kravtsov et al. 1997), we find that we reach a limiting surface brightness of 28 mag arcsec-2. We determine the scale height of the full stellar population at large disk heights by fitting the profiles between 5 and 10 above and below the disk to a sech2 function. The derived scale heights listed in Table 2 (in columns 3 & 4) are typically 2 times the 2MASS band scale heights. We note that the 2MASS images are not very deep and only trace the highest surface brightness population near the midplane. This therefore suggests that the population at large disk heights has a larger scale height than the population near the midplane.
| Field | All | All | MS | AGB | RGB | ||
|---|---|---|---|---|---|---|---|
| [pc] | [pc] | [pc] | [pc] | [pc] | [pc] | ||
| IC 5052 | 390 | 76730 | 68644 | 26111 | 4676 | 6556 | 2.4 |
| NGC 55 | 437 | 32724 | 64410 | 7013 | 1.4 | ||
| NGC 55-DISK | 437 | 5261 | 74115 | 9996 | 1.0 | ||
| NGC 4144 | 457 | 94041 | 96515 | 37427 | 69916 | 93418 | 1.2 |
| NGC 4244 | 468 | 74040 | 32520 | 44324 | 5519 | 3.2 | |
| NGC 4631 | 510 | 92746 | 51026 | 89551 | 1154194 | 1.1 | |
| NGC 4631-DISK | 510 | 113150 | 50522 | 12001 | 138773 | 1.0 | |
| NGC 5023 | 291 | 50532 | 53426 | 2046 | 2896 | 3914 | 3.3 |
We now analyze the scale height of our sample of galaxies as a function of stellar age. Using the MS, AGB, and RGB boxes shown in Figure 1, we are able to isolate young, intermediate, and old stellar populations. Figure 4 shows the completeness corrected surface density profiles for the three different stellar population boxes in each field. The youngest MS stars are shown with a solid line, while the intermediate-age AGB and old RGB stars are shown with dotted and dashed lines, respectively. The stellar density profiles have all been normalized to integrate to one. Each field clearly shows that the MS component is the narrowest while the RGB is in all cases the thickest component. We quantified this trend by fitting a sech2 function to each component excluding the central portions of the profile from the fit. The central portions of the profiles show dips in the star counts which likely result from dust absorption (see Paper II). The scale heights found from the sech2 fits are shown in columns 5-7 of Table 2. A number of interesting trends are visible. First, in each galaxy/field, the MS component has the smallest scale height with the AGB and RGB having succesively larger scale heights. In other words, the scale height increases with increasing stellar age in all six galaxies. Second, the scale heights of the MS component are larger than (200-500 pc) than the scale height of young stars in the Milky Way (200 pc; Schmidt 1963) despite being less luminous and having shorter scale lengths. This thicker MS component may be related to the thicker dust distribution seen in low mass galaxies by Dalcanton et al. (2004). Finally, the axial ratio of the RGB component () shown in the last column of Table 2 ranges from 1.0 to 3.3. This axial ratio is similar to the Milky Way thick disk (using data from e.g Chen et al. 2001).
3.2. Metallicity
Based on the scale height results, we expect most of the stars at large disk heights to be old. The morphology of the RGB population can provide a metallicity diagnostic for old stellar populations (e.g. Da Costa & Armandroff 1990; Armandroff et al. 1993; Frayn & Gilmore 2002). In this section we use the color of the RGB stars to determine the metallicity of the extraplanar stellar population.
The left panel of Figure 5 shows the composite CMD of stars above 4 in all the galaxies excepting the NGC 4631 fields (which have completeness limits that are too high for RGB metallicity analysis). Overplotted are 10 Gyr Padova isochrones at [Fe/H] values ranging between -2.3 and 0.0. The peak of the distribution lies between the isochrones with [Fe/H] of -1.3 and -0.7 indicating that the dominant population in these galaxies at high latitudes is moderately metal-poor. We determined a metallicity distribution function for each galaxy using three bins in absolute magnitude shown with dotted lines in the left panel of Figure 5. In each bin we determined the metallicity of individual stars by linearly interpolating between the 10 Gyr Padova isochrones. The right panel of Figure 5 shows the metallicity distribution functions for NGC 4244, with the shaded grey region indicating the range of results for the three different bins. The peak metallicity is at [Fe/H] of -0.9 with a long tail towards lower metallicities and a sharper cutoff at higher metallicities. The other four galaxies have similar MDFs, with peaks ranging between [Fe/H] of -0.7 and -1.1. This peak metallicity also agrees with metallicities found for extraplanar stars in other studies of galaxies in the same mass range (Cole et al. 2000; Davidge 2003; Tiede et al. 2004; Davidge 2005). This metallicity is slightly more metal-poor than the Milky Way thick disk metallicity ([Fe/H]-0.6) but significantly more metal-rich than the Milky Way halo (-1.7 Wyse & Gilmore 1995). We note that the current metallicity of these galaxies is somewhat subsolar (Garnett 2002), furthering the idea that the peak metallicites of [Fe/H]-1 are consistent with the presence of a thick disk similar to the Milky Way’s.
Overplotted in the right panel of Figure 5 is a closed-box “simple” chemical evolution model (Eq. 20 of Pagel 1997) scaled to the peak of the MDF. The overall shape is similar to observed MDF, however our data appears to have a sharper cutoff at the high metallicity end, and a deficit of stars at the low metallicity end. The high metallicity cutoff suggests that the star formation trucated before all the gas was consumed, as would be expected for any of the thick disk scenarios discussed in the introduction. At low metallicities, the deficit of stars may be a manifestation of the G-dwarf problem. However, our results at the low metallicity end are quite uncertain since the close spacing of the isochrones means photometric errors introduce large uncertainties in the metallicity.
Models for the origin of thin and thick disks predict different degrees of variation in the stellar metallicity with height above the plane. We can observe any such trend in our galaxies by examining the median color of the RGB stars as a function of height above the midplane. Figure 6 shows the median RGB color vs. disk height for each of the galaxies in our sample (except NGC 4631). At low disk heights, internal reddening may impact the color of stars - this is shown as the hatched region. Above this height, from 3-10 (1-2 kpc), the galaxies show very little variation in RGB color suggesting nearly uniform metallicity with increasing disk height. Recent observations by (Davidge 2005; Tikhonov et al. 2005; Mould 2005) of extraplanar stars in similar galaxies also find a lack of strong metallicity gradients. We discuss the implications of this further in the next section.
4. Discussion and Conclusions
We have shown above that in our sample of six edge-on, low mass, late type galaxies:
-
•
Stars exist at large heights above the disk plane.
-
•
The scale height of a stellar population increases with age in each galaxy. The young (MS) stellar population has a larger scale height than young stars in the Milky Way, while the old RGB population has an axial ratio similar to the Milky Way thick disk.
-
•
Extraplanar RGB stars have a peak metallicity of [Fe/H]-1. In addition there appears to be little gradient in the metallicity at moderate (1-2 kpc) disk heights.
In the Milky Way, it is widely accepted that the age-dependent scale height in the thin disk is a result of slow disk heating, while the thick disk is thought to be formed by some type of merger event. We now consider our results in light of this scenario.
Disk Heating: The steady increase in scale height with stellar population age suggests that some kind of disk heating is occurring in our sample galaxies. We can use our measured scale heights to constrain the rate of disk heating in these galaxies. For an isothermal sech2 profile, the scale height of a stellar population is proportional to the square of the vertical velocity dispersion (). In the Milky Way, the rate of disk heating is usually expressed as a power law, , with ranging between 0.3 and 0.6 (Hänninen & Flynn 2002). Using the ages for our stellar population boxes derived from the constant star-formation rate synthetic CMDs, we find that the rate of disk heating is much lower, with being no larger than 0.15 (see Paper II for more details). This is not surprising given our galaxies likely have fewer molecular clouds and weaker spiral arms. Based on this slow heating rate, it is plausible that disk heating can account for the observed variation of scale height. However, a model in which steady disk heating accounts for all of the extraplanar stars would predict the existence of intermediate-age RGB stars with higher metallicities and lower scale heights leading to a decreasing metallicity with increasing disk height. The lack of such a trend in our galaxies suggests that a majority of RGB stars at all disk heights formed early and with a well-mixed metallicity distribution. This strongly suggests that mergers or interactions played a role in the formation of these RGB stars.
Merger & Interactions: The thick disk in the Milky Way is thought to have formed in a merger event (Abadi et al. 2003; Brook et al. 2004, e.g.), and recent dynamical observations of a counter-rotating thick disk in FGC 227 by Yoachim & Dalcanton (2005) also strongly suggests a merger origin. In our sample galaxies, the lack of metallicity gradient and the similarity of the axial ratio and metallicity of the RGB population to the Milky Way thick disk suggests that mergers or interactions likely have played an important role in the early history of these galaxies. Further evidence to support this claim comes from the heterogeneity of scale heights we observe. Although all the galaxies in our sample show a similar trend towards increasing scale height with age, in some galaxies the RGB component is significantly thicker than in others despite having similar circular velocity/mass. This variation would be a natural consequence of the stochastic merging process.
Overall, our results require that some disk heating occurs at intermediate ages (to puff up the AGB component), but that events at earlier times (interactions or mergers) created a majority of the RGB stars over a short period of time. In future work, we will focus on the globular cluster systems of our sample galaxies which will provide us with additional evidence on their history and assembly.
Acknowledgments.
The authors would like to thank Andrew Dolphin and Antonio Aparicio for their help in generating synthetic CMDs and Leo Girardi for supplying us with isochrones. This work was supported by HST-GO-09765, the Sloan foundation, and NSF Grant CAREER AST-0238683.
References
- Abadi et al. (2003) Abadi, M. G., Navarro, J. F., Steinmetz, M., & Eke, V. R. 2003, ApJ, 597, 21
- Armandroff et al. (1993) Armandroff, T. E., Da Costa, G. S., Caldwell, N., & Seitzer, P. 1993, AJ, 106, 986
- Bekki & Chiba (2001) Bekki, K., & Chiba, M. 2001, ApJ, 558, 666
- Bensby et al. (2005) Bensby, T., Feltzing, S., Lundström, I., & Ilyin, I. 2005, A&A, 433, 185
- Brook et al. (2004) Brook, C. B., Kawata, D., Gibson, B. K., & Freeman, K. C. 2004, ApJ, 612, 894
- Buonanno et al. (1994) Buonanno, R., Corsi, C. E., Buzzoni, A., Cacciari, C., Ferraro, F. R., & Fusi Pecci, F. 1994, A&A, 290, 69
- Burstein (1979) Burstein, D. 1979, ApJ, 234, 829
- Chen et al. (2001) Chen, B., et al. 2001, ApJ, 553, 184
- Cole et al. (2000) Cole, A. A., Smecker-Hane, T. A., & Gallagher, J. S. 2000, AJ, 120, 1808
- Da Costa & Armandroff (1990) Da Costa, G. S., & Armandroff, T. E. 1990, AJ, 100, 162
- Dalcanton & Bernstein (2002) Dalcanton, J. J., & Bernstein, R. A. 2002, AJ, 124, 1328
- Dalcanton et al. (2004) Dalcanton, J. J., Yoachim, P., & Bernstein, R. A. 2004, ApJ, 608, 189
- Davidge (2003) Davidge, T. J. 2003, AJ, 125, 3046
- Davidge (2005) Davidge, T. J. 2005, ApJ, 622, 279
- Dolphin (2002) Dolphin, A. E. 2002, MNRAS, 332, 91
- Eggen et al. (1962) Eggen, O. J., Lynden-Bell, D., & Sandage, A. R. 1962, ApJ, 136, 748
- Frayn & Gilmore (2002) Frayn, C. M., & Gilmore, G. F. 2002, MNRAS, 337, 445
- Garnett (2002) Garnett, D. R. 2002, ApJ, 581, 1019
- Gilmore (1984) Gilmore, G. 1984, MNRAS, 207, 223
- Gilmore & Reid (1983) Gilmore, G., & Reid, N. 1983, MNRAS, 202, 1025
- Gilmore et al. (2002) Gilmore, G., Wyse, R. F. G., & Norris, J. E. 2002, ApJ, 574, L39
- Girardi (2004) Girardi, L. 2004, private communication
- Gnedin (2003) Gnedin, O. Y. 2003, ApJ, 589, 752
- Hänninen & Flynn (2002) Hänninen, J., & Flynn, C. 2002, MNRAS, 337, 731
- Kravtsov et al. (1997) Kravtsov, V., Ipatov, A., Samus, N., Smirnov, O., Alcaino, G., Liller, W., & Alvarado, F. 1997, A&AS, 125, 1
- Lacey (1991) Lacey, C. G. 1991, in Dynamics of Disc Galaxies, Proceedings of Varberg Conference, ed. B. Sundelius, 257
- Mould (2005) Mould, J. 2005, AJ, 129, 698
- Pagel (1997) Pagel, B. E. J. 1997, Nucleosynthesis and chemical evolution of galaxies (Nucleosynthesis and chemical evolution of galaxies /B. E. J. Pagel. Cambridge : Cambridge University Press, 1997. ISBN 0521550610)
- Pohlen et al. (2004) Pohlen, M., Balcells, M., Lütticke, R., & Dettmar, R.-J. 2004, A&A, 422, 465
- Schmidt (1963) Schmidt, M. 1963, ApJ, 137, 758
- Seth et al. (2005a) Seth, A. C., Dalcanton, J. J., & de Jong, R. S. 2005a, AJ, 129, 1331 [Paper I]
- Seth et al. (2005b) Seth, A. C., Dalcanton, J. J., & de Jong, R. S. 2005b, astro-ph/0506117 [Paper II]
- Spitzer & Schwarzschild (1951) Spitzer, L. J., & Schwarzschild, M. 1951, ApJ, 114, 385
- Tiede et al. (2004) Tiede, G. P., Sarajedini, A., & Barker, M. K. 2004, AJ, 128, 224
- Tikhonov et al. (2005) Tikhonov, N. A., Galazutdinova, O. A., & Drozdovsky, I. O. 2005, A&A, 431, 127
- Wyse & Gilmore (1995) Wyse, R. F. G., & Gilmore, G. 1995, AJ, 110, 2771
- Yoachim & Dalcanton (2005) Yoachim, P., & Dalcanton, J. J. 2005, ApJ, 624, 701