Early-time Spitzer observations of the Type II-Plateau supernova, 2004dj
Abstract
We present mid-infrared observations with the Spitzer Space Telescope of the nearby type II-P supernova, SN 2004dj, at epochs of 89 to 129 days. We have obtained the first mid-IR spectra of any supernova apart from SN 1987A. A prominent [NiII] 6.64 m line is observed, from which we deduce that the mass of stable nickel must be at least . We also observe the red wing of the CO-fundamental band. We relate our findings to possible progenitors and favour an evolved star, most likely a red supergiant, with a probable initial mass between 10 and 15 .
Subject headings:
supernovae: general — supernovae: individual(SN 2004dj (catalog )),1. Introduction
Core-collapse supernovae (SNe) are the end points of most stars more massive than 8. As such, they provide a key test of stellar evolution. Furthermore, they play a major role in driving the chemical and dynamical evolution of galaxies, and have also been proposed to be major contributors to dust at epochs when the Universe was still young () (e.g. Todini & Ferrara, 2001).
SN explosions provide unique natural laboratories for studying, in real time, the physics of a variety of combustion, hydrodynamic, nuclear, and atomic processes. While SNe constitute important astronomical sources over all wavelength ranges, the combination of strong absorption by the Earth’s atmosphere and the high background at mid-IR wavelengths has meant that this region has thus far remained inaccessible for the study of SNe, apart from the exceptionally nearby SN 1987A (e.g. Roche et al., 1993; Wooden et al., 1993).
Nevertheless, the mid-IR region holds the potential of providing unique insights into the nature of SN explosions and the role played by dust in these events. Although abundance measurements have long been carried out using UV/optical spectra, the large number of lines coupled with strong Doppler broadening leads to line-blending resulting in ambiguities in species identification and errors in flux measurement. In contrast, the fewer line transitions and much-reduced sensitivity to extinction in the mid-IR, allows firm line identifications and accurate measurements of intrinsic line strength. Abundance measurements using fine-structure lines are particularly robust as these are largely insensitive to temperature. Furthermore, warm dust that may condense in the ejecta emits most strongly in the mid-IR. Moreover, by monitoring the mid-IR spectral energy distribution and evolution, we may discriminate between pre-existing circumstellar dust and newly condensing dust in the ejecta.
The advent of the Spitzer Space Telescope (SST; Werner et al., 2004) with its vastly improved mid-IR sensitivity/spatial resolution combination, compared with previous instrumentation, has finally opened up the possibility of studying typical nearby SNe in the mid-IR. In this Letter, we report on the first mid-IR results for SN 2004dj, the nearest SN in over a decade.
SN 2004dj was discovered in the nearby nearly face-on spiral galaxy NGC 2403 on 2004 July 31 by K. Itagaki at a visual magnitude of +11.2 (Nakano et al., 2004). It appears within a star cluster (Sandage 96; Sandage, 1984; Maíz-Apellániz et al., 2004). A spectrum obtained on 2004 August 03 by Patat et al. (2004) revealed SN 2004dj to be a type II-P (plateau) SN at an epoch of 3 weeks post-explosion. In what follows, we assume an explosion date of 2004 July 10. Korcáková et al. (2005) present an -band light curve which shows that the plateau phase had ended by about +100 d post-explosion. NGC 2403 lies within the M81 group at a distance of 3.13 Mpc (Freedman et al., 2001). About a month post-explosion, SN 2004dj was also detected at radio and X-ray wavelengths (Stockdale et al., 2004; Pooley & Lewin, 2004).
| Flux (mJy) | ||||||||||
|---|---|---|---|---|---|---|---|---|---|---|
| Epoch | texp | IRAC | Epoch | texp | MIPS | |||||
| Date | (d) | (s) | 3.6 | 4.5 | 5.8 | 8.0m | Date | (d) | (s) | 24m |
| 2004 Oct. 07 | +89 | 150 | 9.990.03‡ | 7.600.03 | 6.530.05 | 4.090.04 | †2004 Oct. 12 | +94 | 41.9 | 1.10.3 |
| †2004 Oct. 10 | +92 | 240 | 10.820.03 | 8.640.03 | 6.150.05 | 3.930.04 | 2004 Oct. 14 | +96 | 165.7 | 1.2 |
| †2004 Oct. 12 | +94 | 240 | 7.410.03 | 8.430.03 | 5.720.05 | 3.390.04 | †2004 Oct. 16 | +98 | 41.9 | 1.0 |
| 2004 Nov. 01 | +114 | 150 | 4.560.02 | 6.670.02 | 4.480.04 | 2.480.04 | 2004 Nov. 06 | +119 | 165.7 | 1.1 |
Notes. The epochs are for an assumed explosion date of 2004 Jul. 10 (Patat et al., 2004). texp is the on-source integration time. Photometry was carried out using a 36 radius aperture for all four IRAC bands. Aperture corrections of 1.12, 1.12, 1.14, and 1.23 were applied to channels 1-4 respectively (cf. Table 5.7 of the IRAC data handbook). For the 24m MIPS data, we used a 56 radius aperture (aperture correction = 1.72; MIPS data handbook, Fig. 3.2). Using a 60 radius aperture for the MIPS 70m channel, we estimate a rough upper limit of 10 mJy. texp at 70 and 160m is, respectively, 125.8 and 25.2 s for our set-up, and 41.9 and 4.2 s for the SINGS set-up. ‡ The errors shown above are statistical errors only. Note that systematic errors in the calibration can be as large at 10%, although the relative errors are likely to be much smaller. † SINGS data.
2. Observations
SN 2004dj was observed with the SST as part of Director’s Discretionary Time (DDT) Program 226. Here we report on the first two of four epochs with all three instruments (IRAC, MIPS, IRS) at epochs of +89 to +139 d. Two further epochs of IRAC and MIPS images were serendipitously obtained from the Spitzer Investigation of Nearby Galaxies (SINGS) Legacy project (Spitzer PID 159; Kennicutt et al., 2003) in 2004 October.
2.1. Photometry
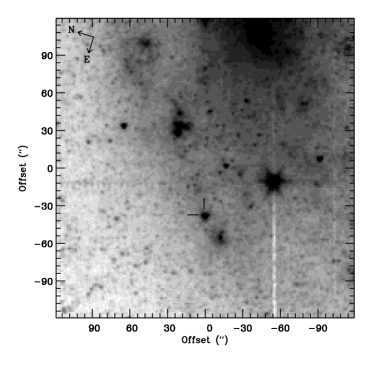
From the IRAC images it is clear that we have detected a source coincident with the position of SN 2004dj (Fig. 1). That this source is dominated by emission from the SN is evident from its fading with time (Table 1). Aperture photometry was carried out on the IRAC and MIPS (24m) post-BCD image mosaics using GAIA. We repeated the procedure for two IRAC epochs (+89 and +114 d) using the APEX software applied to the BCD frames and found generally consistent results. The results of our measurements are given in Table 1. The SN was not detected in the 70 and 160m MIPS channels, probably due to a combination of high host galaxy background and poorer spatial resolution in these channels.
Sugerman et al. (2005) have reported the rapid (5-day) decline of SN 2004dj at mid-infrared wavelengths. We point out that between +89 d and 114 d the plateau phase was ending (Korcáková et al., 2005) which accounts for the rapid decline in the 3.6m and 8.0m channels during this time. The slower decline at the other two wavelengths is probably due to the emerging CO fundamental band emission (see § 3.1). There is also apparent evidence of a slower decline at 24 m, but this only significant at the 80% level. We therefore do not discuss it further.
2.2. Spectroscopy
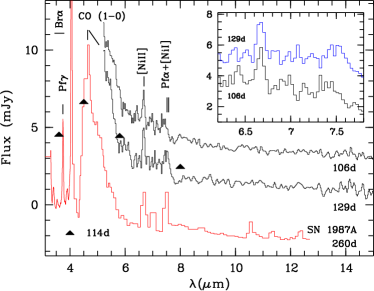
Spectra were obtained on 2004 October 24 (+106 d) and 2004 November 16 (+129 d) using the Short-Low (SL, m; R = 64-128) and Long-Low (LL, m; R = 64-128) modules of the Infrared Spectrograph. The observations were performed in staring mode. Total time-on-source for both epochs are 609.5 s in SL and 629.1 s in LL. Module slits were positioned relative to a reference star using a moderate-accuracy peak-up with the blue (16m) channel.
The SL data were preprocessed using version S11.0.2 of the Spitzer data processing pipeline. Subsequent reduction of these post-BCD data was carried out within the FIGARO 4 environment. We removed the background emission by differencing the two nod positions. For the first order SL spectrum, the sky position (for both epochs) unfortunately landed on a cluster of bright sources, rendering it unusable. We therefore extracted the spectrum from the single uncontaminated nod position. We used the ‘tune’ tables for the wavelength calibration. Flux calibration was carried out in two steps: each order was calibrated separately using the FLUXCON keywords provided. We then merged the spectra, manually clipping the ends of each order where the noise increases significantly. The spectra were scaled to match our day +114 IRAC channel 3, 4 photometry. The IRS epochs are, respectively, 8 d before and 15 d after this IRAC epoch, but no other post-plateau IRAC points were available. However, the very slow mid-IR evolution of SN 1987A around these epochs suggests that the fluxing error introduced by the epoch differences is probably small. We applied scaling factors of of 0.84 and 0.8 to the 106 and 129 d spectra respectively. The uncertainty in these factors is 15% which probably dominates the overall fluxing error. We repeated the above reduction sequence for the +106 d spectrum, but this time starting from the BCD data and found excellent agreement with the post-BCD results. The spectra are shown in Fig. 2. The SN was not detected in the LL modules.
We supplemented the IRS data with 0.9-2.4 m spectroscopy carried out on 2004 November 24 (+137d) using the LIRIS instrument mounted at the Cassegrain focus of the William Herschel Telescope. These data were obtained using the low-resolution and grisms in the standard ABBA pattern with 10″ nods. The data were reduced in the usual fashion; the F6 dwarf, BS 3028, was our chosen flux standard. Final fluxing was achieved by comparison with field stars in the - and -band acquisition images, calibrated using 2MASS data. The derived SN magnitudes are and . We used these values to derive scaling factors (1.14 and 2.68) which we applied to the near-IR spectrum shown in Fig. 3. (The 2MASS pre-explosion magnitudes of the underlying cluster are and ).
3. Analysis
3.1. Carbon Monoxide
The two IRS spectra show little difference in overall appearance. The blue-most region (see Fig. 2), is dominated by a rapidly rising slope which we identify with the red wing of the carbon monoxide fundamental (4.65 m). This identification is reinforced by the clear detection of (i) the first overtone of CO at m (Fig. 3) and (ii) the growth with time of the excess flux in channels 2 and 3 compared with channels 1 and 4 (see Table 1).
Molecule formation provides a sensitive diagnostic of the conditions and degree of mixing in the SN ejecta. Cooling by CO sets the temperature structure, allowing the temperature to drop to 1600 K within a few photospheric radii. As it is optically thick, the CO-fundamental band forms at several times the photospheric radius, while the first overtone forms close to the photosphere (defined to be where the Thomson scattering optical depth = 1). Thus, the ratio of the fundamental to the first overtone provides a powerful means for constraining both temperature and density. We use our near-simultaneous fundamental and first-overtone observations to investigate conditions in the SN 2004dj ejecta. Only a summary of first results is given here, as a more detailed analysis will be presented elsewhere.

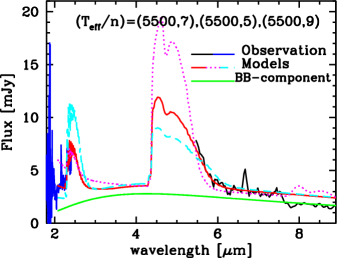
We selected the explosion model from Chieffi et al. (2003) that best matched the plateau duration of SN 2004dj and adjusted the 56Ni mass to match the radioactive tail. The parameters of this model were: , explosion energy = erg, and Ni)=0.03. Detailed radiative transport calculations were performed by solving the time-dependent rate equations for the formation of CO and SiO molecules, following Liu et al. (1992). We recalculated the temperature structure for the optically thin layers under the assumption of radiative equilibrium and evolved the model up to day 130, when the photosphere had receded well into the He-enriched layers, the structure of which depends on the details of several processes e.g. mixing. We investigated the sensitivity to various parameters of CO formation, by computing an exploratory grid of 36 models with the photospheric temperature, photospheric expansion velocity, and density profiles above the recombination zone in the range , , . We find a best fit with K and (Fig. 4), values which corroborate a 15 progenitor.
The slope of the spectral energy distribution in the near-IR requires an underlying continuum to adequately fit the data (see Fig. 4). If this is due to dust from the SN, then given the relative youth of SN 2004dj, it is likely to be due to pre-existing circumstellar dust, rather than newly condensing dust. A more likely source of this continuum is the underlying cluster. Using Starburst99 models, Maíz-Apellániz et al. (2004) infer that the cluster contains 12 red supergiants, which is broadly consistent with the near-IR flux from our data, as well as the pre-explosion and magnitudes.
3.2. Stable Nickel
The other conspicuous feature in the SN 2004dj mid-IR spectra is a prominent emission feature at 6.67m which we identify as the [NiII] m fine-structure line. This is produced by the a2D3/2-a transition to the ground state. That this line is already visible at the start of the radioactive tail, constrains the degree of mixing of the ejecta. The line is unresolved, indicating an expansion velocity of . Its intensity at 106 d is erg s-1cm-2, rising to erg s-1cm-2 on day 129. We used this line to estimate the mass of Ni+. The critical density for the 6.63 m transition is cm-3 (e.g. Wooden et al., 1993). At an epoch of 100 d it is likely that the electron density was above this value. For example, Clocchiatti et al. (1996) estimate an electron density of cm-3 within 2500 for the Type II SN 1992H at 100 d. On this basis, we deem a simple LTE treatment to be valid. A-values were taken from Quinet & Le Dourneuf (1996) and partition function values from Halenka et al. (2001). The Ni+ mass was estimated for 3000 K and 6000 K. As expected, the result was rather insensitive to temperature. At 106 d and T=3000 K we obtain M(Ni+)=1.7 M⊙. Similar values were obtained with T=6000 K. At 129 d we obtain M(Ni+)=2.2 M⊙, again with similar values for both temperatures. Sobolev optical depths at the two epochs were 0.2 and 0.4, respectively.
Given the clear presence of the [Ni II] 6.634 m line, we examined the spectra for the [Ni I] 7.50 m line which is produced by the a3F3-a3F4 transition to ground. While there is little sign of this line at 106 d, by 129 d there is a feature whose red wing corresponds exactly to the expected location of the 7.50 m line. We therefore suggest that the 7.50 m line is present, but blended with another line to the blue. The most likely candidate is Pf (7.46m). There may also be contributions to the observed feature from Hu (7.50m) and H7-11 (7.51m). Consequently direct measurement of the [Ni I] 7.50 m line intensity is impractical. In a future paper, estimates will be made of the flux contribution from the H I lines in order to determine the intensity of the [Ni I] line.
At 129 d, virtually all the Ni must be made up of stable isotopes, dominated by 58Ni. The derived mass can be regarded as a firm lower limit for the total stable Ni mass. As already indicated, it is likely that flux from Ni0 is also present. Moreover, the [NiII] line is close to being optically thick. The presence of a significant continuum suggests that yet more Ni lies below the photosphere.
3.3. Constraints on the progenitor mass
Following Hamuy (2003), we use the -band luminosity of the exponential tail of the light curve111 Reported on http://www.astrosurf.com/snweb2/2004/04dj/04djCurv.htm after 100 d to estimate the mass of 56Ni. We find a mean mass of 0.022 which suggests a progenitor mass of (Woosley & Timmes, 1996) and is consistent with the value used in §3.1.
Thielemann et al. (1996) predict stable Ni masses for core-collapse SNe having progenitor masses of 13–25 M⊙. Up to 20 M⊙, they predict masses of 0.007–0.013 M⊙, but a much lower value of 0.002 M⊙ for a 25 M⊙ star. At this early epoch, our lower limit does not yet constrain this mass range. However, as the SN expands, we will be able to to obtain a more definitive Ni mass estimate.
By fitting a variety of cluster spectral energy distributions, Maíz-Apellániz et al. (2004) have inferred that Sandage 96 is a 13.6 Myr cluster with a turn-off mass of 15. Although they favour a red supergiant progenitor for SN 2004dj, they could not completely rule out a blue supergiant progenitor. Our CO analysis (§3.1) supports a red supergiant progenitor. This is indirectly supported by the lack of PAH features (at 6.2, 7.7, 8.6, and 11.3 m) which trace the far-UV stellar flux and therefore, the young, hot stellar population (Peeters et al., 2004).
References
- Chieffi et al. (2003) Chieffi, A., Domínguez, I., et al., 2003, MNRAS, 345, 111
- Clocchiatti et al. (1996) Clocchiatti, A., Benetti, S., et al., 1996, AJ, 111, 1286
- Freedman et al. (2001) Freedman, W.L. et al., 2001, ApJ, 553, 47
- Halenka et al. (2001) Halenka, J., Madej, J., et al., 2001, Acta Astr., 51, 347
- Hamuy (2003) Hamuy, M., 2003, ApJ, 582, 905
- Kennicutt et al. (2003) Kennicutt, R.C. Jr et al., 2003, PASP, 115, 928
- Korcáková et al. (2005) Korcáková, D., Mikulásek, Z., et al., 2005, IBVS, 5605, 1
- Liu et al. (1992) Liu. W., et al. 1992, ApJ, 396, 679
- Maíz-Apellániz et al. (2004) Maíz-Apellániz, J., Bond, H.E., et al., 2004, ApJ, 615, L113
- Meikle et al. (1989) Meikle, W.P.S., Allen, D.A., et al., 1989, MNRAS, 238, 193
- Nakano et al. (2004) Nakano, S., 2004, IAU Circ. 8377
- Patat et al. (2004) Patat, F., et al. 2004, IAU Circ. 8378
- Peeters et al. (2004) Peeters, E., Spoon, H., et al., 2004, ApJ, 613, 986
- Pooley & Lewin (2004) Pooley, D., & Lewin, W.H.G., 2004, IAU Circ. 8390
- Pozzo et al. (2005) Pozzo, M., Meikle, W.P.S. et al., MNRAS (to be submitted)
- Quinet & Le Dourneuf (1996) Quinet, P. & Le Dourneuf, M., 1996, A & AS 119, 99
- Roche et al. (1993) Roche, P.F. et al., 1993, MNRAS, 261 522
- Sandage (1984) Sandage, A., 1984, AJ, 89, 630
- Stockdale et al. (2004) Stockdale, C.J., Sramek, R.A., et al., 2004, IAU Circ. 8379
- Sugerman et al. (2005) Sugerman, B., et al. 2005, IAU Circ. 8489
- Thielemann et al. (1996) Thielemann, F.-K., et al. 1996 ApJ, 460, 408
- Todini & Ferrara (2001) Todini, P., Ferrara, A., 2001, MNRAS, 325, 726
- Werner et al. (2004) Werner, M. et al., 2004, ApJS, 154, 1
- Wooden et al. (1993) Wooden, D.H., Rank, D.M., et al., 1993, ApJS, 88, 477
- Woosley & Timmes (1996) Woosley, S.E., & Timmes, F.X., Nucl.Phys.A., 606, 137