Galaxy Rotation Curves Without Non-Baryonic Dark Matter
Abstract
We apply the modified acceleration law obtained from Einstein gravity coupled to a massive skew symmetric field to the problem of explaining galaxy rotation curves without exotic dark matter. Our sample of galaxies includes low surface brightness (LSB) and high surface brightness (HSB) galaxies, and an elliptical galaxy. In those cases where photometric data are available, a best fit via the single parameter to the luminosity of the gaseous (HI plus He) and luminous stellar disks is obtained. Additionally, a best fit to the rotation curves of galaxies is obtained in terms of a parametric mass distribution (independent of luminosity observations) -- a two parameter fit to the total galactic mass, (or mass-to-light ratio ), and a core radius associated with a model of the galaxy cores using a nonlinear least-squares fitting routine including estimated errors. The fits are compared to those obtained using Milgrom’s phenomenological MOND model and to the predictions of the Newtonian-Kepler acceleration law.
1 Introduction
In spite of intensive searches for the components of non-baryonic dark matter, no candidate particles have been observed. This leads one to search for a gravity theory that can explain galaxy dynamics without the need for exotic dark matter. Such a possible model was introduced in Milgrom (1983), and for more than twenty years since its publication, attempts to form a consistent relativistic theory containing Milgrom’s phenomenological model have been pursued (Bekenstein , 2004; Sanders , 2005). A generalization of Einstein’s general relativity (GR) based on a pseudo-Riemannian metric tensor and a skew symmetric rank three tensor field , called metric-skew-tensor-gravity (MSTG), leads to a modified acceleration law that can explain the flat rotation curves of galaxies and cluster lensing without postulating exotic dark matter (Moffat , 2005a). A relativistic scalar-tensor-vector gravity (STVG) theory has also been developed which yields the same modified acceleration law as MSTG, and provides an effective description of the running of the , and with space and time (Moffat , 2005b).
A cosmological model obtained from the field equations and a running of the effective gravitational coupling constant can also explain the growth of large scale structure formation without invoking cold dark matter. The running of the cosmological constant would produce a quintessence-like dark energy that could account for the acceleration of the expansion of the universe (Perlmutter et al. , 1997; Riess et al. , 1998, 2004; Garnavich et al. , 1998; Spergel et al. , 2003; Bennett et al. , 2003).
A renormalization group (RG) framework (Reuter & Weyer , 2004a, b) for MSTG was developed to describe the running of the effective gravitational coupling constant , and the effective coupling constant that measures the strength of the coupling of the field to matter. A momentum cutoff identification associates the RG scales to points in spacetime. For the static, spherically symmetric solution, the RG flow equations allow a running with momentum and proper length and provides for a spatial variation of the effective Newton’s coupling constant, ; together with a variation of the skew field coupling constant, , to matter; and the effective mass of the skew field where denotes the radial coordinate. Such a ‘‘running’’ of coupling constants and mass are well-known from particle physics (e.g. quantum chromodynamics) and condensed matter and are applied here to the behavior of the infrared fixed point of the renormalization group method of quantum gravity. The form of as a function of , obtained from the modified Newtonian acceleration law, leads to agreement with solar system observations, terrestrial gravitational experiments and the binary pulsar PSR 1913+16 observations, while strong renormalization effects in the infrared regime at large distances lead to fits to galaxy rotation curves.
In this paper, a fit to both low surface brightness (LSB) and high surface brightness (HSB) galaxies over the range from dwarf galaxies to giant galaxies is achieved in terms of the total galaxy mass (or ) without exotic dark matter. A satisfactory fit is achieved to the rotational velocity data generic to the elliptical galaxy NGC 3379. A model of the modified acceleration law that includes a description of radial velocity curves in the core of galaxies as well as in the outer regions of the galaxy is shown to yield good fits to rotational velocity data. The significance of this result is made explicit by the depth of the galaxy rotation curve study, here. We performed photometric fits to 58 HSB and LSB and Dwarf galaxies utilizing a single parameter -- the ratio of the stellar disk. 29 of these galaxies were based upon band and the remaining 29 galaxies were based upon band. The band data is the more modern data set and is a more precise tracer of the mean radial distribution of the dominant stellar population -- these were the photometric results of Ursa Major. Since 2001, the Ursa Major data has been revised since the estimated distance to the cluster is now taken as 18.6 Mpc as opposed to the original publication’s use of 15.5 Mpc. We updated the original analysis of Sanders & Verheijen (1998) using that group’s Groningen Image Processing System (GIPSY)111http://www.astro.rug.nl/~gipsy/.
In addition, we performed 101 galaxy rotation curve fits to HSB and LSB and Dwarf galaxies (including the 58 galaxies that were fit photometrically) using a parametric mass distribution. These fits were necessary for those galaxies for which photometric data of the HI gas (corrected for He component) and stellar disk was unavailable. Although the model contains two parameters as opposed to one parameter for the photometric fits, it makes no assumptions on the constancy of the ratio within a galaxy although it does not distinguish between gas or stellar disk.
A comparison of the fits to the rotational velocity curve data obtained from MSTG and Milgrom’s MOND reveals that the results from both models are qualitatively similar for almost all of the galaxy data fitted, although predictions of the galactic masses differ.
2 Modified Acceleration Law
From the derivation of the radial acceleration experienced by a test particle in a static, spherically symmetric gravitational field due to a point source, we obtain (Moffat , 2005a, b):
| (1) |
Here, is defined to be the effective gravitational constant at infinity
| (2) |
where is Newton’s ‘‘bare’’ gravitational constant. This conforms with our definition of in the RG flow formalism, which requires that the effective be renormalized in order to guarantee that equation (1) reduces to the Newtonian acceleration
| (3) |
at small distances . We model the coupling constant for the repulsive Yukawa force contribution in equation (1) by
| (4) |
where is a coupling parameter. We obtain the acceleration on a point particle
| (5) |
By using equation (2), we can express the modified acceleration in the form
| (6) |
We can rewrite equation (6) as
| (7) |
where
| (8) |
Thus, describes the running with distance of the effective gravitational constant in the RG flow scenario.
The gravitational potential for a point source obtained from the modified acceleration formula (6) is given by
| (9) |
We apply equation (6) to explain the flatness of rotation curves of galaxies, as well as the approximate Tully-Fisher law (Tully & Fisher , 1977), , where is the rotational velocity of a galaxy, is the galaxy mass
| (10) |
and is the galaxy luminosity. Here, , and denote the visible mass, the mass of neutral hydrogen, possible dark baryon mass and gas, and the mass from the skew field energy density, respectively.
The rotational velocity of a star obtained from is given by
| (11) |
Let us postulate that the parameters and give the magnitude of the constant acceleration
| (12) |
We assume that for galaxies and clusters of galaxies this acceleration is determined by
| (13) |
Here, is the current measured Hubble constant where (Eidelman et al. , 2004)222http://pdg.lbl.gov. This gives
| (14) |
We note that , so there is an interesting connection between the parameters , and the cosmological constant .
Let us now describe a model of a spherically symmetric galaxy such that the density of visible matter, , contains an inner core at radius . The acceleration law of equation (6) takes the form
| (15) |
where
| (16) |
is the total amount of ordinary matter within a sphere of radius . A simple model for is
| (17) |
where
| (18) |
The constituents of in equation (15) and (17) are determined by equation (10). The density of ordinary matter is given by
| (19) |
so that we have
| (20) |
Well inside the core radius, where , the density constant for HSB galaxies with . Although for LSB galaxies, it is the case for that for . This behavior is quickly suppressed and the density profile shows no rapid change for . Indeed the choice of for LSB galaxies was found to be favorable because it resulted in a more slowly rising mass profile (the integrated density distribution) for small . This critical distinction between high and low surface brightness galaxies has been studied in the context of cold dark matter, with the common conclusion that the rotation curves of LSB and Dwarf galaxies rise more slowly than those of HSB galaxies (or elliptical galaxies) (de Blok & McGaugh , 1996; de Blok et al. , 2003; Bailin et al. , 2005). However, the ordinary matter density of equation (20) does not exhibit the divergent or cuspy behavior for either HSB or LSB galaxies, contrary to the observations in these cold dark matter studies. Moreover, provided (which is the result for all the galaxies fitted), then we see that the exponential factor in the acceleration law of equation (15) has a damping effect well within the core radius such that the dynamics for is described by Newtonian theory. Thus the high resolution rotation curves for the LSB galaxies provide a clean testing ground for any theory of galaxy rotation curves. Without the distinction we have implemented by equation (18), the quality of our rotation curve fits would not be as good.
Well outside the core radius, where , equation (17) implies that
| (21) |
and the acceleration is described by equation (6).
For those galaxies for which there is photometric data available, the observed luminosity of the gaseous disk (HI plus He), and the stellar components (the disk and separately the bulge) can be used to provide a more precise fit to the velocity curve data, which would include the kinkiness of the rotation curves. By assuming a constant ratio, it is possible to invert the Poisson equation for the potential, yielding the mass distributions of the individual constituents. This results in a single parameter fit -- . By including the bulge, a more precise fit is possible, in principle. However this would necessitate a second parameter which may be seen as a weakness to this approach. We choose to provide the single parameter fit -- which we present for comparison. We note that the assumption of constant ratio forces an averaging over the radial distances thereby working to reduce the accuracy of the photometric fits. Our parametric mass model requires no assumptions on the ratio of . The photometric fits also include the assumption that the HI gas is on stable circular orbits around the centers of the galaxies. This assumption may be violated for interacting galaxies, or in galaxies with strong bars. The photometric fits also utilize a correction of the mass for the Helium fraction, which is based on the results from Big-Bang nucleosynthesis and is not well known.
The rotational velocity derived from the acceleration law equation (15) is
| (22) |
The modified acceleration law equation (15) can be compared to the Newtonian law using equation (17):
| (23) |
The gravitational acceleration described by Milgrom’s phenomenological MOND model (Milgrom , 1983; Sanders & McGaugh , 2002) is given by
| (24) |
where is a function that interpolates between the Newtonian regime, , when and the MOND regime, , when . The function normally used for galaxy fitting is
| (25) |
3 Galaxy Rotational Velocity Curves
A good fit to LSB and HSB galaxy data is obtained with the parameters
| (26) |
where we have substituted the value of from equation (14) into equation (12), relating the parameters and . Thus, the modified acceleration law contains only a single parameter, or , which once set as in equation (26) is universal for galaxies and is no longer a free parameter for fitting the galaxy rotation curves.
We allow for the smaller scale Dwarf galaxies, for which the outermost observed radial position, , by rescaling equation (26) such that the values for and continue to satisfy the conditions (12) and (13):
| (27) |
The RG flow equations do indeed require that the parameters and are scale parameters and thus it is expected that while we may obtain reasonable fits assuming they are roughly constant within a set population, this is an approximation. We are able to fit all HSB galaxies with a fixed and . We are also able to fit all LSB and Dwarf galaxies by rescaling the HSB fixed values of and by a factor of 4 and 2, respectively. This is done to keep the number of parameters to an absolute minimum while respecting the fact that the parameters and are determined by the scale of the system and should be different for HSB vs. LSB and Dwarf galaxies.
The fits to the galaxy rotation curves, , in km/s versus the galaxy radius, , in kpc are shown in Figs. Galaxy Rotation Curves Without Non-Baryonic Dark Matter through 5. The acceleration law is given by equation (15); and the rotational velocity by equation (22).
3.1 Photometric Velocity Curve Fits
The fits to the data in Fig. Galaxy Rotation Curves Without Non-Baryonic Dark Matter and 5 are based on the photometric data of the gaseous disk (HI plus He) component and luminous stellar disk component and only a single parameter is used to fit the rotation curves. The data includes 29 galaxies -- both LSB and HSB galaxies -- obtained from de Blok & McGaugh (1998); de Blok et al. (2001a, b); Begeman et al. (1991); McGaugh et al. (2001); Sanders & McGaugh (2002); Sanders (1996) and an additional 29 galaxies from the Ursa Major (UMa) cluster of galaxies derived from Sanders & Verheijen (1998); Verheijen (2001); Verheijen & Sancisi (2001). For the UMa cluster of galaxies, available -band data was used to reproduce the velocity profiles of the gaseous disk (HI plus He) distribution and luminous stellar disks (via the ROTMOD task of GIPSY333http://www.astro.rug.nl/~gipsy/). The gaseous disk (HI plus He) was assumed to be infinitely thin and to have a total mass given by
| (28) |
where the He correction factor of 4/3 is roughly determined from Big Bang nucleosynthesis, and the value of
| (29) |
where is the integrated HI flux density in units of Jy km/s as measured from the global HI profile -- taken from Column (15) of Table 2 of Verheijen (2001), and D is the distance in Mpc. We accounted for the revised distance estimate to UMa from to which has changed since the rotation curves were originally presented in Sanders & Verheijen (1998). The luminous stellar disk was assumed to be described by the Van der Kruit and Searle law, where the disk density distribution as a function of z (vertical height from the plane of the disk) is given by
| (30) |
where is the vertical scale height of the luminous stellar disk, and was assumed to be 20% of the near infrared exponential disk scale length according to Column (13) of Table 2 of Verheijen (2001).
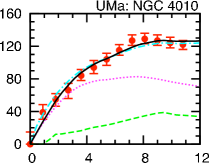
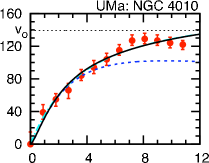
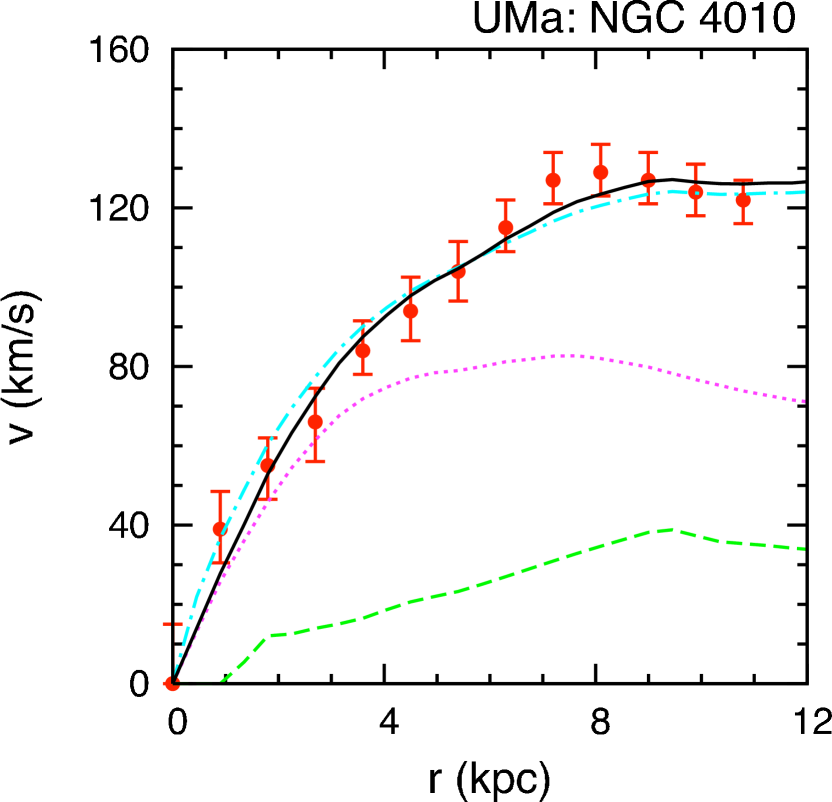
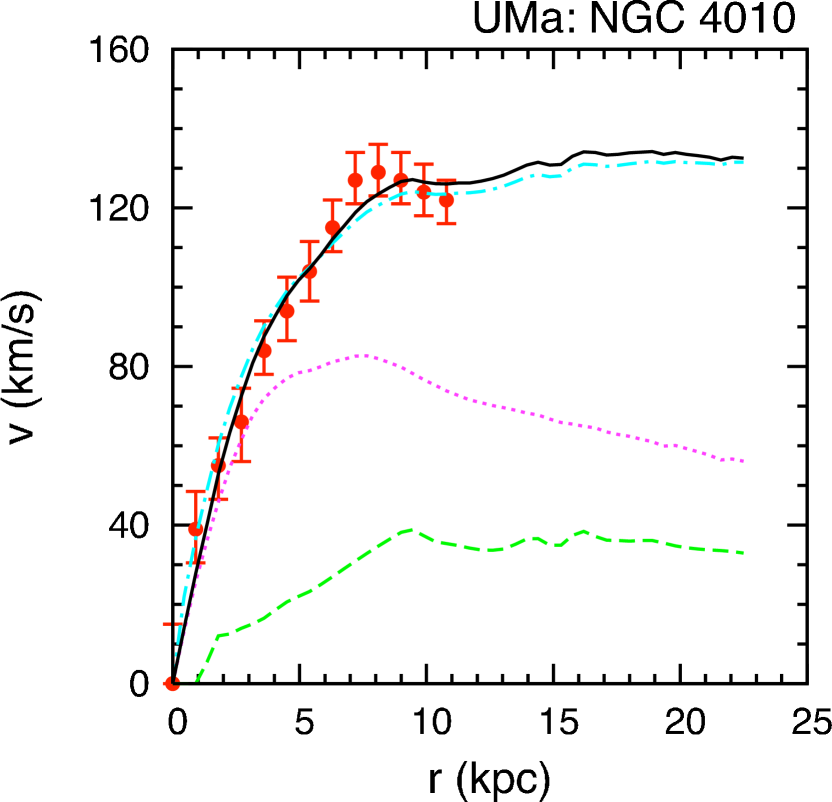
According to Sanders & Verheijen (1998) the existence of -band surface photometry is a great advantage since the near-infrared emission, being relatively free of the effects of dust absorption and less sensitive to recent star formation, is a more precise tracer of the mean radial distribution of the dominant stellar population. The principal advantages of using infrared luminosities is that stellar mass-to-light ratios are less affected by population differences and extinction corrections are minimal (Verheijen , 2001). We focus on NGC 4010 in Fig. 5 to study the effect of the extended HI and -band data (beyond the rotation curve data) on the quality fits in MSTG and MOND. The numerical results of the UMa fits are presented in Table 2.
3.2 Parametric Velocity Curve Fits
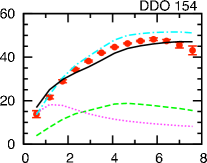
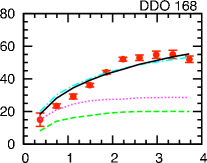
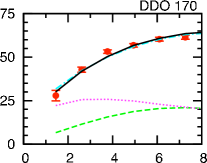
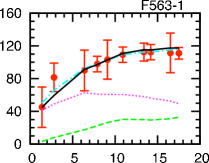
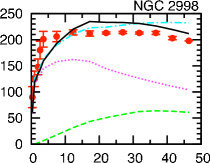
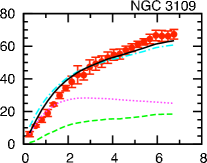
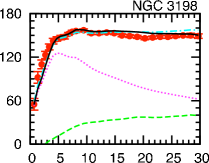
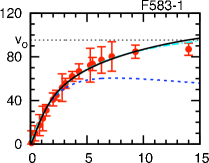
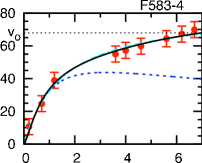
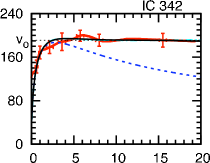
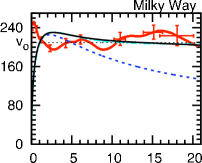
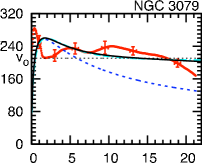
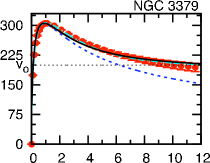
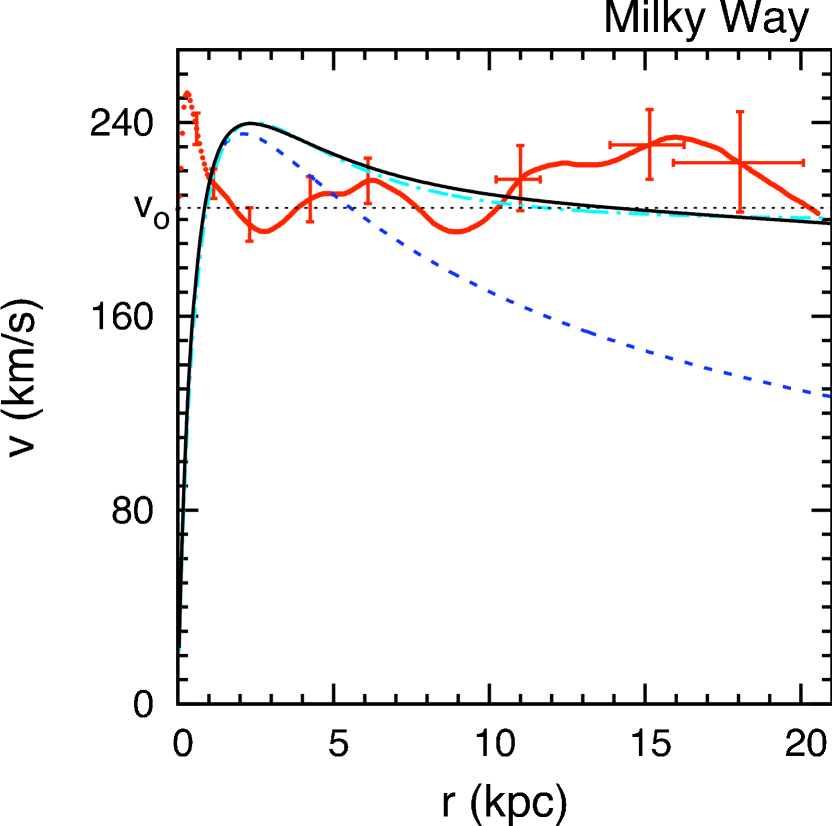
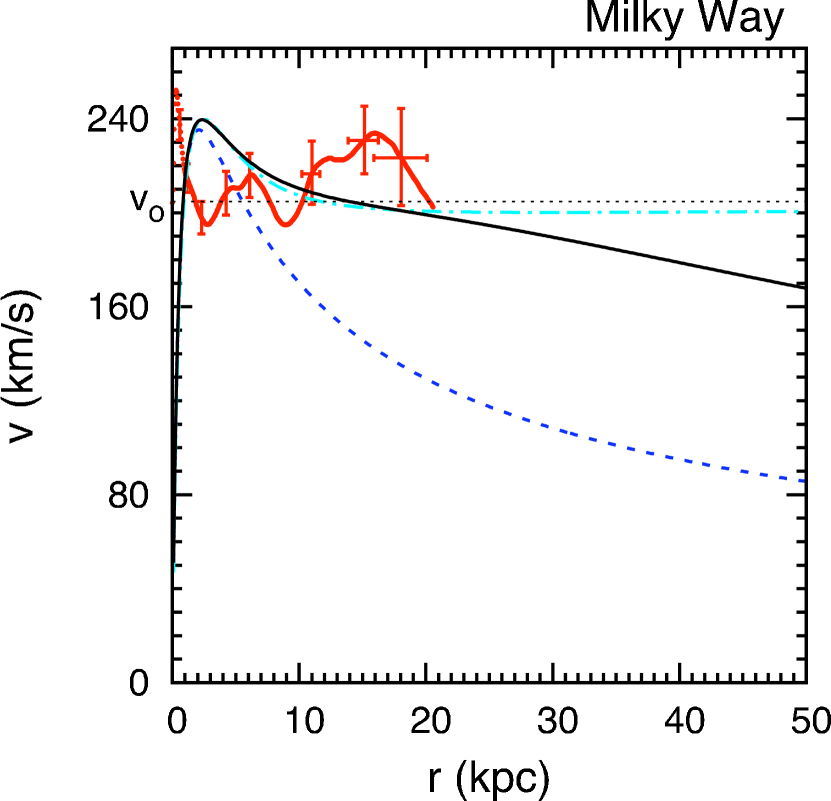
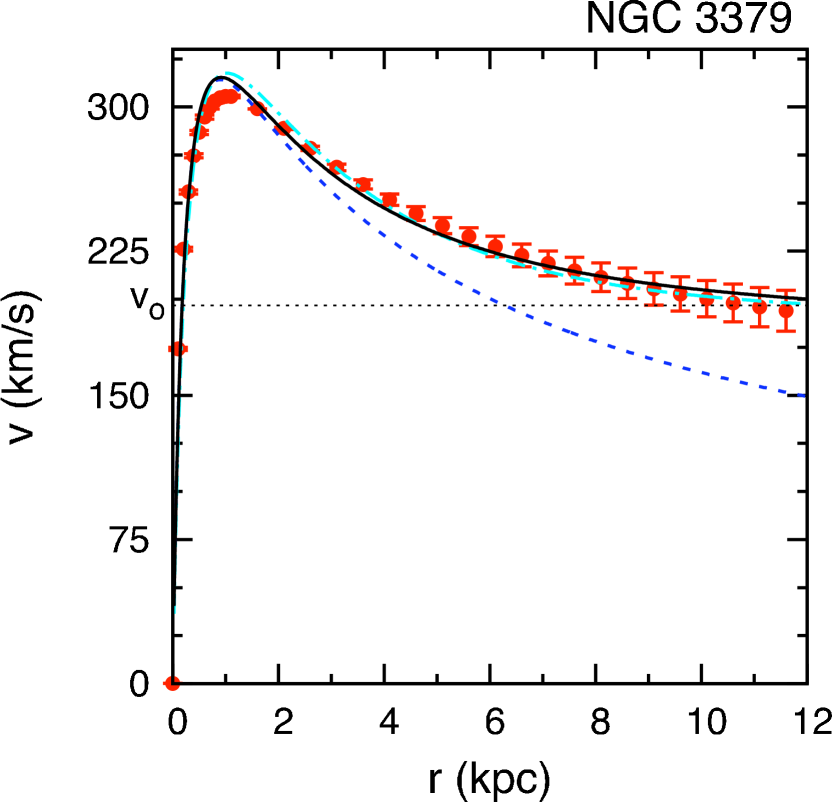
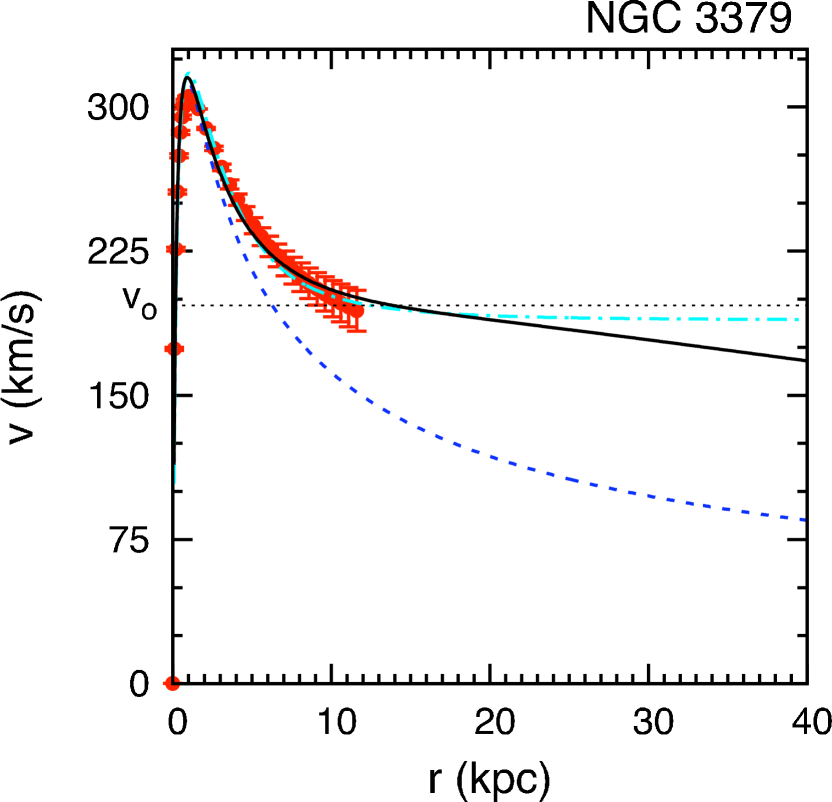
The fits to the rotation curve data shown in Figs. Galaxy Rotation Curves Without Non-Baryonic Dark Matter through 4 are based on the parametric model of equations (17) and (18). Since this model is independent of the photometric data of the gaseous disk (HI plus He) component and luminous stellar disk component, a larger database of galaxies is available including the high resolution rotation curves of Sofue (1996) and the elliptical galaxy NGC 3379 of Romanowsky et al. (2003, 2004). This adds another 42 galaxies to the complete sample as described in Table Galaxy Rotation Curves Without Non-Baryonic Dark Matter. We focus on the Milky Way in Fig. 3 and NGC 3379 in Fig. 4 to clarify the predictions of MOND and MSTG which are hard to distinguish in Fig. Galaxy Rotation Curves Without Non-Baryonic Dark Matter; but become apparent at distances beyond the edge of the visible stars. The numerical results of the fits to the complete sample are presented in Table 3.
3.3 Flat Rotation Velocity
In Milgrom’s phenomenological MOND model we have
| (31) |
We see that equation (31) predicts that the rotational velocity is constant out to an infinite range and the rotational velocity does not depend on a distance scale, but on the magnitude of the acceleration . In contrast, our modified acceleration formula does depend on the radius and the distance scale , which for galaxies is fixed by the formula equation (13). The MSTG velocity curve asymptotically becomes the same as the Newtonian-Kepler prediction as :
| (32) |
where is the renormalized value of Newton’s constant.
The flatness of the rotation curves arises due to an increased strength in the galactic gravitational potential due to the running of Newton’s constant. By taking the first and second derivative of from equation (8):
| (33) | |||||
| (34) |
and we see that has a maximum at . Therefore the rate of change of the running of the effective gravitational constant has a maximum; and it is at this point where the tendency to return to the Newtonian-Kepler behaviour of equation (32) is most opposed by the RG flow. The effect of this on the galaxy rotation curves is to produce an extended region where the curve seems flat. The velocity at is defined as :
| (35) |
is the MSTG equivalent of the flat rotational velocity; and is within the quoted experimental uncertainties to the MOND equivalent, , in those galaxies that MOND handles well. The numerical results for and with calculated uncertainties are included in Tables 2 and 3.
Using the Sloan Digital Sky Survey (SDSS), Prada et al. (2003) have studied the velocities of satellites orbiting isolated galaxies. They detected approximately 3000 satellites, and they found that the line-of-sight velocity dispersion of satellites declines with distance to the primary. The velocity was observed to decline to a distance of kpc for the available data. This result contradicts the constant velocity prediction equation (31) of MOND, but is consistent with the MSTG prediction equation (32). It also agrees with the cosmological models which predict mass profiles of dark matter halos at large distances. During the last two decades of numerical modelling of galaxy formation, they have produced a density profile of dark matter halos, at large radii, which does not depend on the nature of the dark matter (Avila-Reese et al. , 2001; Colin et al. , 2002). The results of Prada et al. (2003) are consistent with recent gravitational lensing results (Sheldon et al. , 2003).
4 The Tully-Fisher Relation
Unlike MOND, the mass -- rotational velocity relationship is not absolute as in equation (31); and indeed at distances beyond the galaxy it is expected that Kepler’s Law applies according to equation (32).
The observational Tully-Fisher relation implies a luminosity -- rotational velocity of the form (Tully & Fisher , 1977):
| (36) |
where is the total observed luminosity of the galaxy (in units of ), and is the observed velocity at the outermost observed radial position (in km/s). Verheijen (2001) considers an alternate definition of the ‘‘flat rotation velocity’’, , which categorizes galaxies according to three kinds depending on the shape of the rotation curve. The behavior of is more closely related to the asymptotic ‘‘flat rotation velocity’’. Taking the logarithm of both sides of equation (36), we obtain
| (37) |
-band luminosity data is available for practically all of the galaxies either from the original references listed in Table 3 or listed in Tully (1988). Moreover, the majority of the galaxies in this study have been detected by 2MASS in the -band. In order to calculate the total -band luminosity, apparent -band magnitudes from the 2MASS surver were used. Given an apparent -band magnitude it is possible to calculate the -band luminosity as
| (38) |
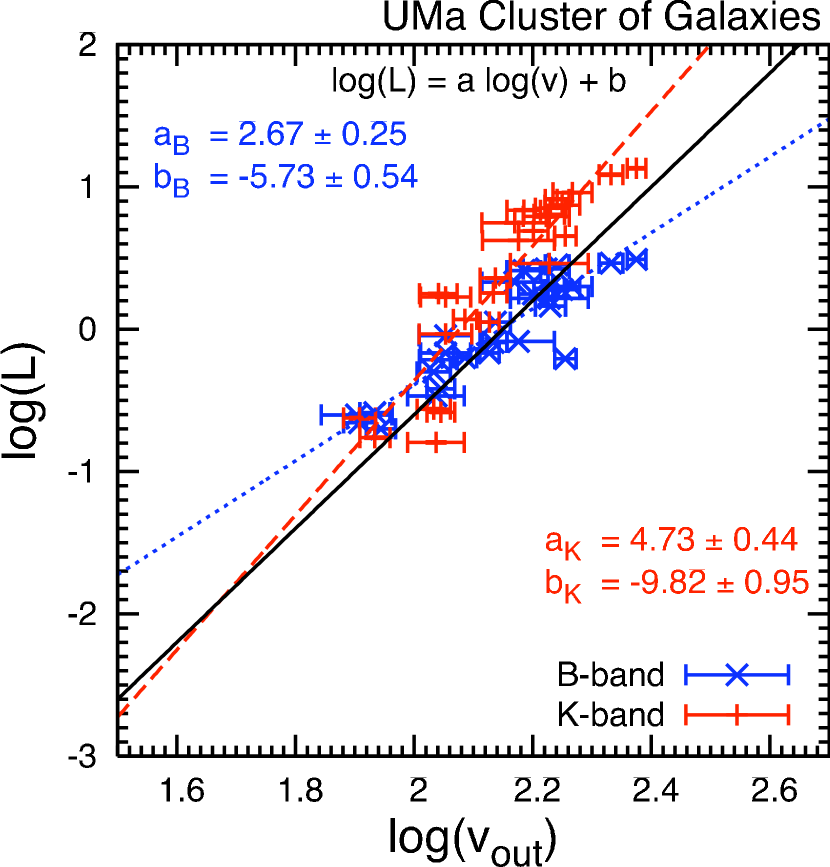
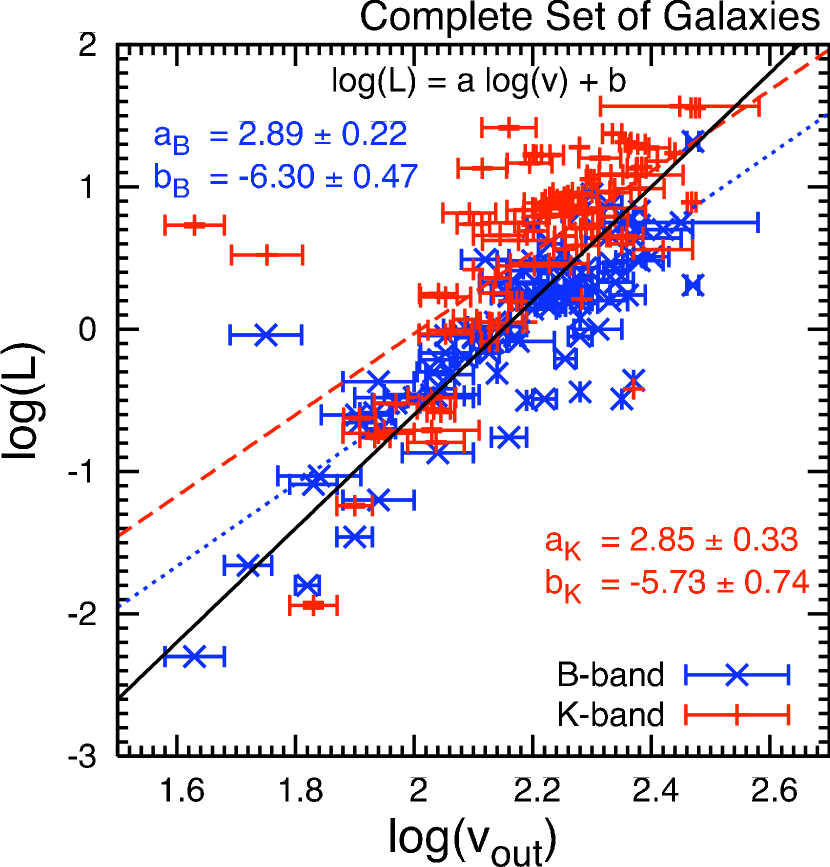
where is the -band luminosity in units of , is the -band apparent magnitude and z is the redshift of the galaxy (determined from the NASA/IPAC Extragalactic Database), and D is the distance to the galaxy in Mpc (from the original references). The term is a first order -correction. We have plotted the observed Tully-Fisher relation for LSB and HSB galaxies in Fig. 6.
As in (Sanders & Verheijen , 1998), MOND is able to make predictions on both the slope and the intercept of the logarithmic Tully-Fisher relation by assuming that the mass to luminosity ratio, , is constant across all galaxies. Although this is not the case, the assumption is enforced by using the mean mass to light ratio, , to determine the values of the slope and intercept, and , in equation (37). Replacing the observed luminosity, , in the logarithmic Tully-Fisher relation of equation (37) with
| (39) |
We obtain
| (40) |
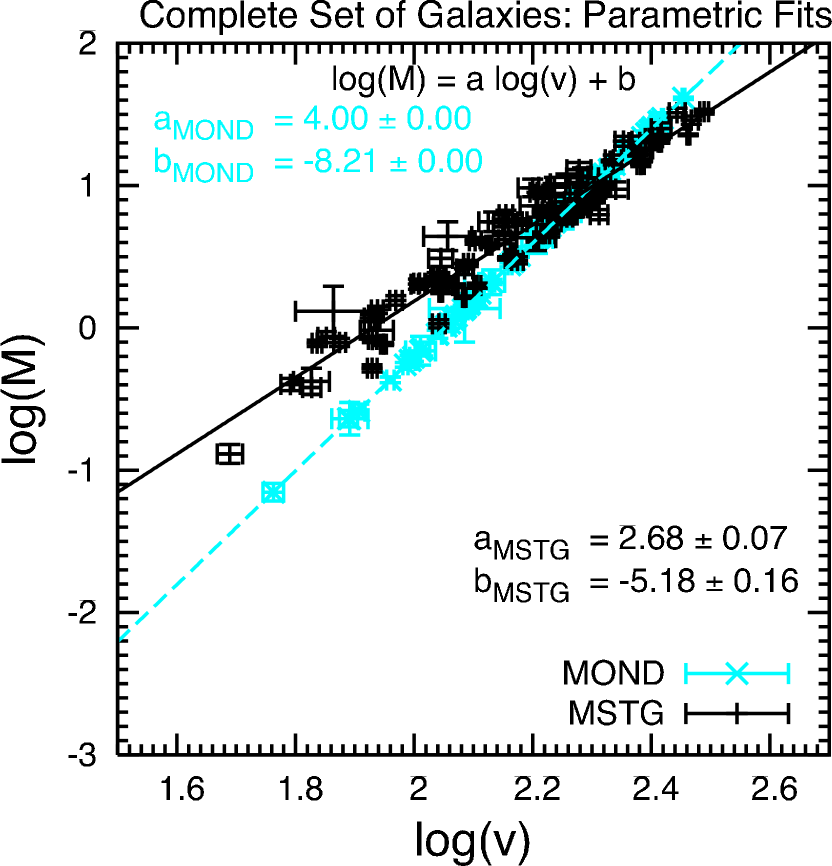
Thus, the effect of is to shift the intercept which vanishes when . We may quantify the predictions of MSTG and MOND by either computing the appropriate values which depend on the particular band of the luminosity measurements, or by considering the respective curve fits to the actual Tully-Fisher relation:
| MSTG | (41) | ||||
| MOND | (42) |
where is the MSTG ‘‘flat rotation velocity’’ of equation (35); and is the MOND asymptotic rotation velocity of equation (31). Taking the logarithm (with respect to base 10) of both sides of equation (31), we have the MOND predictions
| (43) | |||||
| (44) |
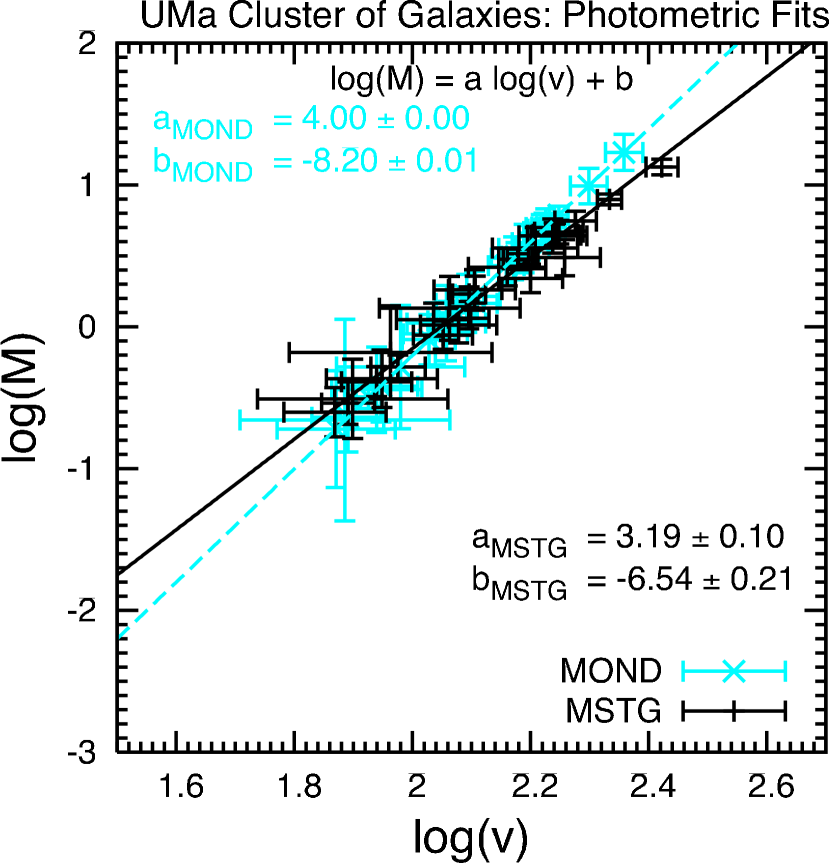
Fig. 7 shows the curve fits to equations (41) and (42) for both the photometric fits and the fits to our parametric model of equations (17) and (18). In all cases, we are able to combine the HSB, LSB and Dwarf galaxy data (and the elliptical galaxy NGC 3379) for the fitting, implying consistent physics across galaxies. The numerical results of the respective fits are presented in Table 4.
We see that a comparison of the MSTG and MOND results of the actual and observed Tully-Fisher relation show that the MSTG prediction is closer to the observational data for the complete sample and the UMa band photometry. This is most likely the result of the implicit assumption within the MOND framework that M/L is constant within each galaxy which does not appear to be the case in either the or bands.
5 Conclusions
A gravity theory consisting of a metric-skew-tensor action that leads to a modified Newtonian acceleration law (Moffat , 2005a, b) can be fitted to a large class of galaxy rotation curves. We have presented the predictions for the galaxy rotation curves from a covariant and relativistic gravitational theory without postulating non-baryonic dark matter. The only other relativistic gravity theories that have been published that have attempted to do this are Mannheim (1990, 2005) and Bekenstein (2004). The latter recent publication attempts to incorporate Milgrom’s MOND into a covariant gravitational theory. The fully relativistic gravitational theory presented in Moffat (2005a, b) is a consistent and viable example of a gravitational theory that fits the galaxy rotation curves and galaxy cluster mass X-ray data without non-baryonic dark matter Brownstein & Moffat (2005). The large sample of galaxy data which fits our predicted MSTG acceleration law warrants taking seriously the proposal that a modified gravity theory can explain the flat rotational velocity curves of galaxies without (as yet, undetected) non-baryonic dark matter. It represents an important foil in comparing modified gravitational theory with dark matter.
It is interesting to note that we can fit the rotational velocity data of galaxies in the distance range and in the mass range without exotic dark matter halos. The lensing of clusters can also be explained by the theory without exotic dark matter in cluster halos. An important prediction is that for large enough distances from the galaxy cores, the rotational velocity of stars declines as consistent with a Newtonian-Kepler fall off. This is consistent with the results of Prada et al. (2003) and gravitational lensing results for galaxies clusters (Sheldon et al. , 2003).
In order to obtain a self-consistent description of solar dynamics, galaxies, clusters of galaxies and cosmology, it is necessary to have the effective gravitational constant , the MSTG coupling constant , the mass (range ) of the skew field and the cosmological constant run with distance (time). The RG flow effective action description of MSTG quantum gravity allows for a running of these effective constants with distance and time (Moffat , 2005a, b). The RG flow framework for the theory is characterized by special RG trajectories. On the RG trajectory, we identify a regime of distance scales where solar system gravitational physics is well described by GR, which is contained in MSTG as an approximate solution to the field equations. We are able to obtain agreement with the observations in the solar system, terrestrial gravitational experiments and the binary pulsar PSR 1913+16. Strong infrared renormalization effects become visible at the scale of galaxies and the modified Newtonian potential replaces exotic dark matter as an explanation of flat rotation curves. Thus, gravity becomes a ‘‘confining force’’ that has significant predictions for astrophysics and cosmology.
We have demonstrated that the RG flow running of and MSTG cosmology can lead to a description of the universe that does not require dominant, exotic dark matter. Dark energy is described by an effective time dependent cosmological constant. A detailed investigation of the MSTG cosmological scenario must be performed to establish that it can describe the large scale structure of the universe, account for galaxy formation and big bang nucleosynthesis and be consistent with the WMAP data.
The predictions for the galaxy rotation curves from MSTG and Milgrom’s MOND agree remarkably for almost all of the 101 galaxies fitted throughout the visible distance scales of the galaxies for LSBs as well as HSBs and the one elliptical galaxy NGC 3379. In particular, for the fits using photometric data and only one parameter (once and are fixed), the agreement of the two models suggests that Milgrom’s MOND critical acceleration is closely related to the range parameter and the distance scaling behavior of the MSTG modified acceleration law.
Acknowledgments
This work was supported by the Natural Sciences and Engineering Research Council of Canada. JRB would like to thank the Perimeter Institute for Theoretical Physics for additional funding. We thank Martin Green and Martin Reuter for helpful discussions. We also thank Stacy McGaugh and Marc Verheijen for supplying data and for helpful discussions; and Erwin de Blok for assisting in our deployment of the Groningen Image Processing System (GIPSY)444http://www.astro.rug.nl/~gipsy/ and the ROTMOD task on the Mac G4 platform.
References
- Avila-Reese et al. (2001) Avila-Rees, V., Colin, P., Valenzuela, O., D’Onghia, E. & Firmani, C. 2001, ApJ, 559, 516 (astro-ph/0010525)
- Bailin et al. (2005) Bailin, J., Power, C., Gibson, B. K. & Steinmetz M. 2005, MNRAS, submitted (astro-ph/0502231)
- Bekenstein (2004) Bekenstein, J. D. 2004, Phys. Rev. D70, 083509 (astro-ph/0403694)
- Begeman et al. (1991) Begeman, K. G., Broeils, A. H. & Sanders, R. H. 1991 MNRAS, 249, 523 (1991MNRAS.249..523B)
- Bennett et al. (2003) Bennett, C. L. et al. 2003, ApJS, 148, 1 (astro-ph/0302207)
- Brownstein & Moffat (2005) Brownstein, J. R. & Moffat, J. W. 2005, preprint (astro-ph/0507222)
- Colin et al. (2002) Colin, P., Avila-Rees, V., Valenzuela, O. & Firmani, C. 2002, ApJ, 581, 777 (astro-ph/0205322)
- de Blok & McGaugh (1996) de Blok, W. J. G. & McGaugh, S. S. 1996, ApJ, 469, 89 (astro-ph/9607042)
- de Blok & McGaugh (1998) de Blok, W. J. G. & McGaugh, S. S. 1998, ApJ, 508, 132 (astro-ph/9805120)
- de Blok et al. (2001a) de Blok, W. J. G., McGaugh, S. S., Bosma, A. & Rubin, V. C. 2001, ApJ, 552, L23 (astro-ph/0103102)
- de Blok et al. (2001b) de Blok, W. J. G., McGaugh, S. S. & Rubin, V. C. 2001, AJ, 122, 2396 (astro-ph/0107366)
- de Blok et al. (2003) de Blok, W. J. G., Bosma, A. & McGaugh, S. S. 2003, MNRAS, 340, 657 (astro-ph/0212102)
- Eidelman et al. (2004) Eidelman, S. et al. 2004, Phys. Lett. B592, 1
- Garnavich et al. (1998) Garnavich, P. M. et al. 1998, ApJ, 509, 74 (astro-ph/9806396)
- McGaugh et al. (2001) McGaugh, A., Rubin, V. C. & de Blok, W. J. G. 2001, AJ, 122, 2381 (astro-ph/0107326)
- Mannheim (2005) Mannheim, P. D. 2005, preprint (astro-ph/0505266)
- Mannheim (1990) Mannheim, P. D. 1990, Gen. Rel. Grav., 22, 289
- Milgrom (1983) Milgrom, M. 1983, ApJ, 270, 365
- Moffat (2005a) Moffat, J. W. 2005, J. Cosmology Astropart. Phys, 05, 003 (astro-ph/0412195)
- Moffat (2005b) Moffat, J. W. 2005, preprint (gr-qc/0506021)
- Perlmutter et al. (1997) Perlmutter, S. et al. 1997, ApJ, 483, 565 (astro-ph/9608192)
- Prada et al. (2003) Prada, F. et al. 2003, ApJ, 598, 260 (astro-ph/0301360)
- Riess et al. (1998) Riess, A. G. et al. 1998, AJ, 113, 1009 (astro-ph/9805201)
- Riess et al. (2004) Riess, A. G. et al. 2004, ApJ, 607, 665 (astro-ph/0402512)
- Reuter & Weyer (2004a) Reuter, M. & Weyer, H. 2004, J. Cosmology Astropart. Phys, 12, 001 (hep-th/0410119)
- Reuter & Weyer (2004b) Reuter, M. & Weyer, H. 2004, Phys. Rev. D69, 104022 (hep-th/0311196)
- Romanowsky et al. (2003) Romanowsky, A. J., Douglas, N. D., Arnaboldi, M., Kuijken, K, Merrifield, M. R., Napolitano, N. R., Capaccioli & M., Freeman, K. C. 2003, Science, 301, 1696 (astro-ph/0308518)
- Romanowsky et al. (2004) Romanowsky, A. J. et al. 2004, in Proc. IAU Symposium No. 220, Dark matter in Galaxies, ed. S. Ryder, D. J. Pisano, M. Walker & K. Freedman, (San Francisco: ASP) 165 (astro-ph/0310874)
- Sanders (1996) Sanders, R. H. 1996, ApJ, 473, 117 (astro-ph/9606089)
- Sanders (2005) Sanders, R. H. 2005, preprint (astro-ph/0502222)
- Sanders & McGaugh (2002) Sanders, R. H. & McGaugh, S. S. 2002, ARA&A40, 263 (astro-ph/0204521)
- Sanders & Verheijen (1998) Sanders, R. H. & Verheijen, M. A. W. 1998, ApJ, 503, 97 (astro-ph/9802240)
- Shapiro et al. (2005) Shapiro, I. L., Sola, J. & Stefancic, H. 2005, J. Cosmology Astropart. Phys, 01, 012 (hep-ph/0410095)
- Sheldon et al. (2003) Sheldon, E. S. et al. 2003, AJ, 127, 2544 (astro-ph/0312036)
- Sofue (1996) Sofue, Y. 1996, ApJ, 458, 120 (astro-ph/9507098)
- Spergel et al. (2003) Spergel, D. N. et al. 2003, ApJS, 148, 175 (astro-ph/0302209)
- Tully (1988) Tully, R. B. 1988, Nearby Galaxies Catalog (Cambridge, Cambridge University Press)
- Tully & Fisher (1977) Tully, R. B. & Fisher, J. R. 1977, A&A, 54, 661
- Verheijen (2001) Verheijen, M. A. W. 2001, ApJ, 563, 694 (astro-ph/0108225)
- Verheijen & Sancisi (2001) Verheijen, M. A. W. & Sancisi, R. 2001, A&A, 370, 765 (astro-ph/0101404)
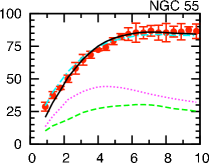
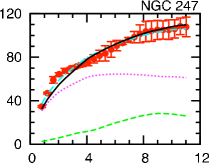
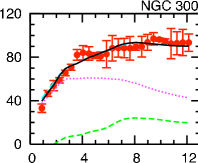
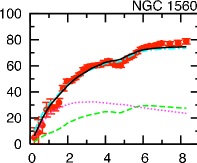
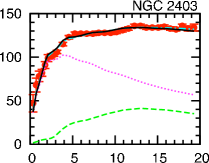
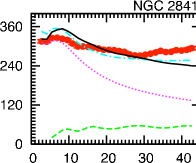
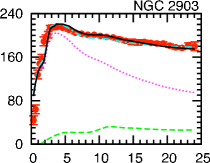
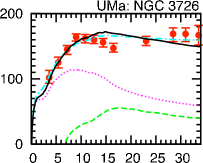
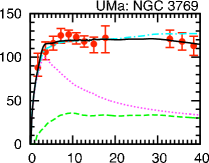
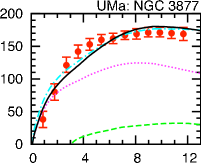
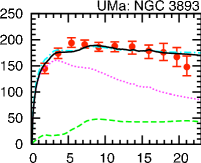
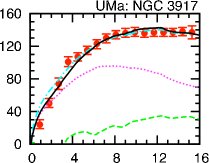
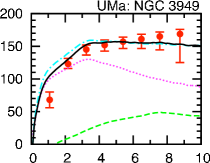
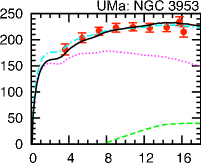
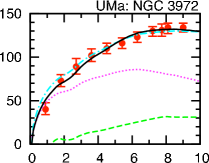
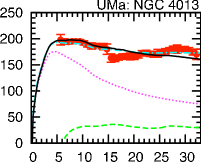
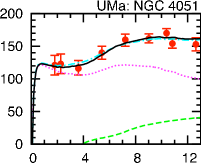
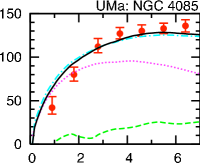
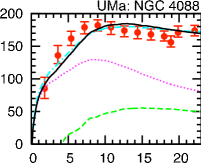
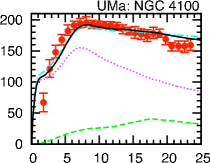
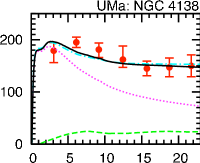
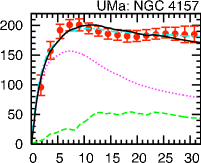
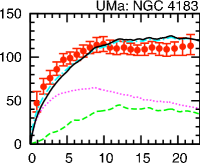
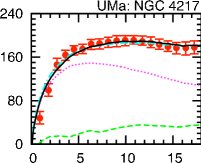
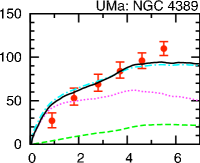
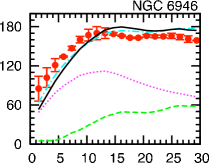
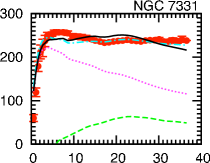
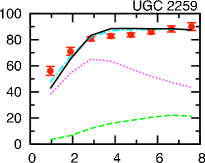
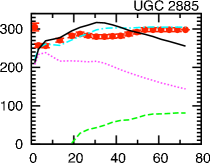
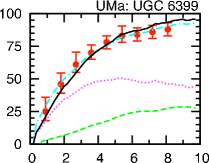
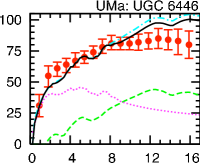
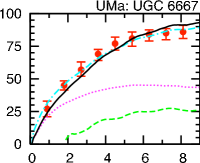
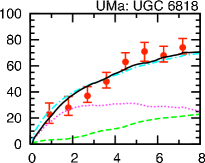
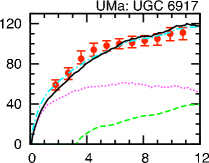
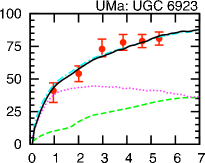
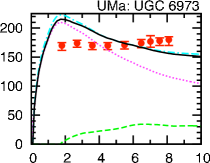
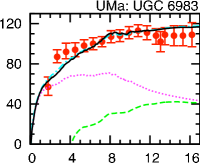
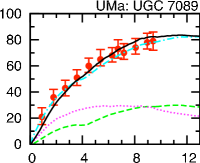
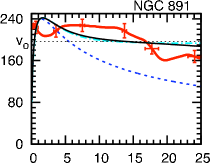
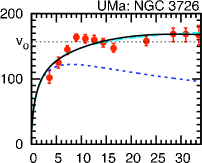
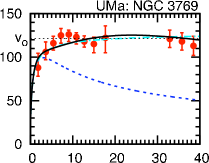
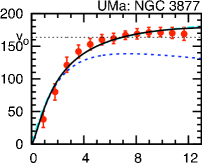
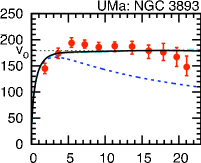
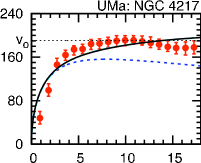
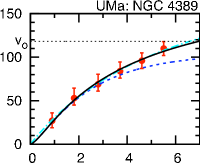
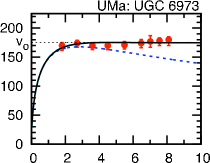
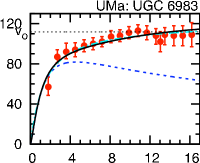
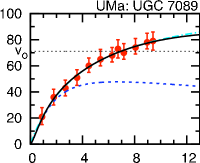
Photometric Fits to Galaxy Rotation Curves: There are 58 galaxies presented here, each is a best fit via the single parameter based on the photometric data of the gaseous (HI plus He) and luminous stellar disks. The 29 galaxies labeled UMa are members of the Ursa Major cluster of galaxies. For the UMa subset, available -band data was used to reproduce the velocity profiles of the gaseous disk (HI plus He) distribution and luminous stellar disks accounting for the revised distance estimate to UMa from 15.5 Mpc to 18.6 Mpc according to Verheijen & Sancisi (2001). The numerical results of the UMa fits are presented in Table 2. In all cases, the radial coordinate (horizontal axis) is given in kpc and the rotation velocity (vertical axis) in km/s. The red points with error bars are the observations, the solid black line is the rotation curve determined from MSTG, the dash-dot cyan line is the rotation curve determined from MOND. The other curves are the Newtonian rotation curves of the various separate components: the long dashed green line is the rotation curve of the gaseous disk (HI plus He); the dotted magenta curve is that of the luminous stellar disk.
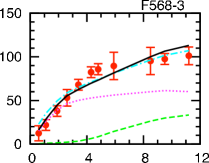
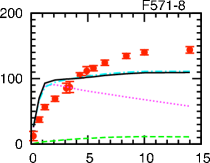
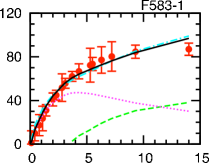
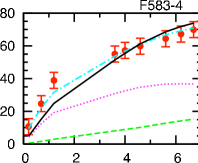
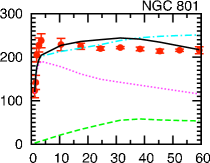
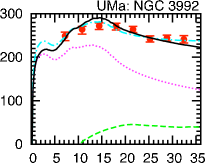
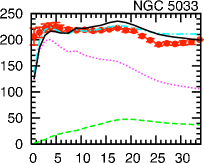
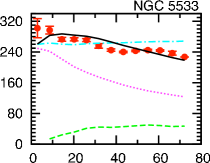
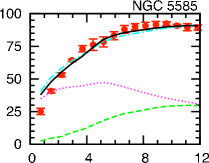
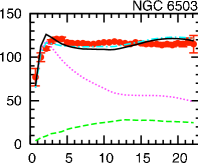
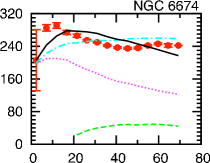
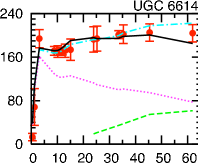
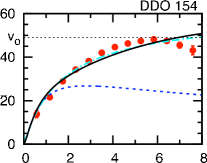
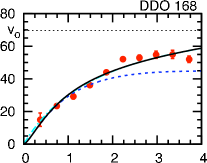
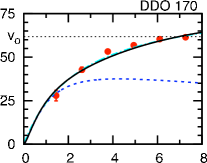
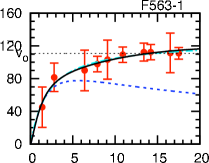
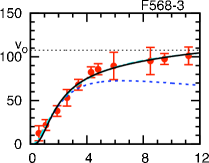
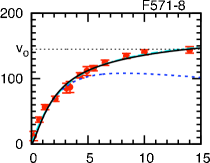
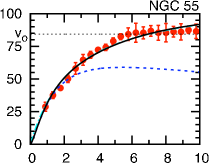
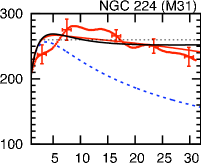
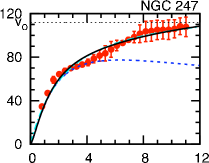
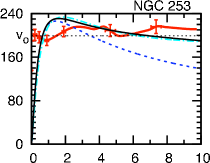
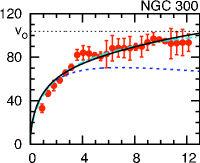
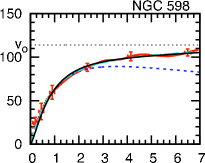
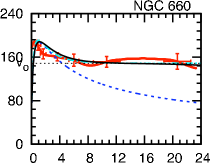
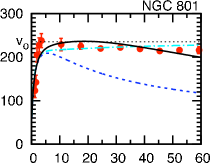
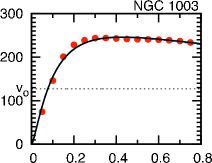
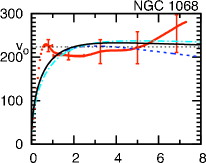
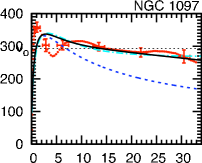
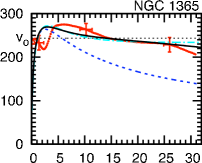
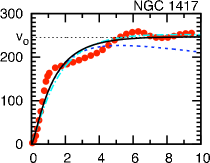
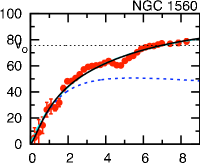
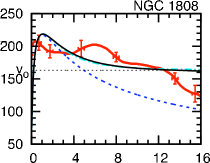
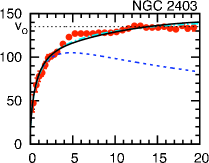
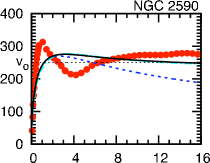
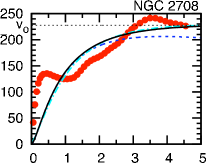
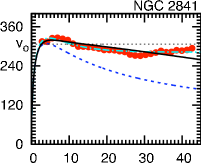
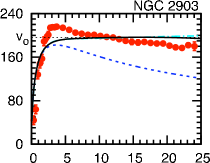
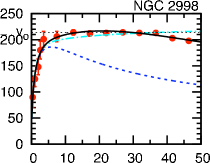
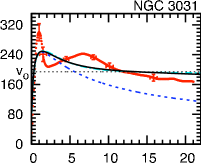
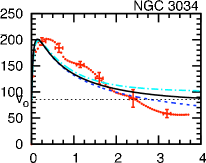
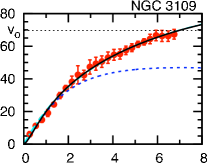
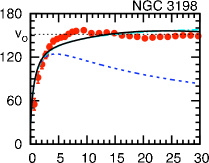
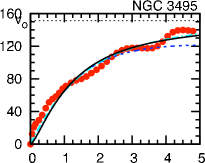
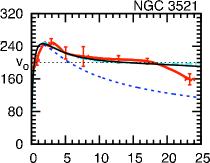
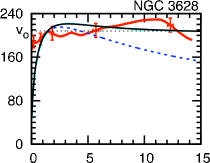
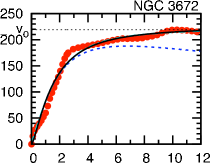
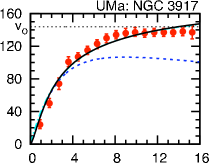
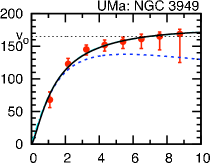
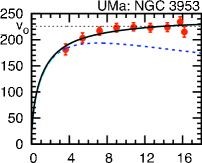
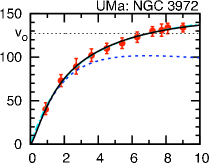
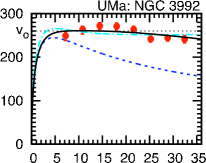
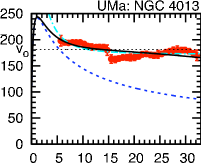
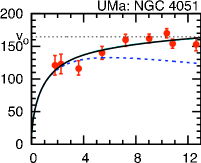
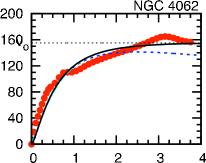
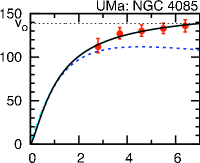
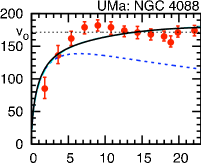
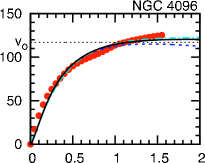
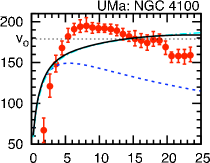
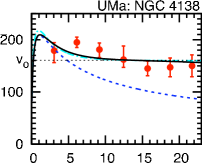
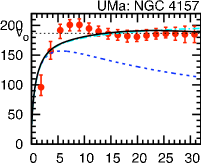
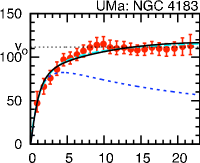
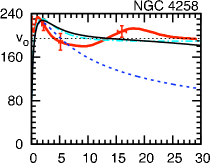
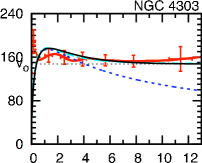
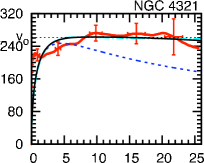
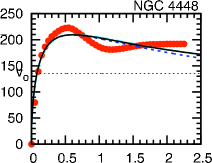
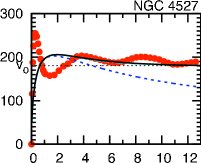
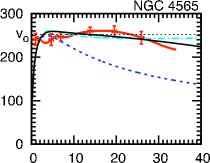
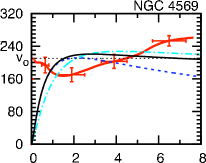
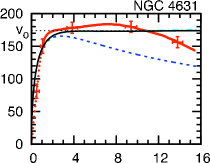
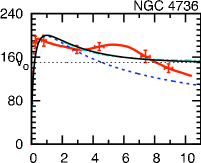
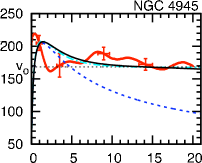
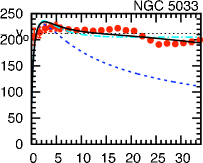
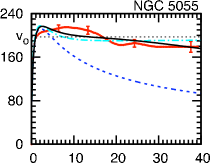
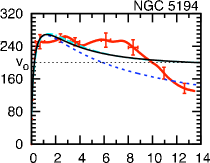
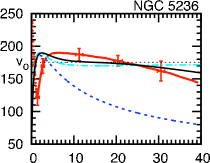
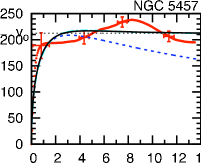
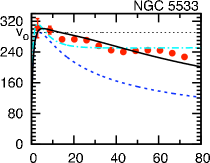
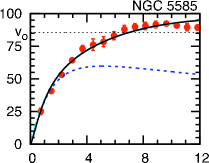
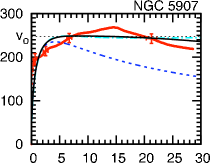
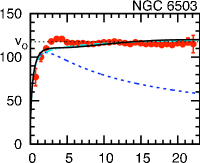
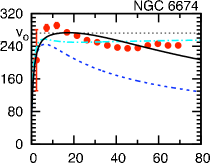
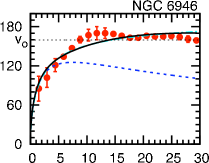
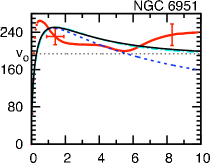
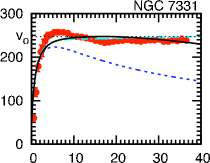
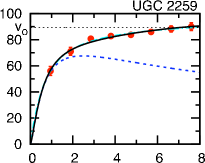
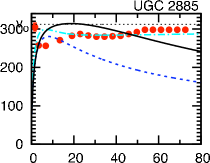
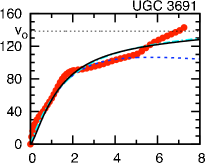
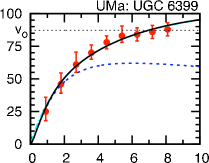
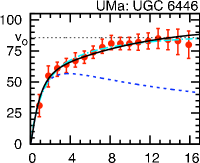
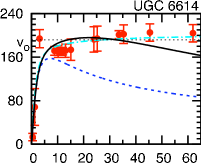
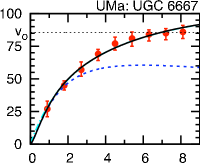
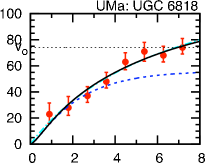
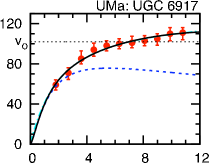
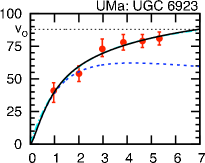
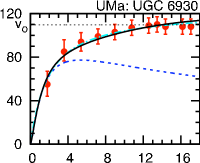
Parametric Fits to Galaxy Rotation Curves: There are 101 galaxies presented here -- the complete sample of galaxies of Table Galaxy Rotation Curves Without Non-Baryonic Dark Matter. These rotation curves are best fit to the parametric mass distribution (independent of luminosity observations) of equations (17) and (18) -- a two parameter fit to the total galactic Mass, , and a core radius, . In all cases, the red points (with error bars) are the observations. In those cases where the high resolution observations connect together, error bars if available are shown as region specific. The solid black line is the rotation curve determined from MSTG, the dash-dot cyan line is the rotation curve determined from MOND. The horizontal dotted black line is the MSTG predicted value of the measured ‘‘flat rotation velocity’’, of equation (35). The remaining curve -- the short dashed blue line is the Newtonian galaxy rotation curve. The numerical results of the fits are presented in Table 3.
|
|
|
|
|
|
|
|
|
|
|
|
|
|
|
|
|
|
|
 |
|
|
|
|
|
|
|
|
|
|
|
|
|
|
|
|
|
|
|
|
|
|
|
|
|
|
|
|
|
|
|
|
|
|
| Galaxy | Type | Surface | Distance | Redshift | Ref | ||||
|---|---|---|---|---|---|---|---|---|---|
| Brightness | ( | (kpc) | (km s-1) | (Mpc) | |||||
| (1) | (2) | (3) | (4) | (5) | (6) | (7) | (8) | (9) | (10) |
| DDO 154 | IB | LSB | 0.005 | 5.392 | 7.6 | 4.0 | 0.000103 | 1 | |
| DDO 168 | Irr | LSB | 0.022 | 3.7 | 3.8 | 0.000640 | 2 | ||
| DDO 170 | Im | 0.016 | 9.6 | 12.0 | 0.003119 | 1 | |||
| F563-1 | Sm | LSB | 0.135 | 0.100 | 17.5 | 45.0 | 3 | ||
| F568-3 | Sd | LSB | 0.331 | 0.272 | 11.2 | 77.0 | 3 | ||
| F571-8 | LSB | 0.174 | 14.0 | 48.0 | 3 | ||||
| F583-1 | Sm | LSB | 0.063 | 0.054 | 14.0 | 32.0 | 3 | ||
| F583-4 | Sc | LSB | 0.093 | 0.072 | 6.7 | 49.0 | 3 | ||
| IC 342 | Sc | HSB | 6.607 | 5.126 | 19.3 | 3.9 | 0.000103 | 4 | |
| Milky Way | Sb | HSB | 20.5 | 4 | |||||
| NGC 55 | SBm | LSB | 0.430 | 0.187 | 9.8 | 1.6 | 0.000430 | 2 | |
| NGC 224 | Sb | HSB | 1.738 | 4.443 | 31.3 | 0.7 | -0.001001 | 4 | |
| NGC 247 | SBc | LSB | 0.350 | 0.193 | 11.0 | 2.8 | 0.000520 | 2 | |
| NGC 253 | Sc | HSB | 1.585 | 4.482 | 9.7 | 2.5 | 0.000811 | 4 | |
| NGC 300 | Sc | HSB | 0.300 | 0.300 | 12.1 | 2.2 | 0.000480 | 2 | |
| NGC 598 | Sc | LSB | 0.331 | 0.330 | 6.9 | 0.8 | -0.000597 | 4 | |
| NGC 660 | Sc | HSB | 1.047 | 4.557 | 23.3 | 13.0 | 0.002835 | 4 | |
| NGC 801 | Sc | HSB | 7.400 | 23.640 | 59.0 | 80.0 | 0.019227 | 2 | |
| NGC 891 | Sb | HSB | 1.514 | 7.733 | 24.8 | 8.9 | 0.001761 | 4 | |
| NGC 1003 | Scd | LSB | 0.437 | 0.382 | 0.8 | 9.5 | 0.002088 | 4 | |
| NGC 1068 | Sb | HSB | 5.623 | 36.796 | 7.3 | 18.1 | 0.003793 | 4 | |
| NGC 1097 | SBb | HSB | 3.236 | 18.762 | 33.2 | 16.0 | 0.004240 | 4 | |
| NGC 1365 | SBb | HSB | 1.000 | 15.974 | 31.1 | 15.6 | 0.005457 | 4 | |
| NGC 1417 | Sb | LSB | 15.200 | 9.6 | 54.1 | 0.013569 | 4 | ||
| NGC 1560 | Sd | LSB | 0.035 | 0.058 | 8.3 | 3.0 | -0.000120 | 1 | |
| NGC 1808 | SBc | HSB | 1.000 | 6.559 | 16.0 | 11.4 | 0.003319 | 4 | |
| NGC 2403 | Sc | HSB | 0.790 | 0.816 | 19.3 | 3.3 | 0.000437 | 1 | |
| NGC 2590 | Sb | HSB | 17.278 | 15.8 | 64.5 | 0.016665 | 4 | ||
| NGC 2708 | Sb | HSB | 0.324 | 3.952 | 4.6 | 24.6 | 0.006698 | 4 | |
| NGC 2841 | Sb | HSB | 2.050 | 7.797 | 42.7 | 9.5 | 0.002128 | 1 | |
| NGC 2903 | Sc | HSB | 1.530 | 3.654 | 24.0 | 6.4 | 0.001855 | 1 | |
| NGC 2998 | SBc | HSB | 9.000 | 11.288 | 46.4 | 67.0 | 0.015958 | 2 | |
| NGC 3031 | Sb | HSB | 0.324 | 7.167 | 21.1 | 3.3 | -0.000113 | 4 | |
| NGC 3034 | I | HSB | 0.912 | 3.327 | 3.7 | 3.3 | 0.000677 | 4 | |
| NGC 3079 | Sc | HSB | 3.981 | 7.032 | 21.3 | 15.6 | 0.003723 | 4 | |
| NGC 3109 | SBm | LSB | 0.081 | 0.011 | 6.7 | 1.6 | 0.001344 | 1 | |
| NGC 3198 | Sc | HSB | 0.900 | 1.570 | 29.7 | 9.4 | 0.002212 | 1 | |
| NGC 3379 | E | HSB | 0.891 | 8.712 | 12.0 | 11.0 | 0.003039 | 6 | |
| NGC 3495 | Sd | LSB | 0.490 | 1.018 | 4.8 | 12.8 | 0.003789 | 4 | |
| NGC 3521 | SBb | HSB | 1.380 | 14.648 | 23.6 | 11.4 | 0.002672 | 4 | |
| NGC 3628 | Sb/I | HSB | 1.514 | 3.871 | 14.2 | 6.7 | 0.002812 | 4 | |
| NGC 3672 | Sc | LSB | 4.571 | 9.267 | 11.8 | 28.4 | 0.006211 | 4 | |
| NGC 3726 | SBc | HSB | 2.650 | 6.216 | 33.6 | 18.6 | 0.002887 | 5 | |
| NGC 3769 | SBb | HSB | 0.680 | 1.678 | 38.5 | 18.6 | 0.002459 | 5 | |
| NGC 3877 | Sc | HSB | 1.940 | 6.396 | 11.7 | 18.6 | 0.002987 | 5 | |
| NGC 3893 | Sc | HSB | 2.140 | 5.598 | 21.1 | 18.6 | 0.003226 | 5 | |
| NGC 3917 | Scd | LSB | 1.120 | 2.289 | 15.3 | 18.6 | 0.003218 | 5 | |
| NGC 3949 | Sbc | HSB | 1.650 | 2.901 | 8.8 | 18.6 | 0.002669 | 5 | |
| NGC 3953 | SBbc | HSB | 2.910 | 12.183 | 16.2 | 18.6 | 0.003510 | 5 | |
| NGC 3972 | Sbc | HSB | 0.680 | 1.124 | 9.0 | 18.6 | 0.002843 | 5 | |
| NGC 3992 | SBbc | HSB | 3.100 | 13.482 | 36.0 | 18.6 | 0.003496 | 5 | |
| NGC 4010 | SBd | LSB | 0.630 | 1.169 | 10.8 | 18.6 | 0.003008 | 5 | |
| NGC 4013 | Sb | HSB | 1.450 | 7.090 | 32.2 | 18.6 | 0.002773 | 5 | |
| NGC 4051 | SBbc | HSB | 2.580 | 6.856 | 12.6 | 18.6 | 0.002336 | 5 | |
| NGC 4062 | Sc | HSB | 0.316 | 1.131 | 3.8 | 9.7 | 0.002565 | 4 | |
| NGC 4085 | Sc | HSB | 0.810 | 1.797 | 6.4 | 18.6 | 0.002487 | 5 | |
| NGC 4088 | SBc | HSB | 2.830 | 8.176 | 22.1 | 18.6 | 0.002524 | 5 | |
| NGC 4096 | Sc | HSB | 0.891 | 2.610 | 1.6 | 12.2 | 0.001888 | 4 | |
| NGC 4100 | Sbc | HSB | 1.770 | 4.909 | 23.5 | 18.6 | 0.003584 | 5 | |
| NGC 4138 | Sa | HSB | 0.820 | 4.203 | 21.7 | 18.6 | 0.002962 | 5 | |
| NGC 4157 | Sb | HSB | 2.000 | 9.098 | 30.8 | 18.6 | 0.002583 | 5 | |
| NGC 4183 | Scd | LSB | 0.900 | 0.924 | 21.7 | 18.6 | 0.003102 | 5 | |
| NGC 4217 | Sb | HSB | 1.900 | 7.442 | 17.3 | 18.6 | 0.003426 | 5 | |
| NGC 4258 | SBc | HSB | 2.692 | 6.579 | 29.2 | 6.6 | 0.001494 | 4 | |
| NGC 4303 | Sc | HSB | 3.020 | 2.793 | 12.8 | 8.1 | 0.005224 | 4 | |
| NGC 4321 | Sc | HSB | 4.365 | 12.102 | 25.6 | 15.0 | 0.005240 | 4 | |
| NGC 4389 | SBbc | HSB | 0.610 | 1.782 | 5.5 | 18.6 | 0.002396 | 5 | |
| NGC 4448 | SBab | HSB | 0.363 | 1.634 | 2.3 | 9.7 | 0.002205 | 4 | |
| NGC 4527 | Sb | HSB | 1.202 | 18.974 | 12.8 | 22.0 | 0.005791 | 4 | |
| NGC 4565 | Sb | HSB | 2.138 | 9.099 | 34.1 | 10.2 | 0.004103 | 4 | |
| NGC 4569 | Sab | HSB | 5.012 | 3.621 | 7.6 | 8.2 | -0.000784 | 4 | |
| NGC 4631 | Sc/I | HSB | 1.738 | 1.111 | 15.4 | 4.3 | 0.002021 | 4 | |
| NGC 4736 | Sab | HSB | 0.871 | 5.460 | 10.4 | 5.1 | 0.001027 | 4 | |
| NGC 4945 | Sc/I | HSB | 2.818 | 16.740 | 20.0 | 6.7 | 0.001878 | 4 | |
| NGC 5033 | Sc | HSB | 1.900 | 5.420 | 33.8 | 11.9 | 0.002919 | 2 | |
| NGC 5055 | SBc | HSB | 1.778 | 8.467 | 39.4 | 8.0 | 0.001681 | 4 | |
| NGC 5194 | Sc | HSB | 3.090 | 13.515 | 13.5 | 9.6 | 0.001544 | 4 | |
| NGC 5236 | SBc | HSB | 2.089 | 26.057 | 39.3 | 8.9 | 0.001711 | 4 | |
| NGC 5457 | Sc | HSB | 2.344 | 7.012 | 13.5 | 7.2 | 0.000804 | 4 | |
| NGC 5533 | Sab | HSB | 5.600 | 20.604 | 72.2 | 54.0 | 0.012896 | 2 | |
| NGC 5585 | SBcd | HSB | 0.240 | 0.212 | 11.9 | 7.6 | 0.001017 | 2 | |
| NGC 5907 | Sc | HSB | 2.570 | 6.181 | 28.6 | 11.6 | 0.002225 | 4 | |
| NGC 6503 | Sc | HSB | 0.480 | 0.985 | 22.1 | 5.9 | 0.000200 | 1 | |
| NGC 6674 | SBb | HSB | 6.800 | 13.757 | 69.2 | 49.0 | 0.011438 | 2 | |
| NGC 6946 | SABcd | HSB | 5.300 | 16.792 | 29.4 | 10.1 | 0.000160 | 2 | |
| NGC 6951 | Sbc | HSB | 3.020 | 9.741 | 9.8 | 18.0 | 0.004750 | 4 | |
| NGC 7331 | Sb | HSB | 5.400 | 19.969 | 36.0 | 14.9 | 0.002722 | 1 | |
| UGC 2259 | SBcd | HSB | 0.100 | 0.008 | 7.6 | 9.8 | 0.001945 | 1 | |
| UGC 2885 | SBc | HSB | 21.000 | 35.808 | 72.0 | 79.0 | 0.019353 | 2 | |
| UGC 3691 | Scd | HSB | 1.698 | 1.573 | 7.2 | 30.0 | 0.007348 | 4 | |
| UGC 6399 | Sm | HSB | 0.200 | 8.1 | 18.6 | 0.002640 | 5 | ||
| UGC 6446 | Sd | LSB | 0.250 | 15.9 | 18.6 | 0.002149 | 5 | ||
| UGC 6614 | LSB | 7.157 | 61.9 | 85.0 | 0.021185 | 3 | |||
| UGC 6667 | Scd | LSB | 0.260 | 0.173 | 8.1 | 18.6 | 0.003246 | 5 | |
| UGC 6818 | Sd | LSB | 0.180 | 7.2 | 18.6 | 0.002696 | 5 | ||
| UGC 6917 | SBd | LSB | 0.380 | 0.260 | 10.8 | 18.6 | 0.003038 | 5 | |
| UGC 6923 | Sdm | LSB | 0.220 | 0.237 | 5.3 | 18.6 | 0.003556 | 5 | |
| UGC 6930 | Sd | LSB | 0.500 | 0.275 | 17.1 | 18.6 | 0.002592 | 5 | |
| UGC 6973 | Sab | HSB | 0.620 | 4.513 | 8.1 | 18.6 | 0.002337 | 5 | |
| UGC 6983 | SBcd | LSB | 0.340 | 0.160 | 16.2 | 18.6 | 0.003609 | 5 | |
| UGC 7089 | Sdm | LSB | 0.440 | 9.4 | 18.6 | 0.002568 | 5 |
Note. — Relevant galaxy properties of the complete sample: Column (1) is the NGC/UGC galaxy number. Column (2) is the galaxy morphological type. Column (3) is the surface brightness – denoted LSB if the galaxy central surface brightness is low () or HSB if the galaxy central surface brightness is otherwise high. Column (4) is -band luminosity data taken from the original references except for Sofue (1996) and Romanowsky et al. (2003) which are taken from Tully (1988); and Column (5) is the -band luminosity data converted from the 2MASS -band apparent magnitude via equation (38) except for the Schombert F-type galaxies, which are taken from the original reference. Column (6) is the outermost observed radial position in the rotation velocity data; and Column (7) is the observed velocity at the outermost observed radial position. Column (8) is the distance to the galaxy adopted from the original references; and Column (9) is the observed redshift taken from the NASA/IPAC Extragalactic Database. Column (10) provides the primary original references.
References. — (1) Begeman, Broeils & Sanders 1991; (2) Sanders 1996; (3) de Blok & McGaugh 1998; (4) Verheijen & Sancisi 2001; (5) Sofue 1996; (6) Romanowsky 2003.
| MSTG | MOND | |||||||
|---|---|---|---|---|---|---|---|---|
| Galaxy | ||||||||
| (kpc) | (km s-1) | (km s-1) | ||||||
| (1) | (2) | (3) | (4) | (5) | (6) | (7) | (8) | (9) |
| Dwarf (LSB & HSB) Galaxies | ||||||||
| NGC 3877 | 0.21 | 0.56 | ||||||
| NGC 3949 | 0.49 | 0.35 | ||||||
| NGC 3972 | 0.18 | 0.39 | ||||||
| NGC 4085 | 0.16 | 0.31 | ||||||
| NGC 4389 | 0.08 | 0.29 | ||||||
| UGC 6399 | 0.11 | 0.48 | ||||||
| UGC 6667 | 0.12 | 0.58 | ||||||
| UGC 6818 | 0.15 | 0.36 | ||||||
| UGC 6923 | 0.12 | 0.26 | ||||||
| UGC 7089 | 0.19 | 0.62 | ||||||
| UGC 6917 | 0.29 | 0.58 | ||||||
| LSB Galaxies | ||||||||
| NGC 3917 | 0.27 | 0.62 | ||||||
| UGC 6446 | 0.44 | 0.36 | ||||||
| UGC 6983 | 0.42 | 0.53 | ||||||
| NGC 4010 | 0.42 | 0.69 | ||||||
| NGC 4183 | 0.53 | 0.64 | ||||||
| HSB Galaxies | ||||||||
| NGC 3726 | 0.98 | 0.68 | ||||||
| NGC 3769 | 0.68 | 0.36 | ||||||
| NGC 3893 | 0.76 | 0.49 | ||||||
| NGC 3953 | 0.43 | 0.77 | ||||||
| NGC 3992 | 0.81 | 0.83 | ||||||
| NGC 4013 | 0.45 | 0.41 | ||||||
| NGC 4051 | 0.39 | 0.54 | ||||||
| NGC 4088 | 1.12 | 0.67 | ||||||
| NGC 4100 | 0.45 | 0.51 | ||||||
| NGC 4138 | 0.21 | 0.28 | ||||||
| NGC 4157 | 1.17 | 0.52 | ||||||
| NGC 4217 | 0.37 | 0.58 | ||||||
| UGC 6973 | 0.25 | 0.19 | ||||||
Note. — Best fit results of the UMa cluster of galaxies according to both MSTG and MOND via the single parameter based on the -band photometric data of the gaseous (HI plus He) and luminous stellar disks, corresponding to the fits (labeled UMa) of Fig. Galaxy Rotation Curves Without Non-Baryonic Dark Matter and Fig. 5. Column (1) is the NGC/UGC galaxy number. Column (2) is the mass of the infinitely thin gaseous disk (HI plus He). Column (3) is the -band vertical scale height of the luminous stellar disk. The MSTG best fit results are presented in Columns (4) - (6), where Column (4) is the best fit mass of the luminous stellar disk; Column (5) is the MSTG predicted total mass of the galaxy and is the sum of Column (2) and (4); and Column (6) is the predicted MSTG flat rotation velocity, , of equation (35). The MOND best results are presented in Columns (7) - (9), where Column (7) is the best fit mass of the luminous stellar disk; Column (8) is the MOND predicted mass of the galaxy and is the sum of Column (2) and (7); and Column (9) is the MOND asymptotic velocity, of equation (31).
| MSTG | MOND | |||||
|---|---|---|---|---|---|---|
| Galaxy | ||||||
| (kpc) | (km s-1) | (kpc) | (km s-1) | |||
| (1) | (2) | (3) | (4) | (5) | (6) | (7) |
| Dwarf (LSB & HSB) Galaxies | ||||||
| DDO 154aaA MOND best fit was not possible due to . The MOND fit shown for DDO 154 neglects , whereas all the data was used for the MSTG result. | ||||||
| DDO 168 | ||||||
| DDO 170 | ||||||
| F583-4 | ||||||
| NGC 55 | ||||||
| NGC 1560 | ||||||
| NGC 2708 | ||||||
| NGC 3109 | ||||||
| NGC 3877 | ||||||
| NGC 3949 | ||||||
| NGC 3972 | ||||||
| NGC 4062 | ||||||
| NGC 4085 | ||||||
| NGC 4096 | ||||||
| NGC 4389 | ||||||
| NGC 4569 | ||||||
| NGC 5585 | ||||||
| UGC 2259 | ||||||
| UGC 3691 | ||||||
| UGC 6399 | ||||||
| UGC 6446 | ||||||
| UGC 6818 | ||||||
| UGC 6917 | ||||||
| UGC 6923 | ||||||
| UGC 7089 | ||||||
| LSB Galaxies | ||||||
| F563-1 | ||||||
| F568-3 | ||||||
| F571-8 | ||||||
| F583-1 | ||||||
| NGC 247 | ||||||
| NGC 598 | ||||||
| NGC 1003 | ||||||
| NGC 1417 | ||||||
| NGC 3495 | ||||||
| NGC 3672 | ||||||
| NGC 3917 | ||||||
| NGC 4010 | ||||||
| NGC 4183 | ||||||
| UGC 6446 | ||||||
| UGC 6614 | ||||||
| UGC 6930 | ||||||
| UGC 6983 | ||||||
| HSB Galaxies | ||||||
| IC 342 | ||||||
| Milky Way | ||||||
| NGC 224 | ||||||
| NGC 253 | ||||||
| NGC 300 | ||||||
| NGC 660 | ||||||
| NGC 801 | ||||||
| NGC 891 | ||||||
| NGC 1068 | ||||||
| NGC 1097 | ||||||
| NGC 1365 | ||||||
| NGC 1808 | ||||||
| NGC 2403 | ||||||
| NGC 2590 | ||||||
| NGC 2841 | ||||||
| NGC 2903 | ||||||
| NGC 2998 | ||||||
| NGC 3031 | ||||||
| NGC 3034 | ||||||
| NGC 3079 | ||||||
| NGC 3198 | ||||||
| NGC 3379 | ||||||
| NGC 3379 | ||||||
| NGC 3521 | ||||||
| NGC 3628 | ||||||
| NGC 3726 | ||||||
| NGC 3769 | ||||||
| NGC 3893 | ||||||
| NGC 3953 | ||||||
| NGC 3992 | ||||||
| NGC 4013 | ||||||
| NGC 4051 | ||||||
| NGC 4088 | ||||||
| NGC 4100 | ||||||
| NGC 4138 | ||||||
| NGC 4157 | ||||||
| NGC 4217 | ||||||
| NGC 4258 | ||||||
| NGC 4303 | ||||||
| NGC 4321 | ||||||
| NGC 4448 | ||||||
| NGC 4527 | ||||||
| NGC 4565 | ||||||
| NGC 4631 | ||||||
| NGC 4736 | ||||||
| NGC 4945 | ||||||
| NGC 5033 | ||||||
| NGC 5055 | ||||||
| NGC 5194 | ||||||
| NGC 5236 | ||||||
| NGC 5457 | ||||||
| NGC 5533 | ||||||
| NGC 5907 | ||||||
| NGC 6503 | ||||||
| NGC 6674 | ||||||
| NGC 6946 | ||||||
| NGC 6951 | ||||||
| NGC 7331 | ||||||
| UGC 6973 | ||||||
Note. — Best fit results according to both MSTG and MOND via a parametric mass distribution (independent of luminosity observations) — corresponding to the galaxy rotation curves of Figs. Galaxy Rotation Curves Without Non-Baryonic Dark Matter–4. Column (1) is the NGC/UGC galaxy number. The MSTG best fit results are presented in Columns (2) - (4), where Column (2) is the MSTG predicted total mass of the galaxy, ; Column (3) is the MSTG predicted core radius, ; and Column (4) is the predicted MSTG flat rotation velocity, , of equation (35). The MOND best results are presented in Columns (5) - (7), where Column (5) is the MOND predicted mass of the galaxy, ; Column (6) is the MOND predicted core radius, ; and Column (7) is the MOND asymptotic velocity, of equation (31).
| -band | -band | MSTG | MOND | |
|---|---|---|---|---|
| (1) | (2) | (3) | (4) | |
| UMa Cluster of Galaxies --- Photometric Fits | ||||
| Complete Sample of Galaxies --- Parametric Fits | ||||
Note. — The -band luminosity data are taken from the original references except for Sofue (1996) and Romanowsky et al. (2003) which are taken from Tully (1988). The -band luminosity data are taken from the 2MASS except for the Schombert F-type galaxies, which are taken from the original reference. The values of and are determined using a nonlinear least-squares fitting routine including estimated errors. Columns (1) and (2) are the best fit solutions to the observed Tully-Fisher relation, in the - and -bands, respectively. Columns (3) and (4) are the best fit solutions to the actual Tully-Fisher relation, for MSTG and MOND, where v is determined by equations (41) and (42), respectively. The observed & actual Tully-Fisher relation presented here are shown graphically in Figs. 6 & 7, respectively.