Critical Examinations of QSO Redshift Periodicities and Associations with Galaxies in Sloan Digital Sky Survey Data
Abstract
We have used the publicly available data from the Sloan Digital Sky Survey and 2dF QSO Redshift Survey to test the hypothesis that QSOs are ejected from active galaxies with periodic non-cosmological redshifts. For two different intrinsic redshift models, namely the Karlsson model and Bell’s decreasing intrinsic redshift (DIR) model, we do two tests respectively. First, using different criteria, we generate four sets of QSO-galaxy pairs and find there is no evidence for a periodicity at the predicted frequency in , or at any other frequency. We then check the relationship between high redshift QSOs and nearby active galaxies, and we find the distribution of projected distance between high redshift QSOs and nearby active galaxies and the distribution of redshifts of those active galaxies are consistent with a distribution of simulated random pairs, completely different from Bell’s previous conclusion. We also analyze the periodicity in redshifts of QSOs, and no periodicity is found in high completeness samples, contrary to the DIR model. These results support that QSOs are not ejected from active galaxies.
1 Introduction
The debate on whether QSOs are ejected from the nuclei of low-redshift galaxies with a periodic non-cosmological “intrinsic” redshift has been going on for many years. Some evidence has been claimed to suggest such an intrinsic redshift hypothesis, in which QSOs have redshifts that are much larger than their parent galaxies and the excess of redshift is assumed to represent an always redshifted intrinsic component (Burbidge & Burbidge, 1967; Arp et al., 1990; Karlsson, 1990; Chu et al., 1998; Burbidge & Napier, 2001; Bell, 2004b; Arp et al., 2005).
Two models have been discussed in the literature which predict exact values for the preferred redshifts. One of these is the Karlsson formula which suggests a periodicity of with peaks lying at 0.061, 0.30, 0.60, 0.96, 1.14, 1.96 and so on (Karlsson 1977, 1990; Arp et al. 1990, 2005; Burbidge Napier 2001, 2003), where is the redshift of the QSO measured relative to the nearby galaxy, called effective redshift, which is defined as:
| (1) |
where is the observed quasar redshift and is the redshift of the associated galaxy which is assumed to be the ejecting galaxy. To explain such a periodicity, they claimed that quasars are ejected by active galaxies and the putative parent galaxies are generally much brighter than their quasar off-springs (Arp et al., 2005). As claimed by Burbidge Napier (2001, 2003), the typical projected association separation is about 200 kpc.
Another model, namely decreasing intrinsic redshift model (DIR model), was proposed by Bell (2004), where the QSO intrinsic redshift equation is given by the relation:
| (2) |
where is the intrinsic redshift constant, is an integer, and varies with and is a function of a second quantum number . In the DIR model, galaxies are produced continuously through the entire age of the universe, and QSOs are assumed to be ejected from the nuclei of active galaxies and represent the first very short lived stage ( yr) in the evolution of galaxies (Bell, 2004b).
The above an intrinsic redshift hypothesis, if true, will have far-reaching consequences for cosmology and the nature of QSOs. Most of those previous studies on the Karlsson formula used rather small samples (except for Arp et al. 2005), and have been suspected that the claimed peaks were due to artifacts associated with selection effects (Basu, 2005). To avoid such a heterogeneous selection manner as well as personal prejudice, Hawkins et al. (2002) tested the periodicity in with 2dF redshift survey data with 67291 nearby galaxies and 10410 QSOs; it was found that there is no periodicity in . However, Napier Burbidge (2003) argued that in order to use the 2dF sample to properly test the original hypothesis, it is necessary to establish for each pair that the galaxy is at least a late-type active spiral system. Arp et al. (2005) also re-examined the 2dF sample and claimed that they found that the redshifts of brighter QSOs in the QSO density contours fit very exactly the long standing Karlsson formula and confirm the existence of preferred values in the distribution of quasar redshifts.
In an attempt to resolve these issues, we turn to the Sloan Digital Sky Survey (SDSS) (and also 2dF QSO Redshift Survey (2QZ) occasionally) to carry out this study, which have the largest homogeneous sample of data as well as the spectroscopic sub-classification of galaxies. In section 2, to test whether there is a periodicity existing in , we construct four sets of QSO-galaxy pairs with different QSOs and galaxies, with all QSOs projected within 200 kpc from nearby galaxies at these galaxies’ distances. QSO density contours are also presented to show that there is no periodicity in SDSS QSOs under such analysis. In section 3, we examine the relationship between high-z QSOs and nearby active galaxies to show that such QSOs are not likely to be ejected by nearby active galaxies. In section 4, we analyze the redshift distribution of QSOs in SDSS DR3 and 2QZ to show that there is no evidence for non-artificial periodicity in redshifts of QSOs, contrary to the DIR model. Discussion and conclusion are described in Section 5.
2 No Periodicity in
2.1 The SDSS Data and Pair Selection
In this section, we use the SDSS DR1 QSO catalog (Schneider et al., 2003) and the New York University Value-Added Galaxy Catalog (NYU-VAGC) (Blanton et al., 2005). For reliability in the derived redshifts, we consider only those QSOs in the range of , and galaxies in the range of with the highest plate quality labeled as “good” and with no redshift warning. This quality control leaves a total of 190591 galaxies and 15747 QSOs in the sample.
Three issues need to be carefully addressed when we analyze the relation between foreground galaxies and QSOs, as well as the redshift distribution of QSOs, since due to the survey strategies and the instrumental limitations, the selections of galaxies and QSOs are not entirely independent, and the selection of QSOs in SDSS is also dependent on redshift. First, due to the mechanical constraint in SDSS that spectroscopic fibers must be separated by on a given plate (Blanton et al. 2003), consequently some QSO-galaxy pairs would be missing from the spectroscopic sample. However, this issue would have little effect on the results for two reasons: (1) corresponds to an angular distance of kpc for a galaxy at , which is the typical value of redshift in our galaxy sample, only few pairs (about ) would be missing in a given separation of 200 kpc for randomly distributed QSOs and galaxies, which is also shown in Fig. 7 where the distribution of data pairs are consistent with randomly distributed pairs; (2) such fiber constraint is independent of redshifts of galaxies or QSOs, therefore its redshift distribution will not be biased, although some pairs are missing in the sample. Second, the magnitude limits of the SDSS galaxy and QSO spectroscopic surveys are quite different, i.e., for QSOs, for QSOs, for most sampled galaxies and for luminous red galaxies (Richards et al. 2002; Strauss et al. 2002), hence the magnitudes of QSOs are mostly higher than galaxies. However, since in the ejection hypothesis, the parent galaxies are generally much brighter than their QSO off-springs (Bell 2004b; Arp et al. 2005), the pair making process are not likely to be affected by the magnitude differences between QSOs and galaxies, which is also shown in Fig. 12 and Fig. 13. Moreover, the fact that the completeness of the spectroscopic selection varies with redshift (Richards et al. 2002) will consequentially affect the redshift distribution of QSOs and might cause artificial periodicities into data, as will be discussed extensively in Section 4. However, since low-z () QSOs which have flat and high completeness level (; Richards et al. 2002) occupied a very large fraction of all QSOs (about ), such selection dependence in redshift would not smear out intrinsic periodicities in QSO redshift if they do exist.
It has been suggested that quasars with bright apparent magnitude will generally be nearby and the redshifts of these quasars will require little or no correction for the periodicity effects to be manifested, and those low redshift galaxies with which such quasars appear to be preferentially associated, tend to be morphologically disturbed active galaxies (Arp et al., 2005). Therefore, to make our results more compelling, we select a sub-sample of 3724 QSOs, called bright QSOs, which have i-band magnitudes less than 18.5, and a sub-sample of 77426 galaxies, called active galaxies, which are labeled as starforming, starburst, starforming broadline or starburst broadline galaxies in the spectroscopic sub-classification. Then we construct four sets of QSO-galaxy samples by intercrossing them, and get four sets of pairs in which a QSO is projected within 200 kpc from a galaxy: 4572 pairs for QSO-nearby galaxies, 3216 pairs for QSO-active nearby galaxies, 1129 pairs for bright QSO-nearby galaxies and 791 pairs for bright QSO-active nearby galaxies. When there is more than one galaxy within the 200 kpc projected distance limit of the QSO, we take the closest galaxy in projected distance to make up the pair.
2.2 Analysis and Results
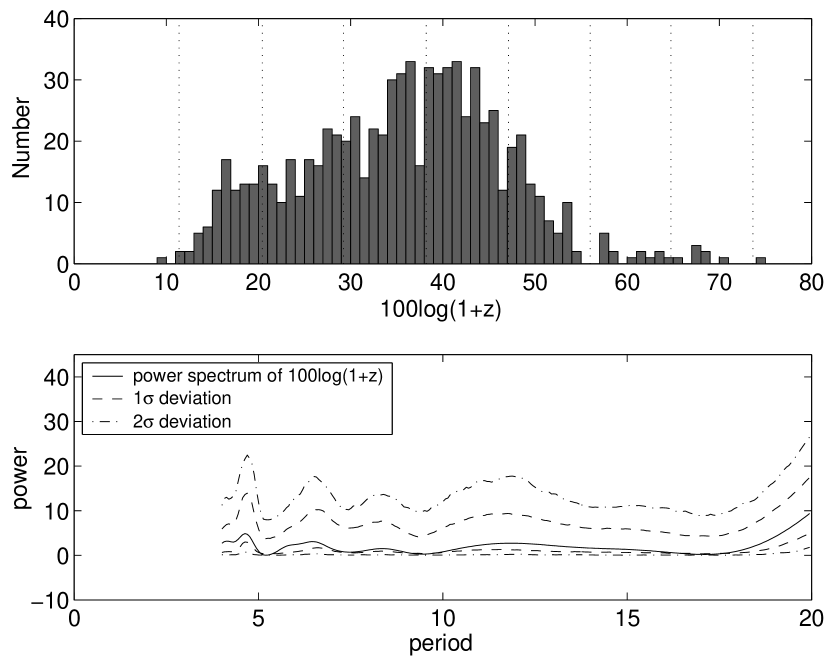
We make power spectrum analysis to investigate the periodicity hypothesis of Karlsson (1977). The power is defined as in Burbidge Napier (2001):
| (3) |
where
| (4) |
with
| (5) |
with and . Here is a weighting function, and except in section 4, as in the analysis of Burbidge Napier (2001). For randomly and uniformly distributed redshifts, .
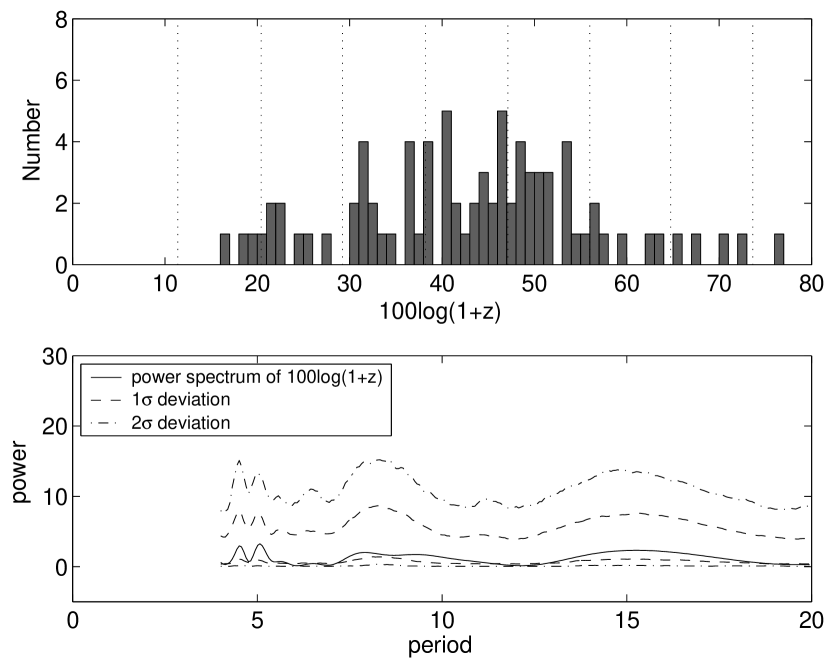
To test our code developed for this study, we first re-analyze the 290 QSOs in Karlsson and Napier Burbidge’s data sets (Karlsson, 1990; Burbidge & Napier, 2001; Napier & Burbidge, 2003), as shown in Fig. 1. Errors on are given by using the bootstrap methods (Efron, 1979) in the following steps: (1) we take the non-zero number in each bin in the upper histogram as the expectation value of a Poisson distribution; (2) we re-sample each bin following the Poisson distribution to re-produce 1000 new sets of data, repeat the power spectral analysis on these re-samplings, and finally calculate the standard deviations in the derived values of at different periods . Clearly the periodicity at around is highly significant at above 3.5 level.
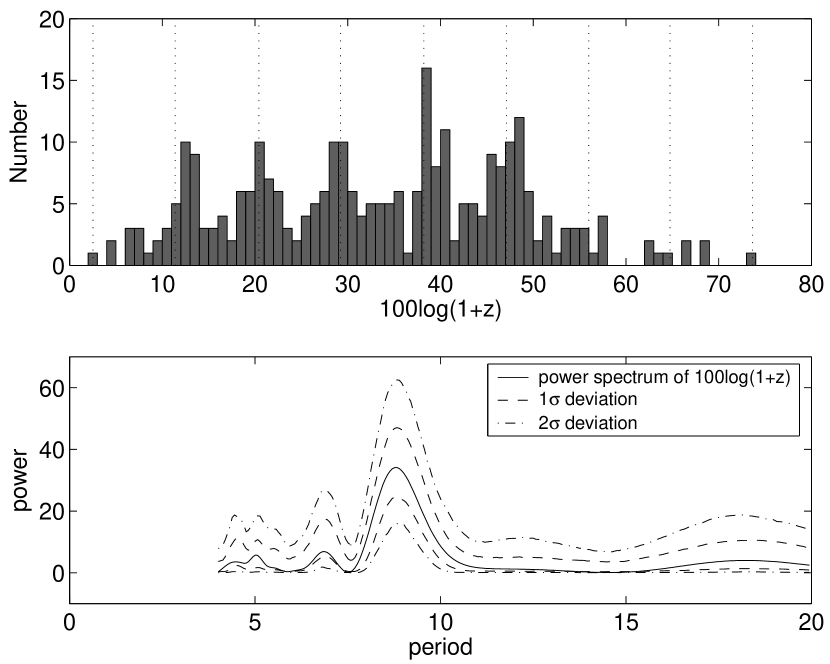
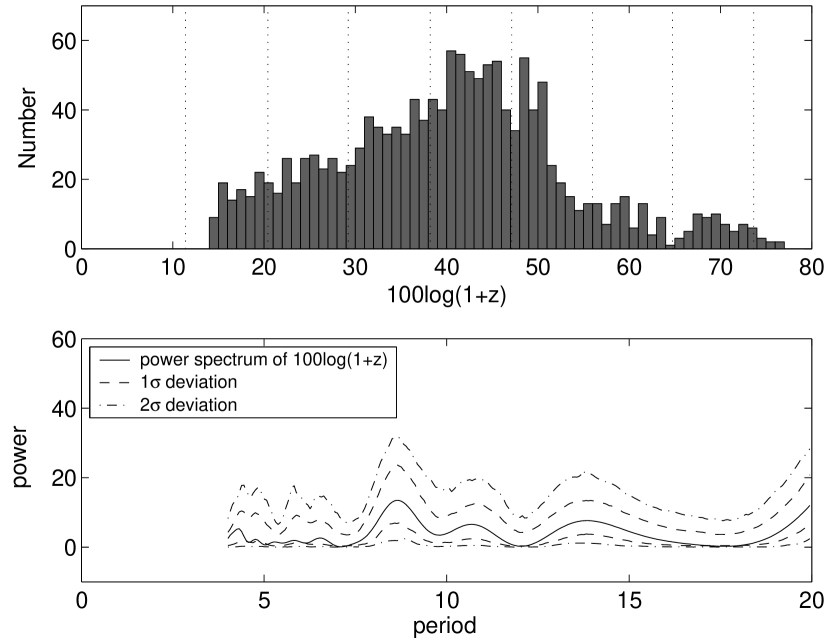
In Figs. 2-5 we show histograms of the effective redshifts of QSOs paired with galaxies and their unwindowed power spectra with standard deviations calculated in the same way as for Fig. 1. Pairs in these four figures are for QSO-nearby galaxies, QSO-active nearby galaxies, bright QSO-nearby galaxies and bright QSO-active nearby galaxies, as described in Sec. 2.1. Our results show that for these significantly larger samples than that in Fig. 1, all peaks appeared in the power spectra are consistent with Poisssonian fluctuations, i.e., there is no evidence for a periodicity at the predicted frequency in , or at any other frequency.
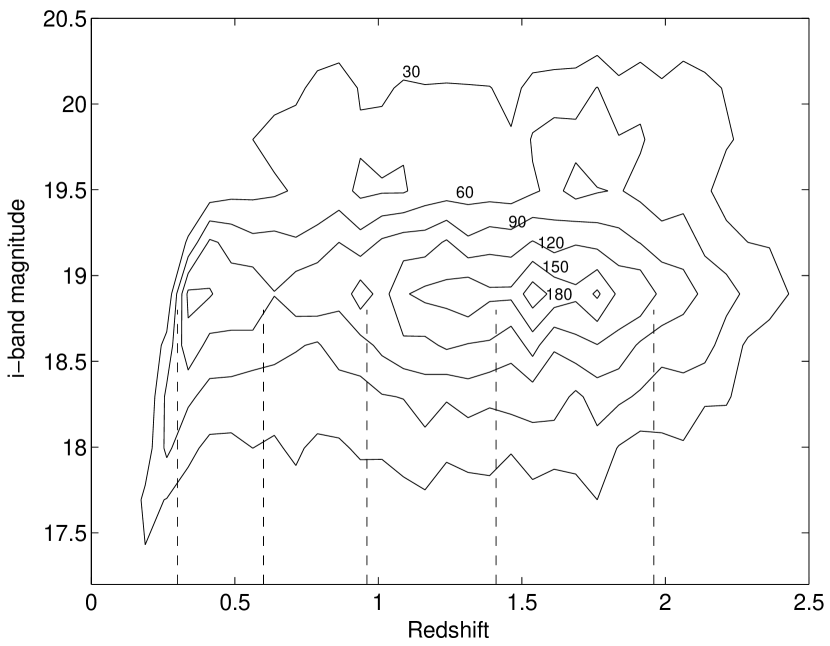
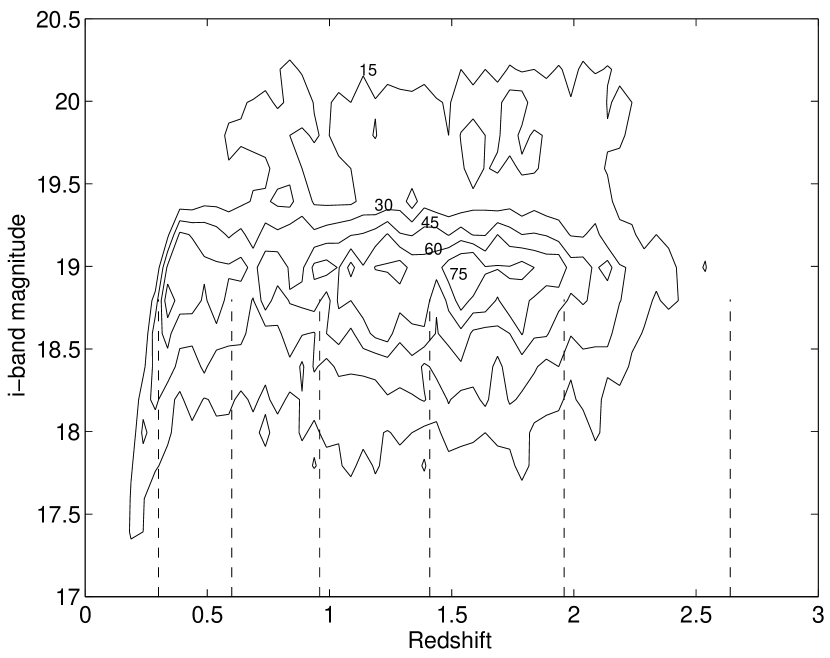
2.3 QSO Density Contours
After the work of Hawkins et al. (2002) on 2dF data, Arp et al. (2005) argued that the predicted periodic redshifts are apparent in the brighter 2dF quasars in the QSO density contours. We therefore use SDSS DR1 data to construct the contours defined by Arp et al. (2005), where the whole region is divided into boxes in the redshift/apparent magnitude plane, then the number of quasars in each box is counted. To show whether the predicted periodic redshifts are obscured by our coarse grid sizes, a contour with is also presented for comparison. As shown in Fig. 6, the peak positions are consistent in the two contour plots, and there is no evidence for redshift peaks at the predicted positions.
3 No Strong Connection between Active Galaxies and Bell’s High-z QSOs
In Bell (2004b), a high-redshift QSO sample from SDSS and a low-redshift QSO and QSO-like object sample from Hewitt Burbidge (1993) were presented. Though the dips at redshifts of 2.7 and 3.5 have been explained as being caused by the lower efficiency of the selection algorithm at these redshifts (Richards et al., 2002), Bell (2004b) nevertheless claimed that the corresponding redshift peaks at 3.1 and 3.7 in the high-z SDSS QSOs come from the intrinsic redshift broadening by Doppler ejection and Hubble flow components, which is in favor of the DIR model. Through analysis of the profiles of such peaks, Bell (2004b) derived a mean cosmological components to be for the high-z sample.
In the DIR model, galaxies are produced continuously through the entire age of the universe, and QSOs are assumed to be ejected from the nuclei of active galaxies and represent the first very short lived stage ( yr) in the evolution of galaxies. If this is true, there must be some connection between foreground active galaxies and high-z QSOs beyond gravitational lensing. Here we examine the high-redshift samples taken from the SDSS data. We test the relationship between 2691 QSOs with redshifts in 2.44.8 and 77426 nearby active galaxies with redshifts in 0.010.2 from NYU-VAGC, all of which have the highest plate quality labeled as “good” and with no redshift warning. We inter-compare these two data sets to find all QSO-galaxy pairs within an angular separation corresponding to less than a given distance from several kpc to 1 Mpc at the distance of the galaxy. In some cases, there is more than one galaxy within the projected distance limit of the QSO; for these objects we take the closest galaxy in projected distance to make up the pair. Since it is suggested that all QSOs are born out of active galaxies and QSOs should be significantly fainter than their parent galaxies (Bell 2004b), we would not miss a considerable fraction of parent active galaxies for high-z QSOs if the DIR model is right.
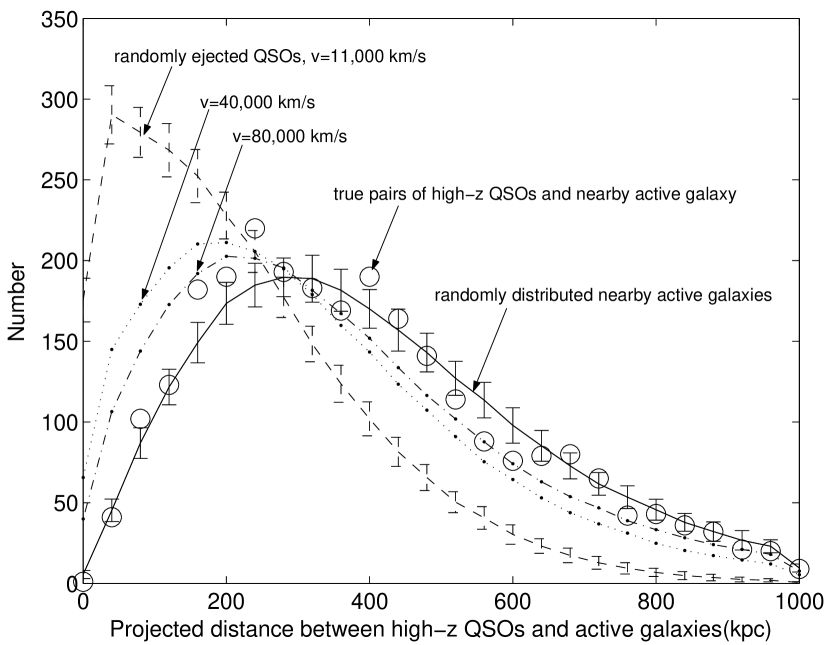
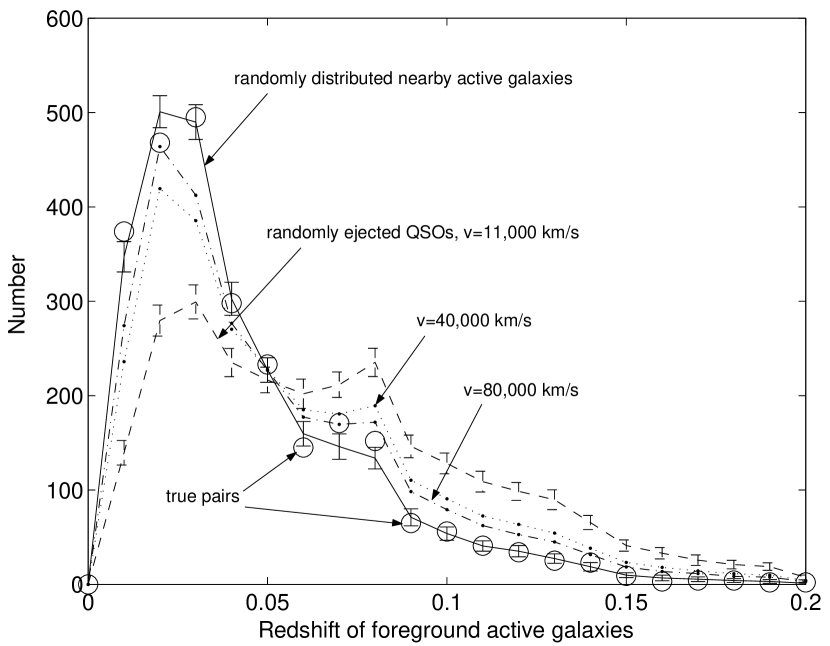
The distribution of projected separation distance for all pairs is shown in Fig. 7, and the redshift distribution of active galaxies in pairs with QSOs is shown in Fig. 8. Both of them are consistent with random distributions, but totally different from the distribution from the ejection simulation with a ejection velocity of 11,000 km s-1 which was given by Bell (2004b) as typical values, and the mean redshift of these galaxies is , also significantly different from Bell’s result of 0.066. Here the random distributions are obtained by moving the positions of all galaxies by 1 degree in random directions; thus these galaxies should be completely unrelated to background QSOs. The ejection simulation is done by ejecting all QSOs from randomly selected active galaxies with three ejection velocities: 11,000 km s-1, 40,000 km s-1 and 80,000 km s-1, and with a uniformly distributed age of yr which is given by Bell (2004b) as a typical value.
To quantitatively show the differences between simulations and ‘true’ QSO-galaxy pairs, i.e., pairs found in the data but not necessarily physical pairs, results of chi-squared tests are given in Table 1. In confidence level for both distributions of projected separation distance and redshift distribution of active galaxies in pairs with QSOs, the ‘true’ QSO-galaxy pairs are consistent with random distributions, but inconsistent with ejection hypothesis with ejection velocity up to 80,000 km s-1.
| simulations | aaColumn 2-3 are for the distribution of projected separation distance. Pairs with projected separation distance less than 60 kpc (first and second points in Fig. 7) are not used in the tests to avoid the SDSS 55” fiber constraint, and all simulations are normalized to get a minimum . The degrees of freedom are . | /N aaColumn 2-3 are for the distribution of projected separation distance. Pairs with projected separation distance less than 60 kpc (first and second points in Fig. 7) are not used in the tests to avoid the SDSS 55” fiber constraint, and all simulations are normalized to get a minimum . The degrees of freedom are . | p aaColumn 2-3 are for the distribution of projected separation distance. Pairs with projected separation distance less than 60 kpc (first and second points in Fig. 7) are not used in the tests to avoid the SDSS 55” fiber constraint, and all simulations are normalized to get a minimum . The degrees of freedom are . | bb Column 4-7 are for the redshift distribution of active galaxies in pairs with high-z QSOs. All the first zero point in Fig. 8 is not used in the tests and all simulations are normalized to get a minimum . The degrees of freedom is . | /N bb Column 4-7 are for the redshift distribution of active galaxies in pairs with high-z QSOs. All the first zero point in Fig. 8 is not used in the tests and all simulations are normalized to get a minimum . The degrees of freedom is . | p bb Column 4-7 are for the redshift distribution of active galaxies in pairs with high-z QSOs. All the first zero point in Fig. 8 is not used in the tests and all simulations are normalized to get a minimum . The degrees of freedom is . |
|---|---|---|---|---|---|---|
| randomly distributed galaxies | 38.456 | 1.6720 | 0.023 | 18.818 | 0.9904 | 0.47 |
| ejected QSOs, v=11,000 km/s | 2560.3 | 111.3174 | 994.10 | 52.3211 | ||
| ejected QSOs, v=40,000 km/s | 227.12 | 9.8748 | 265.31 | 13.9637 | ||
| ejected QSOs, v=80,000 km/s | 85.496 | 3.7172 | 144.37 | 7.5984 |
4 No Periodicity in
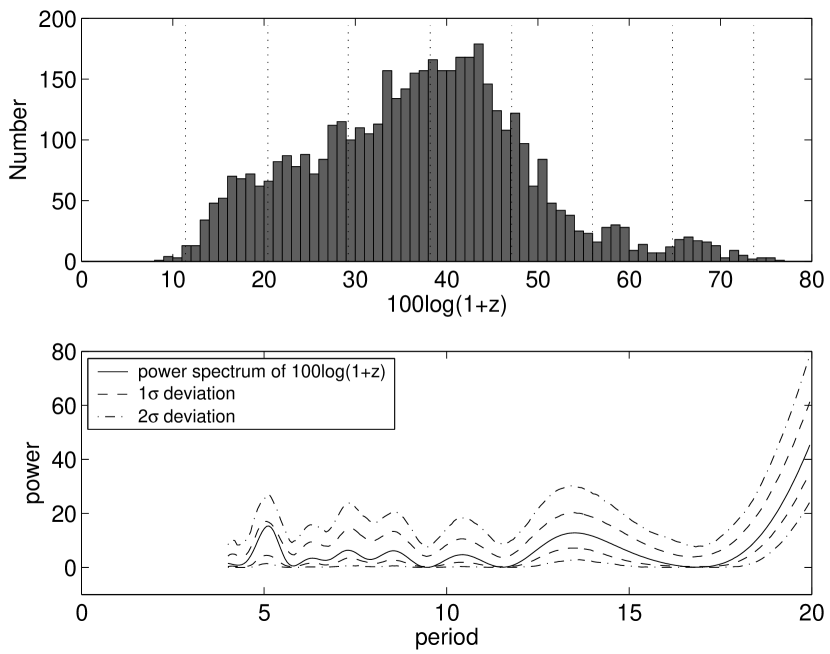
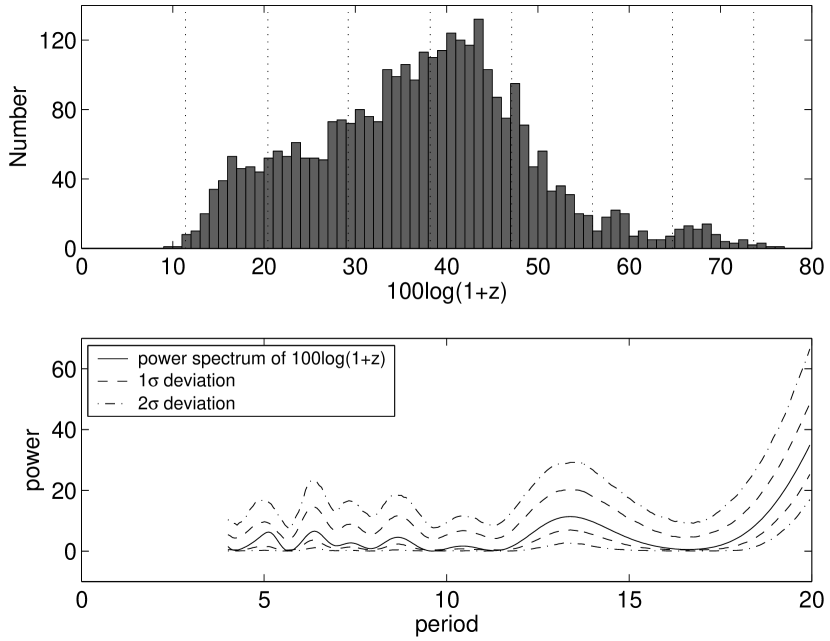
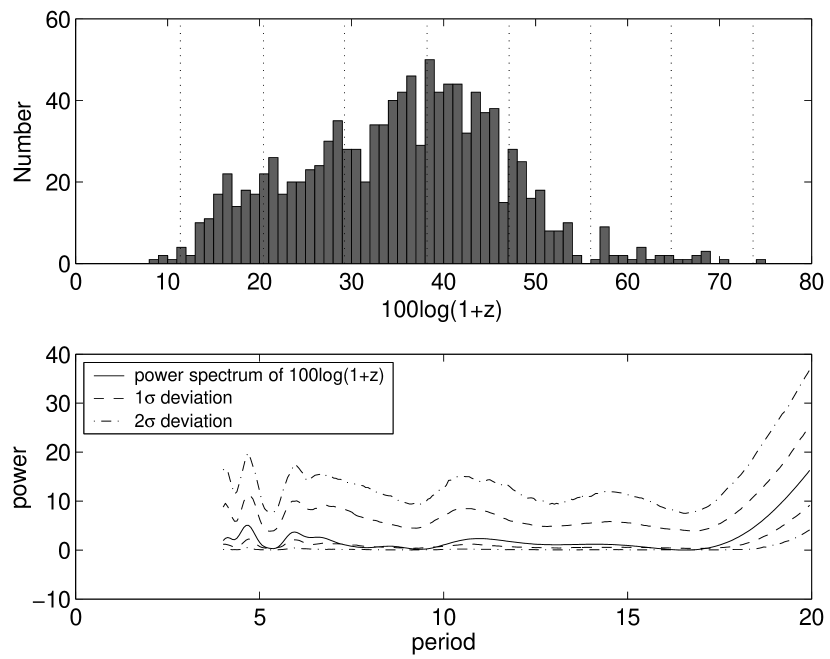
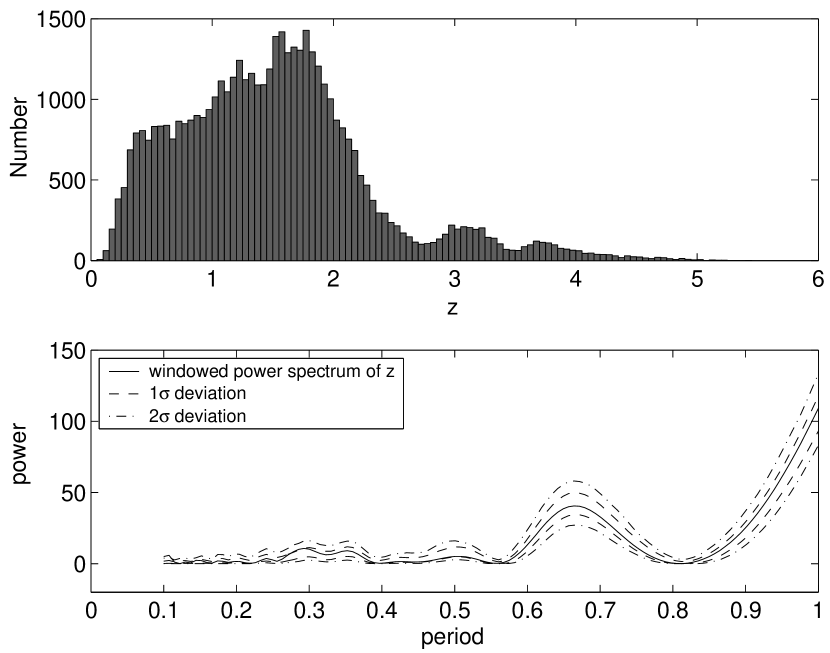
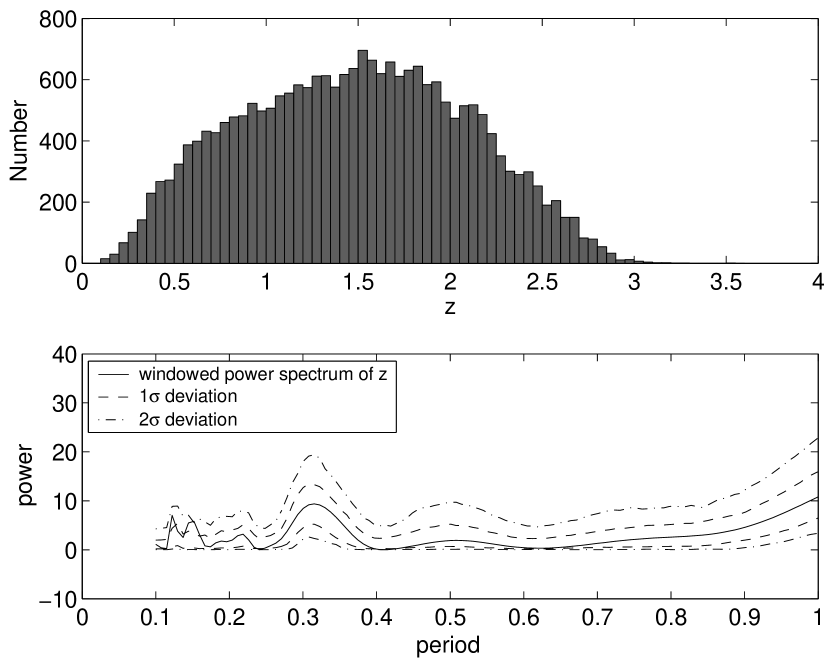
We also analyze the periodicity in redshifts of QSOs in SDSS DR3 (Schneider et al. 2005) and 2dF (Croom et al. 2004) to investigate in larger database of QSOs whether there is a periodicity of , predicted by the DIR model. Six data sets are used in this section: all 46,420 QSOs in SDSS DR3 (Fig. 9), 22,497 QSOs with the highest quality flag in 2dF (Fig. 10), a high completeness (close to ) sub-sample containing 23,109 QSOs with Galactic-extinction corrected -band magnitude () less than 19 and redshift less than 2 in SDSS DR3 (Richards et al. 2002) (Fig. 11(a)), and three sub-samples containing QSOs in low completeness (less than ) regions in SDSS DR3: 15,696 QSOs with and (Fig. 11(b)), 19,064 QSOs with in all redshifts (Fig. 11(c)), and 9,763 QSOs with (Fig. 11(d)). To reduce the edge effect produced by the truncated redshift distribution which has a lower redshifts cut-off due to the small space volume sampled and a higher redshifts cut-off due to the observational flux limit (see e.g. Hawkins et al. 2002), we follow Hawkins et al. to use the Hann function as a weighting in equation 5,
| (6) |
where is chosen to cover the range of redshifts. Here for the full SDSS sample, for the 2dF sample, and and 3.4 for the four SDSS sub-samples respectively.
After smoothing off the sharp edges in the lowest and highest redshifts, a periodicity around is detected in the full sample of SDSS QSOs, as shown in Fig. 9; however a periodicity of or any other frequency is not found in the 2dF QSOs, as shown in Fig. 10. Such a difference between these two surveys is not surprising since the redshift-dependent spectroscopic completeness is relatively flat in 2dF (Croom et al. 2004), while in SDSS the spectroscopic completeness varies drastically at some redshifts (Richards et al. 2002). It is therefore improper to use all QSO redshifts in SDSS to probe any intrinsic periodicity without addressing selection bias. To further investigate whether such a periodicity around in SDSS QSOs is spuriously produced by various incompleteness as function of redshift, we select a high-completeness sub-sample of 23,109 QSOs with and in SDSS DR3, and three sub-samples containing QSOs in low-completeness regions. As shown in Fig. 11, no periodicity is found in the high-completeness sample where the power spectrum is consistent with a continuously ascending curve due to the low frequency component of the redshift distribution, whereas in different low-completeness samples, strong periodicity always appears, but with different peak locations (0.88 in (b), 0.67 in (c) and 0.74 in (d)). This should be a strong indicator that the peaks in low-completeness samples are caused by different selection effects in different samples. In sum, there is no evidence for intrinsic periodicity in redshifts of QSOs.
5 Discussion and Conclusion
However, one might ask whether it is because we have some paired QSOs with wrong parent galaxies so that not only the effective redshifts of QSOs show no periodicity, but also high-z QSOs and nearby active galaxies show no strong connection. The wrong-pairing indeed could happen that when there is more than one galaxy within the projected distance limit of the QSO and we take the closest galaxy in projected distance to make up the pair. In the following we quantitatively examine this possibility and its effect.
For the pair making process in section 2, the is 200 kpc, which is less than the average projection distance between QSOs and galaxies, and the percentage of cases in which there are two or more galaxies within the projected distance is 27 for QSO-nearby galaxies, 19 for QSO-active nearby galaxies, 27 for bright QSO-nearby galaxies and 18 for bright QSO-active nearby galaxies, respectively. This means that for a majority of paired QSOs (), there is only one galaxy within the given projected distance and would not be paired incorrectly, hence the claimed periodicity should have been detected in our larger samples if they did exist.
For the pair making process in section 3, the largest is 1 Mpc which is larger than the average projection distance between QSOs and galaxies (400 kpc), therefore wrong-pairing may occur more frequently here. It will be even worse if the typical ejection distance is larger than the mean projection separation of QSOs and active galaxies. So would such wrong pairs result in the good agreement between ejected model and randomly generated pairs? We answer this question by making the following test. Suppose that all QSOs are ejected by randomly selected active galaxies with a given ejection velocity (11,000 km s-1, 40,000 km s-1 and 80,000 km s-1), and with a uniformly distributed age of yr which is given by Bell (2004) as typical values, we get 200 sets of false pairs. As shown in Fig. 7-8 and Table 1, the distribution of such simulated ejection QSO-galaxy pairs are totally different from random distribution. We therefore conclude that the random-like distribution of QSO-active galaxy pairs could not be produced by the ejection model.
Another question is that whether we miss periodicities of QSOs by setting a lower limit of for galaxies and no constraint in QSO-galaxy magnitude relation. Though the lower limit of , the same as in Hawkins et al. (2002), is chosen to have confidence in the derived angular distance, as well as avoid large projection effect of very nearby galaxies, we re-analyze SDSS DR1 QSOs and galaxies again with no redshift limits on galaxies and set magnitude constraint that all paired QSOs should be at least 5 or 3 magnitudes fainter than the paired galaxy. As shown in Fig. 11 and Fig. 12, similar to our results in section 2.2, there is no evidence for a periodicity at the predicted frequency in log, or at any other frequency.
In summary, using samples from SDSS and 2QZ, we demonstrate that not only there is no periodicity at the predicted frequency in and , or at any other frequency, but also there is no strong connection between foreground active galaxies and high redshift QSOs. These results are against the hypothesis that QSOs are ejected from active galaxies or have periodic intrinsic non-cosmological redshifts.
References
- Abazajian et al. (2003) Abazajian, k., et al. 2003, AJ, 126, 2081
- Arp et al. (1990) Arp, H., Bi, H. G., Chu, Y., & Zhu, X. 1990, A&A, 239, 33
- Arp et al. (2005) Arp, H., Roscoe, D., & Fulton, C. 2005, astro-ph/0501090
- Basu (2005) Basu, D. 2005, ApJ, 618, L71
- Bell & Comeau (2003) Bell, M. B. & Comeau, S. P. 2003, submitted to ApJ (astro-ph/0305060)
- Bell (2004a) Bell, M. B. 2004a, submitted to ApJ (astro-ph/0403089)
- Bell (2004b) Bell, M. B. 2004b, ApJ, 616, 738
- Blanton et al. (2003) Blanton, M. R., et al. 2003, AJ, 125, 2276
- Blanton et al. (2005) Blanton, M. R., et al. 2005, accepted by AJ (astro-ph/0410166)
- Burbidge & Burbidge (1967) Burbidge, G. R. & Burbidge, E. M. 1967, ApJ, 148, L107
- Burbidge & Napier (2001) Burbidge, G. R. & Napier, W. M. 2001, ApJ, 121, 21
- Burbidge (2003) Burbidge, G. R. 2003, ApJ, 585, 112
- Chu et al. (1998) Chu, Y., Wei, J., Hu, J., Zhu, X., & Arp, H. 1998, ApJ, 500, 596
- Croom et al. (2004) Croom, S. M., et al. 2004, MNRAS, 349, 1397
- Efron (1979) Efron, B. 1979, Ann. Stat., 7, 1
- Gaztanaga (2003) Gaztanaga, E. 2003, ApJ, 589, 82
- Hawkins et al. (2002) Hawkins, E., Maddox, S., & Merrifield, M. 2002, MNRAS, 336, L13
- Hewitt & Burbidge (1993) Hewitt, A. & Burbidge, G. 1993, ApJS, 87, 451
- Karlsson (1977) Karlsson, K. G. 1977, A&A, 58, 237
- Karlsson (1990) Karlsson, K. G. 1990, A&A, 239, 50
- Napier & Burbidge (2003) Napier, W. M. & Burbidge, G. 2003, MNRAS, 342, 601
- Richards et al. (2002) Richards, G. T., et al. 2002, AJ, 123, 2945
- Schneider et al. (2003) Schneider, D. P., et al. 2003, AJ, 126, 2579
- Schneider et al. (2005) Schneider, D. P., et al. 2005, accepted by AJ (astro-ph/0503679)
- Strauss et al. (2002) Strauss, M. A., et al. 2002, AJ, 124, 1810