On the binary nature of 1RXS J162848.1-415241
Abstract
We present spectroscopy of the optical counterpart to 1RXS J162848.1-41524, also known as the microquasar candidate MCQC J162847-4152. All the data indicate that this X-ray source is not a microquasar, and that it is a single-lined chromospherically active binary system with a likely orbital period of 4.9 days. Our analysis supports a K3IV spectral classification for the star, which is dominant at optical wavelengths. The unseen binary component is most likely a late-type (K7-M) dwarf or a white dwarf. Using the high resolution spectra we have measured the K3 star’s rotational broadening to be km s-1 and determined a lower limit to the binary mass ratio of . The high rotational broadening together with the strong Ca ii H & K/H emission and high-amplitude photometric variations indicate that the evolved star is very chromospherically active and responsible for the X-ray/radio emission.
1 INTRODUCTION
X-ray binaries are binary systems where a neutron star or a black hole accretes matter from its companion star. Of known X-ray binaries, fifteen show persistent or episodic relativistic radio jets and are called microquasars as they are reminiscent of AGN (see e.g. Paredes 2005 for an inventory and Mirabel & Rodríguez 1999, Fender 2004a for a review of their properties). Microquasars are of great interest because they may provide a unique opportunity to gain insight into the mechanisms ruling the formation and evolution of relativistic outflows coupled to accretion phenomena. In this regard, the variations observed in microquasars are perceptible on human timescales, which allows studies impossible to perform for the more plentiful (but slowly varying) extragalactic relativistic jet sources. The sample of currently known microquasars is however small, limiting any robust conclusions of how the jet formation and its properties depend on parameters such as the accretion rate, accretion geometry or the mass and spin of the compact object (see e.g. Garcia et al. 2003). In an attempt to enlarge the sample, two long-term programs have been carried out to identify microquasar candidates in the Galaxy by cross-correlating the ROSAT All-Sky Survey (RASS) Bright Source catalogue (Voges et al. 1999) with the NVSS, GB6 and/or PMN radio surveys (Condon et al. 1998, Gregory et al. 1996, Griffith et al. 1994). Both programs share similar selection criteria: positionally coincident X-ray and radio sources that are not extended and that have hard X-ray spectra typical of X-ray binaries (see Tsarevsky et al. 2002 and Paredes, Ribó & Martí 2002 for more details). Once the optical counterpart is identified, spectroscopic observations are carried out to establish the nature of the source, and further follow-up observations are initiated to confirm its candidacy.
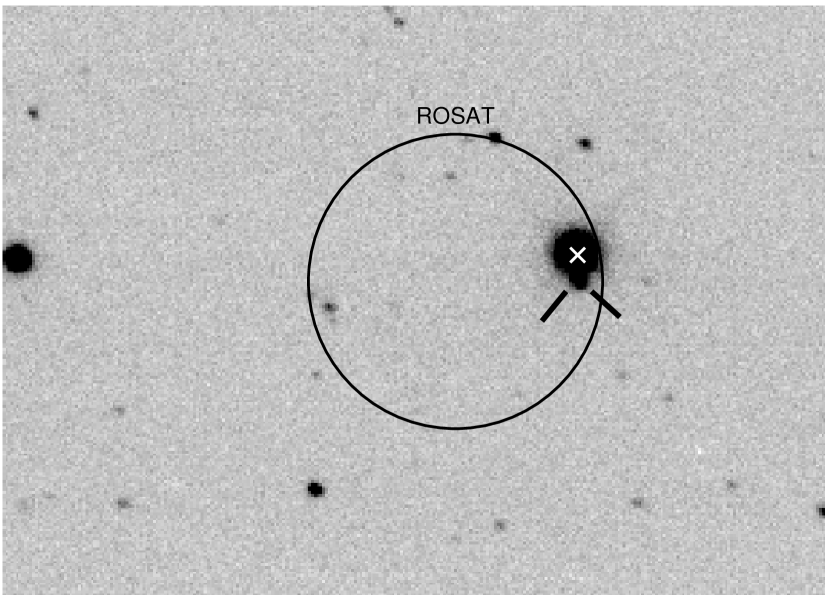
1RXS J162848.1-415241 (hereafter J1628) was detected with the Position Sensitive Proportional Counter (PSPC) during the ROSAT All-Sky Survey at a count rate of 0.119 c s-1 (0.1-2.4 keV). This X-ray source was reported to be the best microquasar candidate found during one of the surveys for new microquasars in the Galactic plane (Tsarevsky et al. 2001, 2002). Tsarevsky et al. selected this ROSAT object following the criteria outlined above, i.e: J1628 is a point-like X-ray source with an X-ray spectral hardness typical of X-ray binaries (Motch et al. 1998) and it is associated with a variable radio source (Tsarevsky et al. 2001; Rupen, Mioduszewski & Dhawan 2002, 2004; Slee et al. 2002). The optical counterpart to J1628 was identified with the apparently variable stellar-like source GSC 07861-01088 (V=13.4). Low resolution optical spectroscopy showed a K-type spectrum with a variable H emission profile (Tsarevsky et al. 2001). The photometric variability of J1628 was confirmed by Buxton et al. (2004) who observed a 0.30 mag amplitude variation in the V-band light curve. On the basis of all the gathered photometry, they found a periodicity of d (Tsarevsky; private communication). Buxton et al. interpreted the photometric variations as arising from a double-humped ellipsoidal light curve (as is typical in X-ray novae in quiescence) or from a pulsating star.
During the 2002-2004 seasons, J1628 was observed sporadically during the spectroscopic programs conducted by several CfA astronomers observing at Las Campanas Observatory (LCO). The aim of these observations was to confirm the suggested microquasar nature of J1628 by deriving its binary parameters from the analysis of the spectroscopic data accrued during these three years. The spectra obtained during 2002 showed clear radial velocity variations from night to night.
The binary nature of J1628 was confirmed one year later upon the acquisition of echelle spectra which showed highly broadened photospheric lines due to the stellar rotation: it is well-known that rapid rotation in G and K-type stars is a sign of a close binary where tidal effects have synchronized stellar rotation and orbital revolution. Of course, FK Comae stars (Bopp & Stencel 1981) and young single stars that have not yet been spun down by magnetic braking are also fast rotators; however, they do not show radial velocity variations. A pulsating nature for J1628 is ruled out because the only Population I pulsating stars with low-amplitude ( mag) light curves are Classical Cepheids with long periods; although these stars do show a K-type spectra when they reach luminosity minimum (Efremov 1975, Petit 1985), they are known to be slow rotators (Kraft 1966).
In this paper we make a detailed analysis of the optical spectroscopy of J1628, updating the preliminary results presented in Torres et al. (2004a). The paper is structured as follows: Section 2 presents the observations and the data reduction procedure. In Section 3 we estimate the orbital ephemeris and in Section 4 discuss the spectrum of the secondary star. Note that hereafter, we will call the visible star in the binary the secondary and the invisible stellar component the primary, in analogy with the terminology used in the study of binaries harboring compact objects. In Section 5 we derive an upper limit to the extinction toward J1628. Section 6 describes the emission lines observed in the spectrum. Finally, in Section 7 we discuss our results and a summary is given in Section 8.
2 OBSERVATIONS AND DATA REDUCTION
The observations of J1628 were obtained using different spectrographs mounted on the 6.5m Magellan Baade and Clay telescopes at LCO.
The Boller and Chivens (B&C) spectrograph was used to acquire low resolution spectra. A 0.7 arcsec slit width and a 600 (1200) line mm-1 grating yielded a spectral resolution of 2 pixels and a dispersion of 1.56 (0.80) Å pix-1. The spectral interval covered by the B&C was set depending on the requirements of the observer’s scientific program and can be found in Table 1.
The Inamori-Magellan Areal Camera and Spectrograph (IMACS; Bigelow & Dressler 2003) was employed in short-camera mode to obtain intermediate resolution spectra dispersed along the long-axis of two of the 8 SITe CCDs in the IMACS detector. Using a 600 line mm-1 grism and a 0.5 arcsec slit width yielded a dispersion of 0.48 Å pix-1 (CCD #2) and 0.58 Å pix-1 (CCD #5) in the spectral intervals 5670-7620 Å and 7695-10025 Å respectively. The spectral resolution was pixels FWHM.
High-resolution spectra were acquired with the Magellan Inamori Kyocera Echelle (MIKE; Bernstein et al. 2003). During May 2002, data were obtained using a 0.7 arcsec slit and the CCD detector binned by 2 in the spatial direction. In the blue, the useful wavelength range covered from 3360 to 4700 Å over 32 echelle orders. The dispersion was of 0.017-0.023 Å pix-1 and the spectral resolution pixels FWHM. In the red, the useful wavelength range covered the 4775-8500 Å interval over 31 echelle orders with a dispersion varying between 0.034 and 0.060 Å pix-1. The spectral resolution was pixels FWHM. In July 2004 a new dichroic and CCD were available. High-resolution spectra were obtained using again a 0.7 arcsec slit, but this time the CCD detector was binned by 2 both in the spatial and spectral direction. With this configuration the wavelength interval 3325-5070 Å was covered over 35 orders and the interval 4705-7260 Å over 25 orders. The 0.7 arcsec slit yielded a dispersion of 0.033-0.050 Å pix-1 and a spectral resolution of 2.7 pixels FWHM in the blue and 0.066-0.10 Å pix-1 and 2.2 pixels FWHM in the red.
Table 1 provides a detailed journal of the J1628 observations. In addition to the spectra of J1628, spectra of several radial velocity standards, flux standards and other stars were acquired during the observations.
The B&C and IMACS images were bias and flat-field corrected with standard iraf111iraf is distributed by the National Optical Astronomy Observatories. routines. The spectra were extracted from each CCD frame with the iraf kpnoslit package. The pixel-to-wavelength calibration was derived from cubic spline fits to HeNe or HeNeAr arc lines. The root-mean square deviation of the fit was Å and Å for the data acquired with the B&C and IMACS respectively. Checks for the stability of the wavelength calibration were made using the strongest atmospheric emission lines present in the spectrum. For the spectra acquired with B&C we made use of the [O i] 5577.34 Å line and estimated an accuracy in the wavelength calibration Å (600 line mm-1 grating) and Å (1200 line mm-1 grating). In the case of IMACS, we made use of the [O i] 6300.3 Å line and the OH emission blend at 7316.3 Å (Osterbrock et al. 1996). The accuracy estimated in this way was Å for the wavelength calibration of the spectra recorded in CCD #2.
The MIKE data were processed with iraf and the spectra extracted with the iraf echelle package and the aid of iraf tasks developed and kindly provided by Professor Jack Baldwin. A dispersion solution was derived from a two-dimensional fit to the ThAr comparison lamp spectra. More than 400 lines were included in the fit, and residuals were typically Å in the blue and Å in the red. No corrections for terrestrial lines were applied to the data. The atmospheric NaD emission at and the atmospheric O2 bands with wavelengths provided in Pierce & Breckinridge (1973) were used to establish an accuracy of the fit Å.
3 RADIAL VELOCITY MEASUREMENTS
The first task was to measure the radial velocities of the optical counterpart. These were measured from the spectra by the method of cross-correlation with a template star (Tonry & Davis 1979). Because no common template star was observed with all setups, we decided to use for the cross-correlation the spectrum of a template star from the Indo-US library of Coudé feed stellar spectra (Valdes et al. 2004). This library contains spectra of 1273 stars at a dispersion of Å pix-1 and 1 Å FWHM resolution. On basis of the preliminary results for the spectral class of J1628 (Torres et al. 2004a), we selected the spectrum of a K3III star (HD169191) for the cross-correlation. Prior to the cross-correlation, the B&C and IMACS spectra were resampled onto a logarithmic wavelength scale and normalized by dividing with the result of fitting a low order spline to the continuum. The archival K3III spectrum was resampled onto the same logarithmic wavelength scale as for the B&C and IMACS target spectra, broadened to match the IMACS/B&C spectral resolution using a Gaussian function with the appropriate width and normalized to the continuum. In the case of the MIKE spectra, we chose two orders covering the wavelength intervals and to measure the radial velocities. These spectral ranges contain a number of moderately strong lines and blends useful not only for the radial velocity measurements, but also for the spectral-type/luminosity classification and rotational broadening measurement (see next section). Both orders were rebinned to match the template logarithmic wavelength scale and rectified to the continuum as explained above.
Individual velocities were extracted by cross-correlation with the archival template star in the range (B&C; Oct 2002), after masking the interstellar NaD lines (B&C; 12 May 2003), (IMACS) and after masking the H emission line in the MIKE data. To obtain an estimation of the systematic errors caused by the use of the archival template we proceeded as follows: first, we obtained the radial velocities for each night (when more than one target spectrum was available) using now a template spectrum observed during the respective night. Next, we calculated for each night the radial velocity differences and compared the values (night per night) with the radial velocity differences obtained using the archival template. We found in this way rms errors of 2 km s-1 and a maximum deviation of 5 km s-1.
We performed least-squares sine fits to our radial velocity data using the photometric period Pph=4.9364 d and 2Pph as initial guesses for the orbital period. A spectroscopic period of 4.93956 0.00025 d provided the lowest value of the per degree of freedom, being 5 times lower than that obtained for 2Pph. This value is consistent with the deepest minimum at cycle d-1 observed in the -periodogram of the radial velocities. Furthermore, this period agrees with the photometric period within 1.8-. Nevertheless, the orbital period is not determined unambiguously because the spectroscopic data set is also consistent with several alias periods. In this work we adopt the following parameters of the radial velocity curve:
-
km s-1
-
km s-1
-
Psp=4.93956 0.00025 d
-
The zero phase is defined as the time of closest approach of the secondary to the observer. All quoted uncertainties are 1- and were obtained after increasing the error in the radial velocities in order to give . The phase-folded radial velocity curve is shown in Figure 1. Orbital phases of the observations, radial velocity measurements with their associated statistical errors and residuals to the circular orbit solution are given in Table 2. Adopting the values of and the orbital period, a mass function of M⊙ is obtained.
A 4.9 d orbital period rules out an ellipsoidal modulation of the optical light curve (Buxton et al. 2004) and suggests a chromospherically active binary scenario for J1628 where an evolved stellar component is covered with starspots that modulate the photospheric light with stellar rotation. The 0.30 mag modulation observed in the V-band light curve is at the high end for chromospherically active binaries: only thirteen of 206 binaries listed in Strassmeier et al. (1993) have shown a modulation in the V-band with an amplitude mag.
4 Spectral Type, Luminosity Class and Rotational Broadening
In a preliminary report based on the analysis of the first B&C and MIKE data sets (Torres et al. 2004a), the spectra of J1628 were compared visually with the spectra of K subgiants and main sequence stars acquired during the observations and also compared with the spectra of G and K-type V/IV/III stars from the Indo-Us Library of Coudé feed stellar spectra. Based on the depth of the TiO bands at , a spectral type in the range K31 was supported. A luminosity class III-IV was suggested because of the strength of the Cai line with respect to the metallic lines in the interval and by comparing the relative intensities of the multiplet 33 Tii lines and Fei .
To verify our visual classification and determine the rotational broadening of the secondary star, we made a more detailed analysis of the spectra acquired with MIKE during 2004 as they have a higher signal-to-noise in the red than the 2003 MIKE data due to the binning in the dispersion direction and the use of a new dichroic. We focused our analysis in the wavelength interval where there are several temperature and gravity sensitive lines for F, G and K stars (Strassmeier & Fekel 1990; Strassmeier & Schordan 2000). We used the technique outlined in Marsh, Robinson & Wood (1994) that is based on the search of the lowest residual obtained when subtracting a set of templates from the Doppler-corrected average spectrum of the target. The template spectra are broadened prior to subtraction to determine the rotational broadening of the lines. This technique also allows the possibility of a continuum contribution from an accretion flow when searching for the parameters of the secondary star. To implement this procedure we used a set of K-dwarf and subgiant template spectra taken with MIKE during 2004 and a set of K-giant spectra observed with MIKE in March 2003 (see Martini & Ho 2004).
We proceeded as follows: first, the target spectra were Doppler-corrected to the rest frame of the secondary star by subtracting the radial velocity obtained from the cross-correlation with the template. Next, we produced an average spectrum after assigning different weights to the individual spectra in order to maximize the signal-to-noise of the sum. The template spectra were then broadened from 37 to 47 km s-1 in steps of 0.05 km s-1 through convolution with the rotational profile of Gray (1992). We adopted a linearized limb-darkening coefficient of . Each broadened version of the template spectrum was multiplied by a factor (representing the fractional contribution of light from the secondary star) and subtracted from the target Doppler-corrected average. Then a test on the residuals was performed in the range and the optimal values of and were provided by minimizing . The results from the minimization are listed in Table 3, with quoted uncertainties corresponding to +1 (Lampton, Margon & Bowyer 1976). The minimization of in the V/IV luminosity class templates shows that the spectral type of the secondary star in J1628 is most likely not later than K3. Additionally, for a single-lined chromospherically active binary star the fractional contribution of the secondary must be . This rules out a main sequence star and constrains the spectral type to be K3IV/III. The high value as determined from the minimization using the IV/III templates together with the fact that the primary star is not detected in the nightly averaged spectra (which have signal-to-noise of about 70) suggest that the visual luminosity of the primary star and/or the accretion flow can be at most a few per cent of the flux the secondary star.
A rotational broadening measurement () of 43 km s-1 was obtained from the K3III template. To check the systematic errors introduced by the choice of the linearized limb-darkening coefficient (which is only suitable for the continuum; Collins & Truax 1995), we have allowed it to vary in the range 0.0-1.0. This leads to 7 per cent changes in the resulting value of (i.e. 3 km s-1) and . Therefore it is the uncertainty in the limb-darkening coefficient and not the statistical noise which limits our accuracy. We therefore adopt a value of km s-1, which encompasses all values obtained for the templates in Table 3. Figure 2 shows a comparison of the spectra over the range . It is clear that there is some excess absorption in the Cai lines (in particular Cai ). This could be caused by differences in the spectral luminosity or/and metallicity between template and target spectrum.
5 Interstellar Extinction Upper limit
An estimate of the upper limit to the color excess of 0.78 mag is derived from the weighted average Hi column within one degree along the line of sight to J1628 ( cm-2; Dickey & Lockman 1990) and the relation between and of Bohlin, Savage & Drake (1978). For this reddening we should expect the diffuse interstellar bands (DIBs) to have EWs of about 78 and 220 mÅ respectively (Herbig 1975). However, the EWs of the absorption features close to these wavelength positions are about 10 mÅ indicating that the extinction towards J1628 is significantly lower.
We have searched all medium (IMACS) and high-resolution spectra (MIKE) for other DIBs and atomic interstellar lines. The only interstellar features we were able to identify unambiguously in the forest of absorption lines originating in the secondary were the NaD and Ki lines blended with the namesake broader photospheric lines (see Figure 3). The profile of these interstellar lines show a single component. Taking into account that double or multiple components in the profile of the Ki line appear when its EW is Å (Munari & Zwitter 1997; MZ97), the upper limit to E(B-V) can be reduced to mag according to the relation between reddening and EW for this interstellar line (MZ97). We have measured an EW of Å for the Ki interstellar line after fitting the Ki blend with a two-Gaussian model (with one Gaussian to account for the photospheric absorption line and the other to account for the interstellar component). Using the calibration of MZ97 we derived an interstellar extinction of . For this reddening, the DIBs should be stronger than observed (Herbig 1975, see also Figure 5 in Jenniskens & Désert 1994). This discrepancy suggests that our fit is overestimating the EW for the interstellar line. Given the unreliable utility of Herbig’s calibrations for low reddening and our uncertain fit to the Ki blend, we conservatively adopt for the remaining of this paper .
6 Emission Lines in the Spectrum of J1628: Chromospheric Activity Indicators
Observational evidence of a chromosphere in the visible spectrum of active stars relies commonly on the existence of emission in the cores of the Caii H & K lines. Apart from this hallmark active stars can reveal filling-in or strong emission lines in photospheric lines like Hi Balmer lines and the Caii infrared triplet (see e.g. Linsky 1980, Thatcher & Robinson 1993 and references therein). In this regard, there is clear manifestation of stellar activity in the spectra of J1628:
The Caii H & K lines have emission cores with absorption reversal at the top of the emission that give them a double-peak shape (see Figure 4). Both Caii H & K emission profiles exhibit variations in the strength of the violet (V) and red-ward (R) peaks, the violet peak being stronger than the red-ward peak () except on 2004 Jun 9 when the red peak becomes stronger (). Single K dwarfs and giants hotter than spectral type K3 commonly show asymmetries as observed in the integrated disk of the Sun. This is often interpreted to be an indication that they have coronae and chromospheres dynamically similar to the Sun. The ratios observed in giants cooler than K4 are considered to be related to mass outflow in the chromosphere (Stencel 1978). The temporal variability of the Caii peak asymmetries is well documented for Arcturus ( Boo; K2III). Arcturus has shown transitions from to in the Ca ii K emission core ratio (Chiu et al. 1977, Gray 1980). Temporal variations of the Ca ii emission cores have been observed in other late-type stars and are described in Rebolo et al. (1989), García López et al. (1992) and references therein. In the case of binary systems, Baliunas & Dupree (1982) found that the strength of the Ca ii emission profile for the single-lined (G8III-IV) chromospherically active binary Andromedae increases (decreases) at the time of continuum light minimum (maximum) which correspond to the time when spotted (unspotted) regions dominate the stellar disk. Moreover, they found only at maximum light and at other phases and suggested an explanation of the variations in the profile asymmetry as due to differential downward and upward motions in the stellar atmosphere. Unfortunately our observations of J1628 are insufficient to corroborate the above correlation and explanation. Clearly, high-resolution spectroscopy with a better sampling of an orbital cycle and a simultaneous light curve are required.
The mean emission line width measured for the Ca ii K line in the MIKE spectra is 0.82 Å, which yields km s-1 after the quadratic correction of the instrumental broadening (18.3 km s-1). From , we estimated an absolute visual magnitude of 2.0 for the secondary of J1628 by using the Wilson-Bappu relation for chromospherically active binaries (Montes et al. 1994): , where is expressed in km s-1. However J1628 may deviate significantly from the Wilson-Bappu law due to the influence of its high rotational broadening. Montes et al. (1994) found that was overestimated for large values of , up to 2 mag when km s-1 (see figure 5 in their paper). Therefore could be for the secondary in J1628. In any case, these estimations of are in between the values for a K3 dwarf (; Gray 1992) and a K3 giant (). This result is in agreement with the expected evolved secondary for J1628.
The H line is in emission above the continuum (see Figure 4) with EW values between 0.3-1.3 Å, except on night 2003 May 6, when the EW increases to 4 Å. This may be due to intrinsic activity variations, like a flare eruption. The H profile obtained from the high resolution spectra has a FWHM km s-1 and shows a self-reversal core during some of the nights. Variable broad H emission (see e.g. Byrne et al. 1995 for an insight on the broadening mechanism) sometimes with a self-reversal core has been observed among the most extreme chromospherically active binary stars, for instance UZ Lib (K0III, Psp=4.76 d; Bopp et al. 1984), II Peg (K2IV, Psp=6.72 d; Byrne et al. 1995), EZ Peg (G5IV-III/K0V, Psp=11.6 d; Montes et al. 1998), XX Tri (K0III, Psp=24 d; Bopp et al. 1993) and HD6139 (K2IV-III, Pph=31.95 d; Padmakar et al. 2000). The EW of the observed H emission line measured in these systems is of the order of 1 Å (see the above references). For comparison, the H EWs measured in X-ray novae in quiescence are of the order of tens to hundreds of Angstroms. For instance, V404 Cyg (K0IV, Psp=6.47 d, km s-1) and Cen X-4 (K3-5V, Psp=0.63 d, km s-1) have respectively H EWs of 38 Å (Casares et al. 1993) and 35 Å (Torres et al. 2002).
7 DISCUSSION
Tidal theory (Zahn 1977) predicts that late-type stars in close binary systems rotate in synchronization with the orbital motion because tidal interactions are effective in forcing synchronization on time scales shorter than the evolutionary life time of the systems. A purely hydrodynamical mechanism based on the effects of meridional currents in the atmospheres of the stellar components and due to their non-spherical shape also explains the synchronism observed in close binary systems (Tassoul & Tassoul 1992). The estimated spectroscopic (orbital) and photometric (rotational) periods for J1628 are nearly identical implying synchronism. The small difference (if real) could be due to changes in the spot pattern over the years. Using the measured rotational broadening (section 4) and assuming that the secondary star is spherical, we can obtain a lower limit for the radius of the secondary star: . A K3V star has a radius (Gray 1992) and a K3III star has a radius of (van Belle et al. 1999). Assuming the secondary is not larger than a giant, we obtain a minimum value of the binary inclination of .
When the secondary star in a synchronous binary fills its Roche lobe, the mass ratio can be determined through the expression (see e.g. Wade & Horne 1988 and Eggleton 1983):
From the values of and found for J1628, we derive a lower limit of , which implies a velocity semi-amplitude of the primary km s-1. These are lower limits because the radius of the secondary in J1628 may be smaller than its Roche lobe and the latter increases its size with . Assuming mild mass exchange/loss during the evolution of the system (Popper & Ulrich 1972, Dupree 1986), the mass of the secondary should be in the range of masses expected for K3V to K3III stars, i.e. 0.7 to 1.1 M⊙ (Lang 1992). Hence M⊙. On this basis, the unseen primary of J1628 is probably a dwarf (if not a white dwarf) of spectral type K7 or later. A stringent lower limit for the binary inclination of is derived from the mass function () when using the upper limit for , the lower limit for and the value of . The radius of the secondary is thereby . In short, for the visible stellar component in J1628. These constraints on the radius can be used in conjunction with the constraint in the spectral type of the secondary (Section 4) to obtain its absolute visual magnitude by applying Equation 2 of Popper (1980). Using the visual absolute flux (surface brightness parameter) for a K3V/III star (Table 1 in Popper 1980) we derive in harmony with the absolute magnitudes estimated from the Wilson-Bappu relationship (Section 6). From , the apparent magnitude and the constraints to the reddening obtained in Section 5 we find 350 pc kpc for the distance to J1628.
We made use of PIMMS to convert the ROSAT PSPC count rates to an unabsorbed flux of erg cm-2 s-1 (0.1-2.4 keV) by applying an absorbed Raymond Smith model with , assuming a metal abundance of 0.2 times the solar value and cm-2 (see Yi et al. 1997 regarding the utility of using this 1-T model to obtain X-ray fluxes). Furthermore, for each possible value of and we can evaluate the distance towards J1628 using the distance modulus and (as above) the corresponding intrinsic X-ray flux. This yielded an intrinsic X-ray luminosity of erg s-1 222The range in computed is somewhat less than the square of the range in the distance error because of the complex interplay between the assumed and the derived distance. High yield high AV and lower distances (therefore lower computed ), but the X-ray absorption correction factor is higher at high which increases the computed and somewhat counteracts the distance effect., well above the averaged X-ray luminosity observed in chromospherically active binaries ( erg s-1; Padmakar et al. 2000), but consistent with the X-ray luminosities for RS CVn stars ( erg s-1). This range of X-ray luminosities for RS CVn stars was derived from observations with Einstein IPC (energy band 0.16-4 keV) and ROSAT PSPC (see Drake et al. 1989, 1992 and Dempsey et al. 1993). The differences in the X-ray flux due to the different bandpasses are expected to be (Dempsey et al. 1993; Benz & Güdel 1994).
An upper limit to the quiescent radio flux density of mJy was obtained from observations (Slee et al. 2002, Rupen et al. 2004) and can be used to check if the radio flux is consistent with that expected for a quiescent chromospherically active binary. We compared this with the quiescent radio luminosity found for chromospherically active binaries of (Padmakar et al. 2000; see also Drake, Simon & Linsky 1989 and Benz & Güdel 1994). In this way we derived 0.2 mjy for J1628. While this range is consistent with the observed upper limit, the range is due almost entirely to our uncertainty in the X-ray luminosity - the correlation between and is rather tight. If the true X-ray luminosity is at the high end of our range, then the quiescent radio flux is inconsistent (the predicted radio flux is larger than the observed upper limit). In this regard, the hard X-ray emission observed for J1628 (ROSAT hardness ratio HR1=1.00) is common for RS CVn stars undergoing an X-ray flare (see e.g. Graffagnino, Wonnacott & Schaeidt 1995). The radio counterpart to J1628 occasionally increases its flux density to mJy at 8.6 and 4.8 GHz (Tsarevsky et al. 2001; Rupen et al. 2002,2004; Slee et al. 2003). Transient radio brightenings with similar or larger amplitude to those observed in J1628 are frequent in chromospherically active binary stars (Slee et al. 1987, Drake et al. 1989).
Finally, we considered the possibility that a foreground object could be the source of the radio and X-ray emission. We searched the images obtained with IMACS during the acquisition of the spectra to find a fainter optical source nearby GSC 07861-01088, the proposed (brighter) optical counterpart (see Figure 5). We performed an analysis of optical astrometry from one of the images to check the positional coincidence of GSC 07861-01088 and its radio counterpart (Rupen et al. 2004). The agreement between the optical and radio position is well within the sub-arcsecond astrometric error and we rule out the possibility that the nearby fainter object, which is located 2 arcsec South at RA (J2000)=16:28:47.27 and DEC(J2000)=-41:52:41.0 is the radio source.
Optical spectroscopy obtained for other microquasar candidates has shown that they are mostly extragalactic in nature and, in the few stellar cases, likely chromospherically active stars/binaries (Martí et al. 2004a,b; Torres et al. 2004b, Tsarevsky et al. 2005). Hence the search for microquasars using X-ray and radio surveys has not provided so far any new and secure microquasars. This suggests that there are few microquasars with persistent bright radio/X-ray emission to be found with the RASS Bright Source catalogue. Apart from the discovery of X-ray transient microquasars (e.g. Garcia et al. 2003), the progress in understanding relativistic outflows in X-ray binaries depends largely on observations of known X-ray binaries using current and future instruments with higher sensitivity and angular resolution. Suitable targets are for instance radio emitting X-ray binaries where jets have not been resolved yet (see e.g. Mirabel & Rodríguez 1999, Fender 2004b) and X-ray transients in quiescence where radio jets are expected at a level of a few Jy (see e.g. Gallo, Fender & Pooley 2003; Gallo, Fender & Hynes 2005).
8 CONCLUSIONS
We have presented comprehensive optical spectroscopy of the microquasar candidate 1RXS J162848.1-41524. From the analysis of the absorption line spectrum, we have determined an orbital period of Psp=4.93956 0.00025 d and a radial velocity semiamplitude of the secondary of km s-1. The implied mass function is M⊙. We have established the rotational broadening of the secondary star to be km s-1. This provides an upper limit to the mass ratio of . A test applied to the residuals obtained by subtracting different template stars to the high-resolution spectra (Section 4), the limits to the absolute visual magnitude (Sections 6, 7) and the constraints to the stellar radius (Section 7) support a K3IV secondary. The emission lines observed in the spectrum of J1628 are consistent with those observed in chromospherically active binaries. This fact together with the results presented above indicates a chromospherically active binary and not a microquasar nature for J1628, where the X-ray and radio emission are powered by the stellar chromosphere and the periodic photometric variability reported by Buxton et al. (2004) would be due to cool surface spots. No trace of the primary has been found in the photospheric spectrum leading to the conclusion that it is a low luminosity object, possibly a late-type K dwarf or white dwarf. Our analysis is hampered however by the fact that our spectroscopic observations have not the required temporal coverage to determine unambiguously the orbital period of J1628. Therefore a better sampled radial velocity curve is still necessary to confirm the parameters derived in this paper for J1628. Photometric observations at different epochs will be enlightening: if J1628 is a chromospherically active binary system, it should show significant changes in the shape and amplitude of the light curve due to variations in the starspot distribution over the surface of the secondary.
ACKNOWLEDGMENTS
We thank J. Bloom, M. Holman and S. Laycock for helping during the observations. We also thank P. Martini for providing some of the MIKE templates. Use of molly, doppler and trailer routines developed largely by T. R. Marsh is acknowledged. We also thank the referee for useful comments. This research has made use of the SIMBAD database, operated at CDS, Strasbourg, France. This work was supported by NASA LTSA grant NAG-5-10889 and NASA contract NAS8-39073 to the Chandra X-ray Center. DS acknowledges a Smithsonian Astrophysical Observatory Clay Fellowship.
References
- (1) Baliunas S. L., Dupree A. K. 1982, ApJ, 252, 668
- (2) Benz A. O. & Güdel M. 1994, A&A, 285, 621
- Bernstein et al. (2003) Bernstein R., Shectman S. A, Gunnels S. M., Mochnacki S., Athey A. E. 2003, SPIE, 4841, 1694
- Bigelow & Dressler. (2003) Bigelow B. C., Dressler A. 2003, Proc. SPIE, 4841, 1727
- (5) Bohlin R. C., Savage B. D., Drake J. F. 1978, ApJ, 224, 132
- (6) Bopp B. W., Stencel R. E. 1981, ApJL, 247, 131
- (7) Bopp B. W., Goodrich B. D., Africano J. L., Noah P. V., Meredith R. J., Palmer L. H., Quigley R. J. 1984, 285, 202
- (8) Bopp B. W., Fekel F. C., Aufdenberg J. P., Dempsey R. 1993, AJ, 106, 2502
- (9) Buxton M., Bailyn C., Berdnikov L., Tsarevsky G. 2004, ATEL # 234.
- (10) Byrne et al. 1995, A&A, 299, 115
- Casares et al. (1993) Casares J., Charles P. A, Naylor T., Pavlenko E. P. 1993, MNRAS, 265, 834
- Chiu et al. (1987) Chiu H. Y., Adams P. J., Linsky J. L., Basri G. S., Maran S. P., Hobbs R. W. 1977, ApJ, 211, 453
- Collins & Truax (1995) Collins G. W. I., Truax R. J. 1995, ApJ, 439, 860
- (14) Condon J. J., Cotton W. D., Greisen E. W., Yin Q. F., Perley R. A., Taylor, G. B., Broderick J. J. 1998, AJ, 115, 1693
- (15) Dempsey R. C., Linsky J. L., Fleming T. A., Schmitt J. H. M. M. 1993, ApJS, 86, 599
- (16) Dickey J. M. Lockman F. J. 1990, ARA&A, 28, 215
- (17) Drake S. A., Simon T., Linsky J. L. 1992, ApJSS, 82, 311
- (18) Drake S. A., Simon T., Linsky J. L. 1989, ApJSS, 71, 905
- (19) Dupree A. K. 1986, ARA&A, 24, 377
- (20) Efremov Y. N, 1975, Pulsating Stars, Wiley and Sons, p. 42 R. V. Kukorkin, editor
- (21) Eggleton 1983, ApJ, 268, 368
- (22) Fender R. P. 2004a, in Compact Stellar X-Ray Sources, ed. W. H. G. Lewin & M. van der Klis (Cambridge: Cambridge University Press), in press (astro-ph/0303339)
- (23) Fender R. P. 2004b, NewAR, 48, 1399
- (24) Gallo E., Fender R. P., Pooley G. G. 2003, MNRAS, 344, 60
- (25) Gallo E., Fender R. P., Hynes R. I. 2005, MNRAS, 356, 1017
- (26) Garcia M. R., Miller J. M., McClintock J. E., King A. R., Orosz J. 2003, ApJ, 591, 388
- (27) García López R. J., Crivellari L., Beckman J. E., Rebolo R. 1992, A&A, 262, 195
- (28) Graffagnino V. G., Wonnacott D., Schaeidt S. 1995, MNRAS, 275, 129
- Gray (1992) Gray D. F. 1992, The Observation and Analysis of Stellar Photospheres. Cambridge University Press, Cambridge
- Gray (1980) Gray D. F. 1980, ApJ, 240, 125
- (31) Gregory P. C., Scott W. K., Douglas K., Condon J. J. 1996, ApJS, 103, 427
- (32) Griffith M. R., Wright A. E., Burke B. F., Ekers, R. D. 1994, ApJS, 90, 179
- (33) Herbig G. H. 1975, ApJ, 196, 129
- (34) Jasniewicz G., Parthasarathy M., de Laverny P., Thévenin F. 1999, A&A, 342, 831
- (35) Jenniskens P., Désert F.-X. 1994, A&A, 106, 39
- (36) Kraft R. P. 1966, ApJ, 144, 1008
- Lampton, Margon & Bowyer (1976) Lampton M., Margon B., Bowyer S. 1976, ApJ, 208, 177
- (38) Lang K. R. 1992, Astrophysical Data, Springer-Verlag
- (39) Linsky J. L. 1980, ARA&A, 18, 439
- Marsh, Robinson & Wood (1994) Marsh T. R., Robinson E. L., Wood J. H. 1994, MNRAS, 266, 137
- (41) Martí J., Paredes J. M., Bloom J. S., Casares J., Ribó M., Falco E. E. 2004a, A&A, 413, 309
- (42) Martí J., Paredes J. M., Garrido J. L., Luque-Escamilla P. 2004b, A&A, 423, 1073
- (43) Martini P., Ho L. C. 2004, ApJ, 610, 233
- (44) Mirabel I. F., Rodríguez L. F. 1999, ARA&A, 37, 409
- (45) Montes D., Sanz-Forcada J., Fernandez-Figueroa M. J., de Castro, E., Poncet A. 1998, A&A, 330, 155
- (46) Montes D., Fernandez-Figueroa M. J., de Castro, E., Cornide M. 1994, A&A, 285, 609
- (47) Motch et al. 1998, A&A, 132, 341
- (48) Munari U, Zwitter T. 1997, A&A, 318, 269
- (49) Osterbrock D. E., Fulbright J. P., Martel A. R., Keane M. J., Trager S. C. 1996, 108, 277
- (50) Padmakar K. P., Singh K. P., Drake S. A., Pandey S. K. 2000, MNRAS, 314, 733
- (51) Paredes J. M., Ribó M., MartíJ. 2002, A&A, 394,193
- (52) Paredes J. M. 2005, in AIP Conf. Proc. 745, High Energy Gamma-ray Astronomy, eds. F. A. Aharonian, H. J. Voelk & D. Horns., 93 (), astro-ph/0501576
- (53) Petit M. 1987, Variable Stars (New Yoir: Wiley), p. 21
- (54) Pierce A. K., Breckinridge J. B. 1973, The Kitt Peak Table of Photographic Solar Spectrum Wavelengths, Kitt Peak Contr. No. 559
- (55) Popper D. M. 1980, ARA&A, 18, 115
- (56) Popper D. M., Ulrich R. K. 1972, ApJL, 212, 131
- (57) Rebolo R., García López R., Beckman J. E., Vladilo G., Foing B. H., Crivellari L. 1989, A&ASS, 80, 135
- (58) Robinson R. D., Cram L. E. 1990, ApJ, 74, 891
- (59) Rupen M. P., Dhawan V., Mioduszewski A. J. 2004, IAU Circ. 8275
- (60) Rupen M. P., Dhawan V., Mioduszewski A. J. 2002, IAU Circ. 796
- (61) Slee O. B., Tsarevsky, G. S., Sault, R. J., Rupen, M. P., Dwahan, V.; Mioduszewski, A. J. 2002, IAU Circ. 8008
- (62) Slee O. B., Nelson G. J., Stewart R. T., Wright A. E. 1987, MNRAS, 229, 659
- (63) Stencel R. E. 1978, ApJL, 223, 37
- (64) Strassmeier K. G., Fekel F. C. 1990, A&A, 230, 389
- (65) Strassmeier K. G., Hall S. S., Fekel F. C., Scheck M. 1993, A&ASS, 100, 173
- (66) Strassmeier K. G., Schordan P. 2000, AN, 321, 277
- (67) Tassoul J.-L., Tassoul M. 1992, ApJ, 395, 259
- (68) Thatcher J. D., Robinson R. D. 1993, MNRAS, 262, 1
- Tonry & Davis (1979) Tonry J., Davis M. 1979, AJ, 84, 1511
- (70) Torres M. A. P., Casares J., Martínez-Pais I. G., Charles P. A. 2002, MNRAS, 334, 233
- (71) Torres M. A. P., Garcia M. R., Steeghs D., McClintock J. E., Bloom J. S. 2004a, ATEL# 292
- (72) Torres et al. 2004b, ATEL# 264
- Tsarevsky et al. (2001) Tsarevsky G. S., Kardashev N. S., Stathakis R. A., Slee O. B., Ojha R. 2001, ATEL 80
- Tsarevsky et al. (2002) Tsarevsky G. S., Pavlenko E. P., Stathakis R. A., Kardashev N. S., Slee O. B. 2002, in ASP Conf. Ser. 261, The Physics of Cataclysmic Variables and Related Objects, ed. B. T. Gänsicke, K. Beuermann & K. Reinsch (San Francisco: ASP), 301
- Tsarevsky et al. (2005) Tsarevsky et al. 2005, to appear in A&A (astro-ph/0502235)
- Valdes et al. (2004) Valdes F., Gupta R., Rose J. A., Singh H. P. 2004, ApJSS, 152, 251
- (77) van Belle et al. 1999, AJ, 117, 521
- (78) Voges W., et al. 1999, A&A, 349, 389
- Wade & Horne (1988) Wade R. A., Horne K. 1988, ApJ, 324, 411
- (80) Yi Z., Elgaroy O., Engvold O., Westergaard N. J. 1997, A&A, 318, 791
- (81) Zahn J.-P. 1977, A&A, 57, 383
| Date | Instrument | No. | Exp. time | range | Dispersion |
|---|---|---|---|---|---|
| (UT) | spectra | (s) | (Å) | (Å pix-1) | |
| 26-28 Oct 2002 | B&C | 11 | 300 | 3860-5500 | 0.80 |
| 6 May 2003 | B&C | 3 | 120 | 3560-6745 | 1.56 |
| 12,13 May 2003 | MIKE | 19 | 600 | 3360-4700 | 0.017-0.023 |
| 4775-8500 | 0.034-0.060 | ||||
| 13 May 2003 | B&C | 1 | 200 | 5180-6814 | 0.80 |
| 22,23,25 Jun 2003 | B&C | 26 | 60 | 4000-7190 | 1.56 |
| 17,19,20,22 Jun 2004 | IMACS | 13 | 60,120, | 5670-7620 | 0.48 |
| 7695-10025 | 0.58 | ||||
| 9-11 Jun 2004 | MIKE | 8 | 300,600 | 3325-5070 | 0.033-0.05 |
| 4705-7260 | 0.066-0.1 |
| HJD | RV | Error | O–C | |
|---|---|---|---|---|
| (+2450000.0) | (km s-1) | (km s-1) | (km s-1) | |
| 2574.4895 | 0.875 | -10.9 | 0.4 | -2.0 |
| 2574.4935 | 0.876 | -10.5 | 0.4 | -1.7 |
| 2574.4971 | 0.876 | -10.5 | 0.4 | -1.8 |
| 2574.5012 | 0.877 | -10.2 | 0.4 | -1.7 |
| 2575.4783 | 0.075 | 28.2 | 2.8 | -1.6 |
| 2575.4808 | 0.076 | 22.2 | 1.6 | -7.7 |
| 2575.4850 | 0.076 | 24.8 | 0.8 | -5.3 |
| 2575.4898 | 0.077 | 25.1 | 0.7 | -5.1 |
| 2575.4953 | 0.078 | 29.4 | 0.5 | -1.0 |
| 2575.4992 | 0.079 | 28.5 | 0.5 | -2.1 |
| 2575.5029 | 0.080 | 26.7 | 0.5 | -4.0 |
| 2771.6842 | 0.796 | -16.5 | 0.7 | 0.8 |
| 2771.6898 | 0.797 | -18.7 | 0.6 | -1.5 |
| 2771.7011 | 0.800 | -17.4 | 0.4 | -0.4 |
| 2771.7099 | 0.802 | -17.2 | 0.3 | -0.3 |
| 2771.7181 | 0.803 | -16.4 | 0.4 | 0.4 |
| 2771.7824 | 0.816 | -16.7 | 0.2 | -0.9 |
| 2771.7908 | 0.818 | -16.2 | 0.2 | -0.5 |
| 2771.8005 | 0.820 | -15.4 | 0.2 | 0.0 |
| 2771.8576 | 0.831 | -15.0 | 0.2 | -0.6 |
| 2771.8657 | 0.833 | -14.4 | 0.3 | -0.2 |
| 2771.8738 | 0.835 | -13.7 | 0.2 | 0.4 |
| 2771.8885 | 0.838 | -13.0 | 0.2 | 0.7 |
| 2771.8971 | 0.840 | -12.4 | 0.2 | 1.1 |
| 2771.9052 | 0.841 | -13.2 | 0.2 | 0.1 |
| 2771.9133 | 0.843 | -12.6 | 0.2 | 0.6 |
| 2772.7181 | 0.006 | 23.3 | 0.5 | 7.4 |
| 2772.7677 | 0.016 | 22.3 | 0.3 | 4.3 |
| 2772.7758 | 0.017 | 23.4 | 0.5 | 5.1 |
| 2772.7841 | 0.019 | 21.4 | 0.5 | 2.8 |
| 3173.7346 | 0.190 | 43.4 | 0.6 | -2.2 |
| 3173.7378 | 0.191 | 43.9 | 1.0 | -1.8 |
| 3173.7408 | 0.192 | 43.7 | 0.8 | -2.0 |
| 3173.7430 | 0.192 | 43.0 | 0.8 | -2.8 |
| 3175.5575 | 0.559 | 0.4 | 0.6 | -2.1 |
| 3175.5593 | 0.560 | 0.5 | 0.5 | -2.0 |
| 3175.5611 | 0.560 | 0.6 | 0.6 | -1.8 |
| 3175.5629 | 0.560 | -2.3 | 0.5 | -4.6 |
| 3175.5646 | 0.561 | -0.2 | 0.6 | -2.5 |
| 3176.5215 | 0.754 | -13.2 | 0.3 | 5.5 |
| 3178.5249 | 0.160 | 46.1 | 0.4 | 3.3 |
| 3178.5281 | 0.161 | 45.9 | 0.4 | 3.1 |
| 3178.5313 | 0.161 | 46.3 | 0.4 | 3.4 |
| 3195.4598 | 0.588 | -2.1 | 0.4 | 0.9 |
| 3195.4662 | 0.590 | -2.5 | 0.2 | 0.6 |
| 3196.6135 | 0.822 | -15.3 | 0.3 | 0.0 |
| 3196.6211 | 0.824 | -13.5 | 0.3 | 1.6 |
| 3196.6286 | 0.825 | -15.2 | 0.3 | -0.2 |
| 3197.4637 | 0.994 | 11.5 | 0.3 | -2.0 |
| 3197.4713 | 0.996 | 11.2 | 0.3 | -2.6 |
| 3197.4789 | 0.997 | 12.2 | 0.2 | -1.9 |
| Template | Spectral | |||
|---|---|---|---|---|
| Type | (km s-1) | (d.o.f.=1645) | ||
| HD88284 | K0 III | 42.5 0.2 | 2.58 | 1.14 0.01 |
| HD95272 | K1 III | 43.0 0.2 | 2.64 | 1.14 0.01 |
| HD43827 | K3 IIIa | 42.8 0.2 | 2.46 | 1.01 0.01 |
| HD217880 | G8 IV | 42.7 0.3 | 3.29 | 1.50 0.02 |
| HD215784 | K1 IV | 42.9 0.2 | 2.41 | 1.10 0.01 |
| HD163197 | K4 IV | 43.4 0.3 | 3.51 | 0.91 0.01 |
| HD223282 | K0 V | 43.2 0.3 | 3.78 | 1.71 0.02 |
| HD223121 | K1 V | 42.4 0.2 | 2.83 | 1.18 0.01 |
| HD218279 | K2 V | 42.5 0.2 | 2.64 | 1.18 0.01 |
| HD217580 | K4 V | 42.1 0.2 | 2.72 | 1.15 0.01 |
| HD130992 | K5 Va | 42.4 0.3 | 3.28 | 1.10 0.01 |
| a Spectral types adopted from Jasniewick et al. (1999) and Robinson & Cram (1990). |