Hot Stars in Old Stellar Populations: A Continuing Need for Intermediate Ages††thanks: The data presented herein were obtained at the W.M. Keck Observatory, which is operated as a scientific partnership among the California Institute of Technology, the University of California and the National Aeronautics and Space Administration. The Observatory was made possible by the generous financial support of the W.M. Keck Foundation.
Abstract
We investigate the effect of a small contamination of hot, old, metal-poor starlight on the inferred stellar populations of early-type galaxies in the core of the Coma Cluster. We find that the required correction to the Balmer and metal absorption-line strengths for old, metal-poor stars does not significantly affect the inferred age of the stellar population when the strength is large. Intermediate-aged populations are therefore still needed to explain enhanced Balmer-line strengths in early-type galaxies. This gives us increased confidence in our age estimates for these objects. For galaxies with weak Balmer-line strengths corresponding to very old populations ( Gyr), however, a correction for hot stars may indeed alter the inferred age, as previously suggested. Finally, the inferred metallicity will always be higher after any correction for old, metal-poor starlight than without, but the enhancement ratios will strengthen only slightly.
keywords:
galaxies: stellar content — galaxies: ellipticals and lenticulars — galaxies: clusters: individual (Coma)1 Introduction
Stellar population analysis offers a powerful, if difficult to interpret, method of understanding the formation histories of nearby early-type galaxies (see Rose, 1985; González, 1993; Trager et al., 2000b; Caldwell, Rose & Concannon, 2003; Mehlert et al., 2003, for just a few examples). This analysis relies primarily on the comparison of a hydrogen Balmer absorption-line strength to a metal absorption-line strength (or a combination of metal lines) to break the age–metallicity degeneracy (Worthey, 1994), as the Balmer lines are (non-linearly) sensitive to the temperature of the main-sequence turnoff and the metal lines are sensitive to the temperature of the red giant branch. One can therefore determine accurate ages for the old stellar populations found in early-type galaxies. However, other hot star populations such as blue horizontal branch stars or blue straggler stars can significantly increase the observed Balmer-line strengths of old stellar populations (see, e.g., Burstein et al., 1984; Rose, 1985; Rose & Tripicco, 1986; Rose, 1994; de Freitas Pacheco & Barbuy, 1995; Maraston & Thomas, 2000; Lee, Yoon & Lee, 2000; Trager et al., 2000a).
In this paper we explore the effect of a specific kind of hot star population, that is, old, metal-poor populations containing blue horizontal branch stars, on the inferred stellar population ages and compositions of early-type galaxies in the Coma Cluster. These galaxies appear have significant intermediate-aged populations due to their enhanced Balmer lines. We use blue indexes first described by Rose (1985, 1994) to determine the level of contamination of the galaxy spectra by blue horizontal branch (BHB) stars. We then subtract model spectra representing populations containing these stars from the observed spectra and determine ages, metallicities, and enhancement ratios from the residual spectra. Finally these stellar population parameters are compared with those determined from the observed spectra to quantify the effect of a contaminating population of old, metal-poor stars on the spectra of early-type galaxies.
Throughout this paper, we refer to populations with metallicities as ‘metal-poor’ (and thus possessing BHB stars) and populations with ages Gyr as ‘intermediate aged’.
2 Data
The line strengths discussed in this paper are derived from multi-slit spectra of twelve early-type galaxies in the Coma Cluster, centred on the cD galaxy NGC 4874, taken with the Low-Resolution Imaging Spectrograph (LRIS: Oke et al., 1995) on the Keck II 10-m Telescope. Details relevant to the current study are summarised here; for a complete description of the acquisition, reduction, and calibration of these spectra and the extraction of Lick/IDS absorption-line strengths we refer interested readers to Trager, Faber & Dressler (in preparation; hereafter TFD05).
2.1 Observations
Spectra were obtained in three consecutive 30-minute exposures on 7 April 1997 UT with the red side of LRIS, with seeing arcsec, through clouds. A slit width of 1 arcsec was used in conjunction with the 600 line grating blazed at 5000 Å, giving a resolution of 4.4 Å FWHM ( Å) and a wavelength coverage of typically 3500–6000 Å, depending on slit placement. Spectra of Lick/IDS standard G and K giant stars and F9–G0 dwarfs (Worthey et al., 1994) were observed on the same and subsequent nights through the LRIS 1 arcsec long slit using the same grating to be used for calibration to the Lick/IDS system (see Sec. 2.3 below).
Individual two-dimensional spectra of each galaxy were extracted from the multi-slit images after standard calibrations (overscan correction, bias removal, dark correction, and flat field correction), mapping of the geometric distortions, wavelength calibration, and sky subtraction111For NGC 4874, which filled its slitlet, and for D128 and NGC 4872, whose spectra were contaminated by that of NGC 4874, sky subtraction was performed first using the ‘sky’ information at the edge of their slitlets and then corrected by comparing this sky spectrum to the average sky from all other slitlets. The excesses in these slits were added back into the final extracted spectra. were performed following the methodology of Kelson (2003). Both individual one-dimensional spectra and variance-weighted, combined spectra were then extracted from the two-dimensional spectra. In order to simulate an equivalent circular aperture to match with other line strength work in the Coma Cluster, the extracted spectra were weighted by distance from the object centre. For the present study the spectra were extracted with an equivalent circular diameter aperture of 2.7 arcsec, matching the Lick/IDS galaxy aperture (Trager et al., 1998) and the fibre diameter of the large sample of line strengths of Coma galaxies of Moore et al. (2002). Finally, the spectra were flux-calibrated using observations of spectrophotometric standard stars.
2.2 Line strengths on the Rose system
| Ca ii | Hn/Fe | Fe5270 | Fe5335 | [O iii] | |||
|---|---|---|---|---|---|---|---|
| Name | |||||||
| D127 | 1.165 | 1.016 | 1.878 | 3.963 | 3.094 | 2.761 | 0.096 |
| 0.014 | 0.005 | 0.067 | 0.072 | 0.085 | 0.088 | 0.048 | |
| D128 | 1.179 | 1.001 | 1.855 | 3.564 | 2.788 | 2.542 | 0.028 |
| 0.012 | 0.003 | 0.043 | 0.044 | 0.054 | 0.058 | 0.030 | |
| D154 | 1.178 | 0.989 | 2.147 | 3.359 | 2.723 | 2.701 | 0.013 |
| 0.034 | 0.012 | 0.122 | 0.124 | 0.151 | 0.157 | 0.085 | |
| D157 | 1.173 | 1.012 | 1.817 | 3.940 | 2.839 | 2.670 | 0.054 |
| 0.009 | 0.007 | 0.052 | 0.052 | 0.063 | 0.065 | 0.036 | |
| D158 | 1.154 | 0.959 | 2.237 | 3.114 | 2.484 | 2.309 | 0.007 |
| 0.021 | 0.009 | 0.088 | 0.089 | 0.107 | 0.115 | 0.061 | |
| GMP 3565 | 1.178 | 0.953 | 2.297 | 2.850 | 2.363 | 2.287 | 0.087 |
| 0.074 | 0.016 | 0.198 | 0.205 | 0.247 | 0.264 | 0.140 | |
| NGC 4864 | 1.197 | 1.028 | 1.738 | 4.716 | 2.907 | 2.889 | 0.074 |
| 0.012 | 0.005 | 0.039 | 0.041 | 0.048 | 0.049 | 0.027 | |
| NGC 4867 | 1.092 | 0.992 | 1.938 | 4.589 | 2.909 | 2.897 | 0.146 |
| 0.017 | 0.006 | 0.031 | 0.032 | 0.038 | 0.039 | 0.022 | |
| NGC 4871 | 1.160 | 1.020 | 1.832 | 4.442 | 2.957 | 2.921 | 0.120 |
| 0.009 | 0.003 | 0.034 | 0.036 | 0.044 | 0.045 | 0.024 | |
| NGC 4872 | 1.165 | 1.023 | 1.781 | 4.598 | 2.923 | 2.836 | 0.104 |
| 0.018 | 0.009 | 0.025 | 0.026 | 0.031 | 0.031 | 0.017 | |
| NGC 4873 | 1.117 | 0.976 | 1.867 | 4.457 | 2.827 | 2.663 | 0.094 |
| 0.011 | 0.007 | 0.042 | 0.044 | 0.053 | 0.054 | 0.029 | |
| NGC 4874 | 1.192 | 1.049 | 1.572 | 4.954 | 3.019 | 3.035 | 0.110 |
| 0.012 | 0.005 | 0.039 | 0.041 | 0.050 | 0.048 | 0.027 |
All indexes observed within an aperture of 2.7-arcsec diameter.
Rose (1985, 1994) has developed an absorption-line strength system, based on a combination of line-depth ratios and equivalent widths, which provides powerful tools for decomposing the hot-to-cool and giant-to-dwarf star ratios in composite populations. The Rose indexes of interest here are Ca ii (= Ca ii H+H/Ca ii K) and Hn/Fe (, Caldwell & Rose 1998), which together indicate the presence of hot stars in old, metal-rich stellar populations (Rose, 1985, 1994; Caldwell et al., 2003).
The LRIS spectra were first smoothed to a common velocity dispersion of as suggested by Caldwell et al. (2003), except for NGC 4874, which was left unsmoothed at its intrinsic velocity dispersion of . Indexes were then computed by finding the minimum intensity of each absorption line using a cubic spline interpolation of a small region around the centre of each line and then dividing the appropriate combination of lines to determine the index value. For example, the index is determined by finding the minimum intensity of the absorption line and dividing it by the minimum intensity of the Fe I absorption line. Indexes were determined independently from each of the three exposures after smoothing and the mean and sample standard deviations were used as the final index value and error, respectively. Within the errors of the two Rose indexes of interest (Hn/Fe and Ca ii), the indexes determined from the variance-weighted combined spectra and from the mean of the individual exposures are identical. However, the uncertainties determined from the standard deviations of the indexes determined from the individual exposures appear to be more reliable than those determined from estimation of the photon noise in the combined spectra (cf. Caldwell et al., 2003). Rose line strengths and errors for the current sample, measured in a synthesised circular aperture of 2.7-arcsec diameter, are presented in Table 1.

No correction for emission fill-in of the Hn/Fe index has been attempted. The fluxes of the H emission in each galaxy required to make the correction using the recipe of Appendix A of Caldwell et al. (2003) are unknown, although we expect that the corrections will be small: the typical correction to Hn/Fe in Caldwell et al. (2003) is 0.012, which is a correction of less than 1 Gyr for an 8 Gyr-old population. The precise value of Hn/Fe is however not used in the analysis that follows.
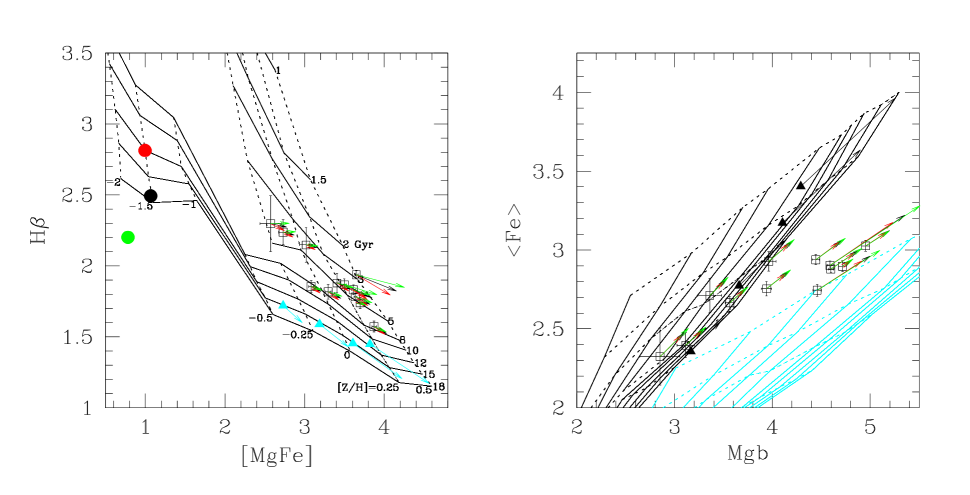
Furthermore, we cannot calibrate our index strengths on to a Rose ‘system’, as the Jones (1996) stellar library used by Caldwell et al. (2003) is smoothed to a velocity dispersion of 103 (the intrinsic resolution of our stellar spectra is roughly 150 ), and no published index strengths exist for the galaxies in the present study. However, the location of the Coma galaxies in the Hn/Fe–Ca ii diagram is coincident with the distribution of field and Virgo early-type galaxies in Caldwell et al. (2003), giving confidence that the moderate velocity smoothing is sufficient to calibrate the Coma galaxies on to a Rose-like ‘system’ (Fig. 1a).
2.3 Line strengths on the Lick/IDS system
The Lick/IDS absorption-line strength system has been developed by Faber, Burstein, and their collaborators (e.g. Burstein et al., 1984; Worthey et al., 1994; Trager et al., 1998) to determine the stellar content of early-type galaxies (as seen in the models of, e.g., Worthey, 1994; Thomas, Maraston & Bender, 2003). For the purpose of breaking the age–metallicity degeneracy inherent in colours and line strengths of old stellar populations (see, e.g., O’Connell, 1980), the , , Fe5270 and Fe5335 indexes are among the best-understood and best-calibrated (e.g., Trager et al., 2000a); we will use these four indexes to determine stellar population parameters in this study.
In order to measure Lick/IDS line strengths and then to place them on the Lick/IDS system, a series of spectral manipulations and calibrations are required. For the current observations, the complete series of steps performed is discussed in detail in TFD05; here we briefly review the process.
The first step in determining the line strengths of a galaxy is to measure its systemic velocity and velocity dispersion. These are needed to place the index bandpasses on the spectrum and to calibrate galaxy line strengths on to the Lick/IDS stellar system used by most stellar population models, including Worthey (1994). Both of these quantities are measured following the direct-fitting algorithm of Kelson et al. (2000) over the rest-frame wavelength range 4200–5100 Å.
Next, the spectrum is smoothed to the Lick/IDS resolution (Worthey & Ottaviani, 1997) using a variable-width Gaussian filter. The Lick/IDS index bandpasses are then placed on the spectrum and indexes measured in either Å or magnitudes, depending roughly on the width of the central bandpasses (Trager et al., 1998). Errors are determined from the object spectrum and its associated variance spectrum.
For galaxies, a correction for fill-in of absorption by emission is required (González, 1993). This is determined from the strength of the [O iii] line as determined from the residual spectrum after subtracting the best-fitting spectrum from the models of Vazdekis (1999) from the observed spectrum222We use the Vazdekis (1999) models for the emission correction because we achieve lower values in the spectral fitting (i.e., better fits) when using these models instead of the Worthey (1994) models. This is due to the denser coverage in age of the Vazdekis (1999) models with respect to the Worthey (1994) models.. The correction to is then determined using the [O iii]– correction suggested by Trager et al. (2000a): [O iii], where the [O iii] index is defined by González (1993) and is positive for emission within the central bandpass. This correction never exceeds Å for the present galaxies, or about 4% in strength.
Finally, two corrections are required to bring the galaxy indexes on to the Lick/IDS stellar system: small offsets resulting from the fact that the Lick/IDS system is not based on flux-calibrated spectra, and a velocity dispersion correction to account for the velocity broadening of the galaxies (González, 1993; Trager et al., 1998). The former correction is performed using observations of the Lick/IDS stars taken in the run; the latter is performed using the polynomial corrections given in Trager et al. (1998). The final Lick/IDS index strengths of early-type galaxies in the Coma Cluster for the four lines of interest and for [O iii] are given in Table 1.
3 Analysis
Our goal is to determine the fractional contribution of hot stars, assumed to arise from the blue horizontal branch stars of an old, metal-poor population, to the light at 4000 Å of early-type galaxies in the Coma Cluster and then to correct their age- and metallicity-sensitive line strengths for this contamination. We then compute the stellar population parameters age , metallicity , and enhancement ratio for each galaxy as observed and after correction for hot-star contamination. We can therefore determine the effect of these stars on the inferred stellar populations of early-type galaxies. Here SSP refers to the equivalent single stellar population, that is, a population of stars formed at the same time with the same chemical composition and , with the same line strengths as the galaxy.
3.1 Models
We use the models of Worthey (1994, hereafter W94) to analyse the stellar populations of early-type galaxies, extended to cover non-solar abundance ratios using the Tripicco & Bell (1995) response functions as described in Trager et al. (2000a). In particularly, we use the ‘vanilla’ W94 models, with extended horizontal branches at low metallicities, described in Leitherer et al. (1996). While these models provide line strengths on the Lick/IDS system, they do not normally provide Rose index values nor spectra (as in, e.g., Vazdekis, 1999; Bruzual & Charlot, 2003). Leonardi & Worthey (2000, see also ) extended the W94 models to produce spectra using the empirical stellar spectra library of Jones (1996) and theoretical stellar spectra generated with the SYNTHE and ATLAS programs (R. L. Kurucz 1995, priv. comm.). We use these model spectra in our analysis of the Hn/Fe–Ca ii plane (Fig. 1) and in our correction of the observed early-type galaxy spectra for contamination by hot-star light.
To determine stellar population parameters, we fit observed (or corrected) line strengths to model line strengths using the method described in TFD05. Briefly, we determine stellar population parameters using a nonlinear least-squares code based on the Levenberg-Marquardt algorithm. Stellar population models are interpolated on the fly to produce model indexes which are compared to the observed (or corrected) indexes , , Fe5270 and Fe5335. Uncertainties are determined by taking the dispersion of stellar population parameters from 500 Monte Carlo trials using the errors of the observed line strengths, assuming that these errors are normally distributed.
3.2 Method
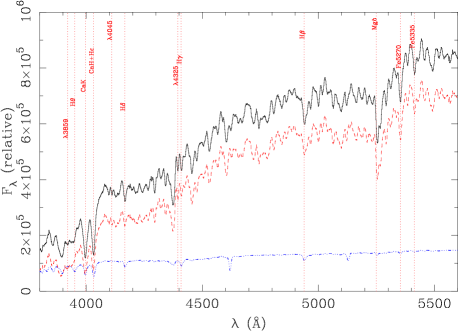
Our method is based on the suggestion of Rose (1985, 1994) and Caldwell et al. (2003) to use the Hn/Fe–Ca ii plane to determine the presence and amount of hot-star light at 4000 Å in early-type galaxies. The W94 models predict an asymptotic Ca ii strength of 1.24 for metal-rich populations with ages Gyr (Fig. 1)333The Vazdekis (1999) models have a slightly stronger asymptotic Ca ii strength of 1.25, which implies slightly higher hot-star fractions by typically about 1% of the light at 4000 Å. However, we do not use the Vazdekis (1999) models for the analysis of the impact of the hot-star population on the stellar population parameters because these models (1) appear not to have the same flux calibration in the “blue” and “red” models and (2) have not been modified to account for enhancement-ratio variations.. A hot-star spectrum is first smoothed to instrumental resolution of LRIS and to the velocity dispersion of the galaxy in question and then subtracted from the observed spectrum in increments of (where is the fraction of light coming from the old, metal-poor population at 4000 Å) until the measured Ca ii strength in the residual spectrum reaches the asymptotic old, metal-rich value. A demonstration of this process is given in Figure 2 for NGC 4867.
| Fe5270 | Fe5335 | ||||
|---|---|---|---|---|---|
| M | Population | (Å) | (Å) | (Å) | (Å) |
| 1 | 17 Gyr, | 2.493 | 1.188 | 1.029 | 0.885 |
| 2 | 12 Gyr, | 2.814 | 1.185 | 0.896 | 0.778 |
| 3 | NGC 6254 (M10) | 2.200 | 0.687 | 0.902 | 0.877 |
M is the model number in Table 3.
We choose three baseline hot-star models, whose line strengths are given in Table 2. The first is a 17 Gyr-old single stellar population model with dex and therefore an extended horizontal branch running from red to blue; the assumed dex, that is to say, having the same as the calibrating stars (Thomas et al., 2003). As described in Trager et al. (2000a), the W94 model ages are older by 10–25 per cent than models based on isochrones from the Padova group (Bertelli et al., 1994); this 17 Gyr-old model is equivalent in its line strengths to a 15 Gyr old model from, say, Thomas et al. (2003). The second is a younger, metal-poor single-stellar population with an age of 12 Gyr, dex, and dex, also with an extended horizontal branch. The third is the observed spectrum of the globular cluster NGC 6254 (M10) from the compilation of Schiavon et al. (2005)444http://www.astro.virginia.edu/ rps7v/GCs/intro.html, which has and an extended, blue horizontal branch (see, e.g., Rosenberg et al., 2000). The indexes given in Table 2 are derived from the spectrum of Schiavon et al. (2005) and corrected using the LRIS-based flux corrections.
We note here that Schiavon et al. (2004) present an alternative approach using the ratio as a function of Fe4383. We have not attempted this method here, as it is dependent on knowing the response of to -enhancements, which have only just become available and are currently in the process of being incorporated into stellar population models (Thomas et al., 2004; Korn et al., 2005; Lee & Worthey, 2005).
4 Results and Discussion
| observed | corrected | ||||||||
|---|---|---|---|---|---|---|---|---|---|
| Name | Age (Gyr) | M | Age (Gyr) | ||||||
| D127 | 1 | 0.09 | 0.08 | ||||||
| 2 | 0.08 | 0.05 | |||||||
| 3 | 0.11 | ||||||||
| D128 | 1 | 0.07 | 0.05 | ||||||
| 2 | 0.06 | 0.04 | |||||||
| 3 | 0.09 | ||||||||
| D154 | 1 | 0.08 | 0.11 | ||||||
| 2 | 0.07 | 0.07 | |||||||
| 3 | 0.10 | ||||||||
| D157 | 1 | 0.09 | 0.07 | ||||||
| 2 | 0.08 | 0.05 | |||||||
| 3 | 0.11 | ||||||||
| D158 | 1 | 0.09 | 0.12 | ||||||
| 2 | 0.08 | 0.08 | |||||||
| 3 | 0.11 | ||||||||
| GMP 3565 | 1 | 0.13 | 0.20 | ||||||
| 2 | 0.12 | 0.13 | |||||||
| 3 | 0.18 | ||||||||
| NGC 4864 | 1 | 0.03 | 0.03 | ||||||
| 2 | 0.03 | 0.02 | |||||||
| 3 | 0.05 | ||||||||
| NGC 4867 | 1 | 0.22 | 0.26 | ||||||
| 2 | 0.19 | 0.17 | |||||||
| 3 | 0.30 | ||||||||
| NGC 4871 | 1 | 0.08 | 0.08 | ||||||
| 2 | 0.08 | 0.05 | |||||||
| 3 | 0.11 | ||||||||
| NGC 4872 | 1 | 0.09 | 0.07 | ||||||
| 2 | 0.08 | 0.05 | |||||||
| 3 | 0.12 | ||||||||
| NGC 4873 | 1 | 0.17 | 0.15 | ||||||
| 2 | 0.15 | 0.10 | |||||||
| 3 | 0.23 | ||||||||
| NGC 4874 | 1 | 0.07 | 0.05 | ||||||
| 2 | 0.06 | 0.03 | |||||||
| 3 | 0.08 | ||||||||
All stellar population parameters are those in a 2.7-arcsec diameter aperture. M is the hot-star population given in Table 2. is the fraction of light at 4000 Å contained in the ‘hot’ (i.e., old, metal-poor) stellar population as determined from Ca ii; is fraction of the total mass contained in the hot stellar population. Note that is unknown for NGC 6254 but is likely to be slightly higher than that of the 17 Gyr, dex population (cf. Fig. 3).
Figure 1b shows the results of the correction for hot-star light on the Hn/Fe and Ca ii strengths for three of the Coma galaxies. Table 3 gives the required fractions to correct the spectra for hot-star light for all twelve galaxies: these range from 3 per cent of the total light within the 2.7 arcsec aperture at 4000 Å for NGC 4864 to 22 per cent for NGC 4867 when the hot-star light comes from the 17 Gyr old model, with a mean value of 7.9 per cent and an rms scatter of 2.9 per cent (here we use the bi-weight mean and scatter described in Beers, Flynn, & Gebhardt, 1990). When the 12 Gyr model is used, these fractions range from 3–19 per cent with a mean of 7.0 per cent and an rms scatter of 2.6 per cent, and when NGC 6254 is used, the range is 5–30 per cent with a mean of 10.2 per cent and an rms scatter of 3.7 per cent.
The inferred masses of the metal-poor components are also listed in Table 3; the bi-weight mean mass fractions of the metal-poor component are per cent for the 17 Gyr old population and per cent for the 12 Gyr old population. Note that the mass-to-light ratio of NGC 6254 is unknown and therefore the hot-star mass fractions are also unknown for this case. These average mass fractions are consistent with the conclusion of Worthey et al. (1996) that most or all elliptical galaxies have a metal-poor fraction per cent, with a few exceptions depending on the age of the metal-poor population; GMP 3565, NGC 4867, and NGC 4873 are the most extreme cases. We have not fully explored alternative explanations in this short paper, but GMP 3565 is the most metal-poor of the galaxies, and thus may have a stronger metal-poor tail if it has the same abundance distribution as other galaxies shifted to lower mean abundance. The other two galaxies are candidates to violate the 5 per cent rule, but explanations such as UV-upturn populations, multiple-age populations, and blue stragglers have yet to be explored.
| M | frac | frac | dex | dex | dex | dex |
|---|---|---|---|---|---|---|
| 1 | 0.942 | 0.065 | 0.089 | 0.033 | 0.022 | 0.007 |
| 2 | 1.003 | 0.046 | 0.066 | 0.024 | 0.014 | 0.006 |
| 3 | 0.873 | 0.099 | 0.115 | 0.005 | 0.026 | 0.012 |
M is the hot-star population given in Table 2. and are the mean and rms scatter in fractional change in the age.
After the appropriate fraction of hot-star light has been subtracted from the observed spectrum, Lick/IDS line strengths are recomputed (including velocity dispersion, emission, and systemic corrections). The results are shown in Figure 3 as vectors pointing from the observed line strengths to the corrected line strengths. As is clear from this figure, the change in the line strengths point along vectors of nearly constant age with an increase in metallicity and a slight increase in being the major effects. This is borne out by the inferred stellar population parameters in Table 3 and the fractional changes in Table 4: only NGC 4867 changes its age by more than . However, NGC 4867 is extrapolated far off of the W94 grids after subtraction in all three cases, and so the inferred ages and metallicities are suspect.
We therefore find that the presence of even moderate amounts of light from hot stars does not significantly alter the inferred ages of early-type galaxies in the presence of intermediate-aged populations, provided that the hot-star light comes from an old, metal-poor population containing blue horizontal branch stars. We however do not claim that the ages of early-type galaxies are unaffected by hot stars. In fact, we reproduce in Fig. 3 the result of Maraston & Thomas (2000) that the oldest stellar populations ( Gyr) look younger by 2–5 Gyr when ancient, metal-poor populations are superimposed on ancient, metal-rich populations. Rather, we suggest that when an intermediate-aged population is present, i.e., when Å, the influence of hot stars on the inferred age is nearly negligible (see also Thomas et al., 2005). The difference between the effect of hot-star light on intermediate-aged and old populations is mostly due to the change in slope of the W94 grids at old ages and high metallicities in the – diagram and to the high strengths of the observed galaxies due, presumably, to intermediate-aged stellar populations.
The increased inferred metallicity but nearly constant age in the corrected population can be understood in the context of the Appendix of Trager et al. (2000b), which demonstrated that stellar populations add as vectors in the –metal-line spaces (such as –). In effect, the ‘two’ populations in the Coma early-type galaxies–the metal-rich, intermediate-aged population with high and high , and the metal-poor, old population with high (from the hot blue horizontal branch stars) and low –add to produce observed populations with high and moderate strengths. The strengthening of the line from the hot stars is compensated by a dilution of the continuum around the metal lines (Fig. 2), which weakens their measured equivalent widths. These weakened metal lines combined with the stronger line serve to preserve the inferred age of the galaxy while lowering the observed metallicity.
5 Conclusions
We have examined the effect of hot (horizontal branch) stars on the inferred stellar population parameters of early-type galaxies using observations of twelve -strong early-type galaxies in the Coma Cluster and spectra drawn from stellar population models as well as an observed spectrum of a metal-poor globular cluster with a purely blue horizontal branch. If the hot-star light comes from ancient, metal-poor populations (Rose, 1985, 1994; Lee et al., 2000; Maraston & Thomas, 2000; Caldwell et al., 2003) typically contributing per cent of the light at 4000 Å (as detected in the Ca ii index), the ages of these galaxies are not significantly affected by the correction for this hot-star light. For the oldest, most metal-rich galaxies, this correction can be significant, as shown by Maraston & Thomas (2000) and Fig. 3. But this correction is insignificant for the intermediate-aged populations found in these early-type Coma galaxies, and likely also for the field and group galaxies studied by Trager et al. (2000b), many of which have similarly high line strengths. We suggest therefore that the claim that old, metal-poor stars can ‘explain away’ the strong lines in these early-type galaxies (e.g., Maraston & Thomas, 2000) is overstated.
The presence of blue straggler stars in these galaxies is still a possibility to explain the enhanced Balmer-line strengths of early-type galaxies. However, as discussed by Rose (1985) and Trager et al. (2000a), populations of blue straggler stars are subject to the same constraints as other hot-star populations, as blue straggler stars typically have spectral types around mid-A. This is the same colour as the BHB stars that dominate the Balmer-line strengths of the old, metal-poor populations we have considered here. Using the same arguments we have already presented, therefore, we suggest that blue straggler stars are unlikely to affect the inferred ages of -strong galaxies. We conclude that intermediate-aged populations are still required to explain the strong lines in early-type galaxies.
Acknowledgments
The authors wish to recognise and acknowledge the very significant cultural role and reverence that the summit of Mauna Kea has always had within the indigenous Hawaiian community. We are most fortunate to have had the opportunity to conduct observations from this mountain.
It is a pleasure to thank D. Kelson, C. Maraston, J. Rose, and D. Thomas for many stimulating discussions, R. Schiavon for making his spectrum of NGC 6254 available in advance of publication, L. MacArthur for a careful reading of an early version of the manuscript, and an anonymous referee for suggestions that improved the clarity of the presentation. Support for this work was provided by NASA through Hubble Fellowship grant HF-01125.01-99A to SCT awarded by the Space Telescope Science Institute, which is operated by the Association of Universities for Research in Astronomy, Inc., for NASA under contract NAS 5-26555; by a Carnegie Starr Fellowship to SCT; by NSF grants AST-0307487 and AST-0346347 to GW; by NSF grants AST-9529098 and AST-0071198 to SMF; and by NASA contract NAS5-1661 to the WF/PC-I IDT.
References
- Beers et al. (1990) Beers T. C., Flynn K., Gebhardt K., 1990, AJ, 100, 32
- Bertelli et al. (1994) Bertelli G., Bressan A., Chiosi C., Fagotto F., Nasi E., 1994, A&AS, 106, 275
- Bruzual & Charlot (2003) Bruzual G. & Charlot S., 2003, MNRAS, 344, 1000
- Burstein et al. (1984) Burstein D., Faber S. M., Gaskell C. M., Krumm N., 1984, ApJ, 287, 586
- Caldwell & Rose (1998) Caldwell N. & Rose J. A., 1998, AJ, 115, 1423
- Caldwell et al. (2003) Caldwell N., Rose J. A., Concannon K. D., 2003, AJ, 125, 2891
- de Freitas Pacheco & Barbuy (1995) de Freitas Pacheco J. A., Barbuy B., 1995, A&A, 302, 718
- González (1993) González J. J., 1993, PhD Thesis, Univ. California Santa Cruz
- Jones (1996) Jones L. A., 1996, PhD Thesis, Univ. North Carolina Chapel Hill
- Kelson (2003) Kelson, D. D., 2003, PASP, 115, 688
- Kelson et al. (2000) Kelson D. D., Illingworth G. D., van Dokkum P. G., Franx M., 2000, ApJ, 531, 159
- Korn et al. (2005) Korn, A. J., Maraston, C., Thomas, D., 2005, A&A, in press
- Lee & Worthey (2005) Lee, H.-C., Worthey, G., 2005, ApJS, in press
- Lee et al. (2000) Lee H.-C., Yoon S.-J., Lee Y.-W., 2000, AJ, 120, 998
- Leitherer et al. (1996) Leitherer C., et al., 1996, PASP, 108, 996
- Leonardi & Worthey (2000) Leonardi A. J., Worthey G., 2000, ApJ, 534, 650
- Maraston & Thomas (2000) Maraston C., Thomas D., 2000, ApJ, 541, 126
- Mehlert et al. (2003) Mehlert D., Thomas D., Saglia R. P., Bender R., Wegner G., 2003, A&A, 407, 423
- Moore et al. (2002) Moore, S. A. W., Lucey J. R., Kuntschner H., Colless M., 2002, MNRAS, 336, 382
- O’Connell (1980) O’Connell R. W., 1980, ApJ, 236, 430
- Oke et al. (1995) Oke J. B., et al., 1995, PASP, 107, 375
- Rose (1985) Rose J. A., 1985, AJ, 90, 1927
- Rose (1994) Rose J .A., 1994, AJ, 107, 206
- Rose & Tripicco (1986) Rose, J. A., Tripicco M. J., 1986, AJ, 92, 610
- Rosenberg et al. (2000) Rosenberg A., Aparicio A., Saviane I., Piotto G., 2000, A&AS, 145, 451
- Schiavon et al. (2004) Schiavon R. P., Rose J. A., Courteau S., MacArthur L. A. 2004, ApJ, 608, L33
- Schiavon et al. (2005) Schiavon R. P., Rose J. A., Courteau S., MacArthur L. A. 2005, ApJS, in press
- Thomas et al. (2003) Thomas D., Maraston C., Bender R., 2003, MNRAS, 339, 897
- Thomas et al. (2004) Thomas D., Maraston C., Korn A., 2004, MNRAS, 351, L19
- Thomas et al. (2005) Thomas D., Maraston C., Bender R., de Oliveira C. M., 2005, ApJ, 621, 673
- Trager et al. (1998) Trager S. C., Worthey G., Faber S. M., Burstein D., González J. J., 1998, ApJS, 116, 1
- Trager et al. (2000a) Trager, S. C., Faber S. M., Worthey G., González J. J., 2000a AJ, 119, 1645
- Trager et al. (2000b) Trager, S. C., Faber S. M., Worthey G., González J. J., 2000b AJ, 120, 165
- Tripicco & Bell (1995) Tripicco M. Bell R. A., 1995, AJ, 110, 3035
- Vazdekis (1999) Vazdekis A., 1999, ApJ, 513, 224
- Worthey (1994) Worthey G., 1994, ApJS, 95, 107
- Worthey et al. (1996) Worthey G., Dorman B., Jones L. A., 1996, AJ, 112, 948
- Worthey & Ottaviani (1997) Worthey G. Ottaviani D. L., 1997, ApJS, 111, 377
- Worthey et al. (1994) Worthey G., Faber S. M., González J. J., Burstein D., 1994, ApJS, 94, 687