Optical Constraints on an X-ray Transient Source in M31
Abstract
We have detected a transient X-ray source in the M31 bulge through a continuing monitoring campaign with the Chandra ACIS-I camera. The source was detected at R.A.=00:42:33.428 0.11′′, Dec.=+41:17:03.37 0.11′′ in only a single observation taken 2004-May-23. Fortuitous optical /ACS imaging of the transient location prior to the X-ray outburst, along with follow-up /ACS imaging during and after the outburst, reveals no transient optical source brighter than (equivalent) = 25.5. The location of the source and its X-ray properties suggest it is a low mass X-ray binary (LMXB). Assuming the transient is similar to many Galactic X-ray novae, the X-ray luminosity of (3.90.5)1037 erg s-1 and the upper-limit on the optical luminosity provide a prediction of 1.6 days for the orbital period of the binary system.
1 Introduction
Many low-mass X-ray binaries (LMXBs) that undergo bright, transient X-ray bursts have been shown to harbor compact objects with masses 3 M⊙ (see McClintock & Remillard, 2004, and references therein). These sources are some of the most securely identified black holes known. Such sources are therefore of great interest for future studies of black hole accretion disk physics and general relativity.
The Chandra X-ray observatory is well-suited to searching for similar X-ray sources in nearby galaxies. In particular, the bulge of M31 can be entirely searched for bright, transient X-ray events with a single 5 ks observation. Monitoring of M31 by Chandra has shown that such transient sources appear in the M31 bulge about once each month (Williams et al., 2004). These efforts have been successful in finding dozens of transient sources (Kong et al., 2002; Di Stefano et al., 2004; Williams et al., 2004).
Recently, this monitoring effort has been combined with follow-up observations, and optical counterparts for some transient X-ray sources have been found, placing new constraints on the physical properties of these potential black hole binary systems (Williams et al., 2004, 2005a, 2005b). With a sufficient number of optical counterparts, the orbital period distribution of these likely black hole binaries can be determined. This distribution is a fundamental observable parameter that must be matched by any model of binary stellar evolution.
Here, we report a bright outburst from an X-ray source in M31. imaging prior to, during, and after the outburst reveals no optical sources that exhibited strong variability during the X-ray outburst within the location uncertainty, suggesting that the optical counterpart of the X-ray nova (XRN) was fainter than . Section 2 discusses the details of the data, including the reduction and analysis techniques used. Section 3 provides the results of the analysis, and § 4 explains the implications of these results. Finally, § 5 summarizes our conclusions.
2 Data Reduction and Analysis
2.1 X-ray
We obtained observations of the M31 bulge with the Chandra ACIS-I camera on 2004-January-31 (ObsID 4681), 2004-May-23 (ObsID 4682), and 2004-July-17 (ObsID 4719). Observations 4681 and 4682 were Guaranteed Time Observations supplied by S. Murray. All of the data were obtained in “alternating readout mode” which reduces event pileup for bright sources but lowers the effective exposure by . Observation 4681 was observed centered on R.A.=00:42:44.4, Dec.=41:16:08.3 with a roll angle of 305.6 degrees for an effective exposure time of 4.09 ks. Observation 4682 was centered on the same coordinates with a roll angle of 80.0 degrees for an effective exposure time of 3.95 ks, and observation 4719 was observed centered on R.A.=00:42:44.3, Dec.=41:16:08.4 with a roll angle of 116.8 degrees for an effective exposure time of 4.12 ks.
These observations were all reduced using the software package CIAO v3.1 with the CALDB v2.28. We created exposure maps for the images using the task merge_all,111http://cxc.harvard.edu/ciao/download/scripts/merge_all.tar and we found and measured positions and fluxes of the sources in the image using the CIAO task wavdetect.222http://cxc.harvard.edu/ciao3.0/download/doc/detect_html_manual/Manual.html Each data set detected sources down to (0.3–10 keV) fluxes of 610-6 photons cm-2 s-1 or 0.3–10 keV luminosities of 1036 erg s-1 for a typical X-ray binary system in M31.
We aligned the coordinate system of the X-ray images with the optical images of the Local Group Survey (LGS; Massey et al., 2001). These images have an assigned J2000 (FK5) world coordinate system accurate to 0.25′′, and they provided the standard coordinate system to which we aligned all of our data for this project. The positions of X-ray sources with known globular cluster counterparts were aligned with the globular cluster centers in the LGS images using the IRAF333IRAF is distributed by the National Optical Astronomy Observatory, which is operated by the Association of Universities for Research in Astronomy, Inc., under cooperative agreement with the National Science Foundation. task ccmap, allowing adjustments of the pixel scale as well as rotation and shifts in and . The alignment had errors of 0.073′′ in R.A. and 0.034′′ in Dec. as determined by ccmap.
In addition, we measured the position errors for the X-ray sources using the IRAF task imcentroid, which projects the counts from the source onto each axis and calculates the error in the position by dividing the standard deviation of the pixel positions of all of the source counts by the square root of the number of counts. Because the pixels in Chandra images are aligned with north up and east to the left, the X position error was taken to be the R.A. error, and the Y position error was taken to be the Dec. error.
We cross-correlated the X-ray source positions against all previously published X-ray catalogs and the Simbad444http://simbad.u-strasbg.fr/ database to look for any new, bright X-ray source likely to be an X-ray nova (XRN). Herein we focus on one bright source in particular which was detected only in observation 4682 at R.A.=00:42:33.428, Dec.=+41:17:03.37. This source was detected once by ROSAT in 1990 ([PFJ93] 31; Primini et al., 1993), but it has not been detected since. We name this source CXOM31 J004233.4+411703, following the naming convention described in Kong et al. (2002). We also give this source the short name, r2-71, based on the source position in M31 using the description given in Williams et al. (2004). The source is 2.0′ west and 0.9′ north of the M31 nucleus. Upper-limits to the X-ray flux at this position in observations 4681 and 4719 were measured by determining the flux necessary to produce a detection 4- above the background flux.
We extracted the X-ray spectrum of r2-71 from the detection in observation 4682, which contained 198 counts, using the CIAO task psextract.555http://cxc.harvard.edu/ciao/ahelp/psextract.html We binned the spectrum in energy so that each bin contained 10 counts to allow for standard statistics. We then fit the spectrum using CIAO 3.1/Sherpa. Two spectral models were fitted to the spectrum: a power-law with absorption and a disk blackbody model with absorption. The spectrum did not contain sufficient information to provide useful constraints on the foreground absorption. We therefore fixed the absorption to the typical Galactic foreground value (61020 cm-2). This value provided acceptable fits for both model types. Results are discussed in § 3.
2.2 Optical
We obtained three sets of HST ACS data. The first ACS image was taken 2004-January-23 in pursuit of another transient source. This observation was pointed at R.A.=00:42:43.86, Dec.=41:16:30.1 with an orientation of 55 deg, fortuitously containing the location of r2-71 in the northern corner of the image even though r2-71 had not been detected in any Chandra observations. The second observation was taken 2004-June-14. Intended to search for the optical counterpart of r2-71, this observation was pointed at R.A.=00:42:33.39, Dec.=41:17:43.4 with an orientation of 260 deg. The slightly northern pointing was done to avoid a dangerously bright star from landing on the CCD. The third observation was taken on 2004-August-15, after the X-ray source had faded. This observation was pointed at R.A.=00:42:41.5, Dec.=41:17:00.0 with an orientation of 220 deg in order to pursue another transient source in the field.
All three observations were taken using the standard ACS box 4-point dither pattern to recover the highest possible spatial resolution. All exposures were taken through the F435W filter. The total exposure times were 2200 seconds for each data set. We aligned and drizzled each set of 4 images into high-resolution (0.025′′ pixel-1) images using the PyRAF666PyRAF is a product of the Space Telescope Science Institute, which is operated by AURA for NASA. task multidrizzle,777multidrizzle is a product of the Space Telescope Science Institute, which is operated by AURA for NASA. http://stsdas.stsci.edu/pydrizzle/multidrizzle which has been optimized to process ACS imaging data. The task removes cosmic ray events and geometric distortions, and it combines the dithered frames together into one final photometric image.
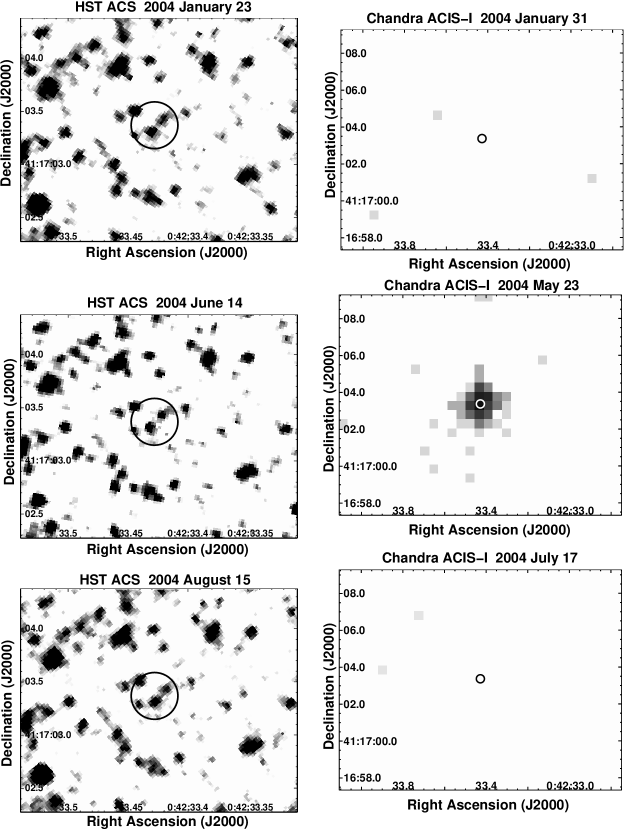
We aligned the images to the LGS coordinate system with ccmap using stars common to both data sets. The resulting alignment had rms errors of 0.04′′ (less than 1 ACS pixel). The consistency of this alignment can be seen by the excellent agreement between the resulting coordinate systems of the three images, each independently aligned with the LGS coordinate system, shown in Figure 1.
We processed the relevant sections of the final images with DAOPHOT II and ALLSTAR (Stetson et al., 1990) to obtain photometry for the resolved stars within the error circle of the X-ray transient. This region is extremely crowded with stars at only 2.2′ from the M31 nucleus. The faintest source visible in the error circles in the images shown in Figure 1 is ; the brightest is (on the northeast rim of the circle).
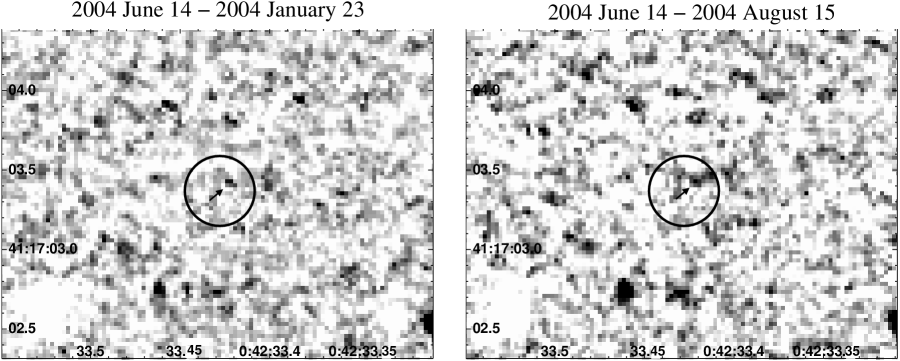
We subtracted the images taken before and after the X-ray nova from the 2004-June-14 observation, during which the X-ray source was likely to be active. Prior to subtraction, the images were transformed to have pixels aligned in North-up, East-left orientation. These transformations were performed with the IRAF tasks geomap and geotran. The relevant sections of the subtracted images are shown in Figure 2.
3 Results
3.1 X-ray
The three X-ray images from our observations are shown in Figure 1. These images clearly show r2-71 detected only in the 2004-May-23 observation. This detection had a 0.3–10 keV flux of (1.70.110-4 photons cm-2 s-1. The previous observation and following observation had 4 upper limits of 1.410-5 photons cm-2 s-1. The second upper limit shows that the source decayed by a factor of at least 12 in 55 days. Therefore the -folding decay time of r2-71 was 22 days.
The non-detection of this source in the survey of Kong et al. (2002) provides a 0.3–7 keV flux upper limit of 810-7 photons cm-2 s-1, showing that the source changed in flux by more than a factor of 100. Therefore r2-71 is certainly a transient X-ray source in M31.
The errors in the centroid determination of the X-ray source were 0.08′′ in R.A. and 0.10′′ in Declination. We added these errors in quadrature to the errors in the alignment of the X-ray and optical images (0.073′′ in R.A. and 0.034′′ in Declination) to obtain the final (1) position errors of 0.11′′ and 0.11′′ in R.A. and Declination respectively. These errors resulted in the 2 error circle shown in Figure 1.
The X-ray spectrum of r2-71 was well-fitted by both the power-law and the disk-blackbody models. Fortunately, both of these fits give the same measurement for the absorption-corrected 0.3–7 keV flux and the corresponding 0.3–7 keV luminosity. The best-fitting power-law has a slope of 1.50.1 with =17.87/17 (probability = 0.40). This fit yields an unabsorbed 0.3–7 keV flux of ()10-13 erg cm-2 s-1. The best fitting disk blackbody has an inner disk temperature of kT=1.40.2 keV, an inner disk radius of km with a (probability=0.50). The resulting unabsorbed 0.3–7 keV flux is ()10-13 erg cm-2 s-1.
Assuming a distance to M31 of 780 kpc (Williams, 2003), the results are both consistent with the X-ray luminosity of (3.90.4)1037 erg s-1 obtained from the power-law fit, similar to the luminosity seen in the 1990 ROSAT data by Primini et al. (1993). The spectrum of r2-71 is in the normal range of M31 X-ray transients as measured by Williams et al. (in preparation), with hardness ratios of and , where S, M, and H represent the number of counts detected in the energy ranges 0.3–1.0, 1.0–2.0, and 2.0–7.0 keV, respectively. Gaussian errors were measured for the background-subtracted number of counts in each energy bin with the CIAO task dmextract.
3.2 Optical
Analysis of the optical data initially provided a few possible variable stars within the r2-71 error circle. We scrutinized each possibility through aperture photometry, completeness tests, and difference imaging. The results show no strong detection of optical variability and provide an upper-limit to the magnitude of any highly variable counterpart to r2-71.
The region of interest for all three of our optical observations is shown in the images in Figure 1. The DAOPHOT II output revealed one star in the error circle that was significantly brighter in the 2004-June-14 observation, when the X-ray source was most likely active. The star at R.A.=00:42:33.414, decl.=41:17:03.47, was measured to have in the 2004-June-14 observation. DAOPHOT II failed to find this star in the 2004-January-23 observation. Because inspection of the 2004-January-23 image reveals a source at this location, this non-detection was likely due to the effects of the bright neighboring star 0.05′′ to the southeast. Aperture photometry of the location in the 2004-January-23 observation with a 0.075′′ radius aperture yields . DAOPHOT II measured the star to be in the 2004-August-15 observation. Therefore according to the standard errors an increase in brightness during the 2004-June-14 at the 4 confidence level occurred; however, the standard errors do not take into account the uncertainty introduced by the close brighter neighbor. Any added uncertainty due to crowding would decrease the significance of this brightness increase.
In addition to this suspicious counterpart candidate, there were 2 fainter stars detected by DAOPHOT II in the error circle of the 2004-June-14 observation that were not detected in the other 2 observations, when the X-ray source was not active. These stars had magnitudes of 26.60.2 and 26.70.2 in the 2004-June-14 observation. These stars may not have been detected in the other observations because crowding issues caused our photometry to be incomplete at these faint magnitudes.
We determined the completeness of the optical data in the area of r2-71 by comparing the DAOPHOT II output from the 2004-June-14 observation to those of the 2004-August-15 observation. Figure 3 shows two histograms. The solid histogram shows the percentage of stars detected by the DAOPHOT analysis in the 2004-June-14 observation within 3′′ of the center of the error circle but not detected by the same analysis in the 2004-August-15 observation. The dotted histogram shows the percentage of stars detected by the DAOPHOT analysis in the 2004-August-15 observation within 3′′ of the center of the error circle but not detected by the same analysis in the 2004-June-14 observation. The number of lost stars begins to increase at , suggesting that the completeness of the data begins to decrease at that magnitude, most likely due to the crowding in this dense region of M31. This result is consistent with the failure of DAOPHOT II to detect the star in the error circle in the 2004-January-23 observation, even though there appears to be emission at that location in the image in Figure 1. Therefore all of the variable candidates in the r2-71 error circle are attributable to crowding and completeness issues, as they are all fainter than .
The lack of any strong variability detection within the r2-71 error circle is confirmed with the difference images shown in Figure 2. The most variable location in the difference images is marked with arrows; this variability is not statistically significant. The DAOPHOT analysis did not measure a brightness increase for this star in the 2004-June-14 data. As a second check for a possible brightness increase, we performed aperture photometry of the location in all three observations with a 0.1′′ radius aperture. The location had in the 2004-June-14 observation and in the other observations (), showing variability of only 1.5. We discounted this low-significance peak in the difference image as a counterpart candidate for r2-71.
Concisely, no variable star inside the error circle of r2-71 was found other than suspicious DAOPHOT detections affected by crowding and completeness. Therefore, we were unable to identify the optical counterpart to r2-71; however, our completeness results suggest that any highly variable counterpart must have had during the 2004-June-14 observation.
4 Discussion
4.1 Duty Cycle
Our search of the literature found one previous detection of r2-71 in 1990. The detection was in only one ROSAT observation (source 31 in Primini et al., 1993), and the lack of detections of outbursts of this source before or since (Trinchieri & Fabbiano, 1991; Kong et al., 2002; Williams et al., 2004) helps to constrain the duty cycle of this system. M31 was observed by Einstein in the summers and winters of 1979 and 1980 (Trinchieri & Fabbiano, 1991) and by ROSAT in the summers of 1990 (Primini et al., 1993), 1991 (Supper et al., 1997), 1992 (Supper et al., 2001), 1994, and 1995. We searched the ROSAT HRI images of the M31 bulge taken in the summers of 1994 and 1995 and found no detections of r2-71. It was therefore detected only once in about 9 months of monitoring spanning 7 years before Chandra. These observations constrain the duty cycle of the source to be 0.1, since a larger duty cycle would have allowed more than one detection in these early data sets.
Now, in 2004, r2-71 has been seen for the first time in about 5 years of Chandra monitoring, going back to late 1999 (Williams et al., 2004; Kong et al., 2002). Assuming the 1990 outburst also lasted 1 month, the source has been active for at least 2 months of a 14 year timespan, providing a lower limit on its duty cycle of 0.01. Adding the 8 months per year for 5 years of Chandra monitoring to the 9 months of monitoring before Chandra implies 2 months of activity in 49 months of monitoring, or a duty cycle of 0.04. Therefore, our best estimate of the duty cycle of r2-71 is 0.04, and it can be reliably constrained to the range 0.01–0.1.
4.2 Orbital Period
The HST data provide indirect evidence that r2-71 is an LMXB. This preliminary classification allows us to predict the range in which the orbital period of the system will fall assuming the system is similar to Galactic LMXB transient systems.
The data set rules against the possibility that the X-ray source is an HMXB. Even the brightest star in the error circle of r2-71 has , which implies M (assuming and ). Even so, this -band luminosity is fainter than massive O and B type stars. Furthermore, this brightest star is not considered a counterpart candidate because it did not show significant variability. Because r2-71 is not an HMXB, we continue under the assumption that it is an LMXB.
Van Paradijs & McClintock (1994) identified an empirical correlation between the optical/X-ray luminosity ratios of LMXBs in outburst and their orbital periods. Their model assumes that the optical emission arises from X-ray heating of the accretion disk. Larger disks form in longer period systems and glow brighter in the optical than smaller disks. In this model, the faint upper-limit on the optical brightness of r2-71 would suggest that it is a small accretion disk system with a short orbital period. Counter-examples to the correlation exist, like XTE J1118+480 (Williams et al., 2005a); however, such counter-examples usually stand out as odd in other ways. For example, XTE J1118+480 was fainter and harder than typical XRNe. Therefore, for the purposes of the prediction, we assume that r2-71 is an XRN similar to the many Galactic LMXB transient events that fit the correlation well. A few of these are described in detail below.
We checked the applicability of the correlation to the specific case of our data because our X-ray and optical data are not precisely contemporaneous. If the errors in the correlation and optical luminosity are taken into account, our investigations show that the correlation provides reliable period range predictions for both “classical” and more recently discovered Galactic XRNe, even if the optical luminosity is measured 3 weeks after the X-ray luminosity.
First, we checked the application of the correlation to “classical” Galactic XRNe, those with smooth exponential decays (e.g. A0620-00, Nova Mus, GRO 0422+32, etc.). These types of events have optical decay timescales that average 2.2 times longer than their X-ray decay timescales (Chen et al., 1997). For example, A0620-00 has an -folding optical decay time of 75 days and an X-ray decay time of 25 days (Esin et al., 2000), so that its optical flux decreases by 25% in 3 weeks, for a 0.3 mag change. Such an effect is small compared to the large dynamic range of the correlation, which covers 8 optical magnitudes and 3 orders of magnitude in X-ray luminosity. The X-ray flux of A0620 in outburst was 50 Crab (Esin et al., 2000), which translates to 81037 erg s-1 at the appropriate distance (1.050.40 kpc; Shahbaz et al., 1994). Applying the 75 day optical decay time to the peak optical magnitude (; Liu et al., 2001), A0620 was three weeks after peak. Assuming an extinction of (Liu et al., 2001), MV=0.20.9 at that time. The orbital period prediction from these values is 0.8 days, which is consistent with the known period of 0.3 days (Liu et al., 2001). Similar results are seen when the correlation is applied to other classical systems, including, for example, 4U 1543-47 (Williams et al., 2005a). The predicted period range is therefore reliable for classical XRNe even if the optical observation is 3 weeks after the X-ray observation.
In addition, the correlation even holds for several more recent X-ray transient sources that have exhibited complex light curves, such as GRO J1655-40 and XTE 1550-564 (Williams et al., 2005a). We tested the effects of the 3 week interval between the X-ray and optical observations of r2-71 on our period prediction using the complicated optical and X-ray lightcurves of the recent XRN XTE J1550-564. Inspection of the lightcurves of Jain et al. (2001) suggests that if we observed XTE J1550-564 8 days after its X-ray peak, when its X-ray luminosity was 41037 erg s-1 (for a distance of 5.32.3 kpc; Orosz et al., 2002), and then observed the location in the optical 3 weeks later, we would have seen the counterpart at . Applying an extinction of (Orosz et al., 2002) implies M. Putting these numbers into the empirical correlation provides a period prediction of days. If we were fortunate enough to catch the brightest X-ray flare, with a flux of 1.610-7 erg cm-2 s-1 (Sobczak et al., 2000), the source luminosity would have been L1038 erg s-1. In this case, we would have measured three weeks later (Jain et al., 1999), 0.9 mag fainter than the peak of (Liu et al., 2001). The later optical measurement would have yielded M and a period prediction of days. The actual period of XTE J1550-564 is 1.55 days (Orosz et al., 2002), within the predicted range.
Succinctly, the HST data show that r2-71 is not an HMXB, and therefore may be an LMXB. The van Paradijs & McClintock (1994) correlation provides reliable orbital period range predictions for such objects even when the observations are separated by 3 weeks and the relation is applied to a complex transient lightcurve. We therefore apply the correlation to our measurements of r2-71 under the assumption that, as in the above Galactic examples, the errors in absolute magnitude and in the correlation are sufficient to account for complications in the lightcurve and the 3-week gap between X-ray and optical observations. We note that these predictions rely on the assumption that r2-71 behaves in a similar way to many Galactic XRNe.
Our -band brightness upper-limit of , from our completeness results, can be converted to a -band luminosity by assuming the same foreground extinction we assumed for the X-ray spectral fit and converting to optical extinction using the relation of Predehl & Schmitt (1995). Assuming , M. Then using the mean colors of Galactic LMXBs in the Liu et al. (2001) catalog (-0.09 +/- 0.14), M. Placing this upper-limit on the optical luminosity and our 0.3–7 keV X-ray luminosity of 3.9 erg s-1 into the van Paradijs & McClintock (1994) correlation, including their quoted errors, we obtain a prediction for the period of the LMXB system r2-71 of days.
5 Conclusions
We have constrained the X-ray and optical properties of a repeating X-ray transient source in the M31 bulge, which we have named CXOM31 J004233.4+411703 or r2-71. This source has undergone at least two X-ray outbursts brighter than 1037 erg s-1 in the past two decades. Previous X-ray observations reveal that the source has varied by at least a factor of 100 in X-ray luminosity, and our Chandra monitoring program shows that the outburst in May of 2004 had an -folding decay time of less than a month. The observed activity of the source from 1979 to the present suggests that it has a duty cycle of 0.04.
Optical observations of the location of r2-71 with ACS before, during, and after the X-ray outburst show no clear optical counterpart to this transient X-ray event in the M31 bulge. The stellar content of the region rules out the presence of an HMXB transient system at the location of r2-71. We therefore assume r2-71 is an LMXB system. No reliable variability was detected in the r2-71 error circle, so that we did not detect the optical counterpart of the XRN. A difference image of the region confirms the lack of significant variability. The optical data therefore place an upper-limit on the -band brightness of the outburst of . The corresponding upper-limit on the -band luminosity along with the X-ray luminosity measured from the Chandra spectrum provide a prediction of 1.6 days for the orbital period of the LMXB system.
Support for this work was provided by NASA through grant number GO-9087 from the Space Telescope Science Institute and through grant number GO-3103X from the Chandra X-Ray Center. MRG acknowledges support from NASA LTSA grant NAG5-10889. SSM acknowledges the support of the HRC contract NAS8-03060. JEM acknowledges the support of NASA grant NNG0-5GB31G.
References
- Chen et al. (1997) Chen, W., Shrader, C. R., & Livio, M. 1997, ApJ, 491, 312
- Di Stefano et al. (2004) Di Stefano, R., et al. 2004, ApJ, 610, 247
- Esin et al. (2000) Esin, A. A., Kuulkers, E., McClintock, J. E., & Narayan, R. 2000, ApJ, 532, 1069
- Jain et al. (2001) Jain, R. K., Bailyn, C. D., Orosz, J. A., McClintock, J. E., & Remillard, R. A. 2001, ApJ, 554, L181
- Jain et al. (1999) Jain, R. K., Bailyn, C. D., Orosz, J. A., Remillard, R. A., & McClintock, J. E. 1999, ApJ, 517, L131
- Kong et al. (2002) Kong, A. K. H., Garcia, M. R., Primini, F. A., Murray, S. S., Di Stefano, R., & McClintock, J. E. 2002, ApJ, 577, 738
- Liu et al. (2001) Liu, Q. Z., van Paradijs, J., & van den Heuvel, E. P. J. 2001, A&A, 368, 1021
- Massey et al. (2001) Massey, P., Hodge, P. W., Holmes, S., Jacoby, G., King, N. L., Olsen, K., Saha, A., & Smith, C. 2001, in American Astronomical Society Meeting, Vol. 199, 13005
- McClintock & Remillard (2004) McClintock, J. E., & Remillard, R. A. 2004, in Compact Stellar X-ray Sources (astro-ph/0306213)
- Orosz et al. (2002) Orosz, J. A., et al. 2002, ApJ, 568, 845
- Predehl & Schmitt (1995) Predehl, P., & Schmitt, J. H. M. M. 1995, A&A, 293, 889
- Primini et al. (1993) Primini, F. A., Forman, W., & Jones, C. 1993, ApJ, 410, 615
- Shahbaz et al. (1994) Shahbaz, T., Naylor, T., & Charles, P. A. 1994, MNRAS, 268, 756
- Sobczak et al. (2000) Sobczak, G. J., McClintock, J. E., Remillard, R. A., Cui, W., Levine, A. M., Morgan, E. H., Orosz, J. A., & Bailyn, C. D. 2000, ApJ, 544, 993
- Stetson et al. (1990) Stetson, P. B., Davis, L. E., & Crabtree, D. R. 1990, in ASP Conf. Ser. 8: CCDs in astronomy, 289
- Supper et al. (2001) Supper, R., Hasinger, G., Lewin, W. H. G., Magnier, E. A., van Paradijs, J., Pietsch, W., Read, A. M., & Trümper, J. 2001, A&A, 373, 63
- Supper et al. (1997) Supper, R., Hasinger, G., Pietsch, W., Truemper, J., Jain, A., Magnier, E. A., Lewin, W. H. G., & van Paradijs, J. 1997, A&A, 317, 328
- Trinchieri & Fabbiano (1991) Trinchieri, G., & Fabbiano, G. 1991, ApJ, 382, 82
- van Paradijs & McClintock (1994) van Paradijs, J., & McClintock, J. E. 1994, A&A, 290, 133
- Williams (2003) Williams, B. F. 2003, AJ, 126, 1312
- Williams et al. (2004) Williams, B. F., Garcia, M. R., Kong, A. K. H., Primini, F. A., King, A. R., Di Stefano, R., & Murray, S. S. 2004, ApJ, 609, 735
- Williams et al. (2005a) Williams, B. F., Garcia, M. R., Kong, A. K. H., Primini, F. A., & Murray, S. S. 2005a, ApJ, accepted
- Williams et al. (2005b) Williams, B. F., Garcia, M. R., McClintock, J. E., Primini, F. A., & Murray, S. S. 2005b, ApJ, submitted