The optical counterpart of XTE J0929–314, the third transient millisecond X-ray pulsar
Abstract
A blue and variable optical counterpart of the X-ray transient XTE J0929–314 was identified on 2002 May 1. We conducted frequent BVRI broadband photometry on this object using the Mt Canopus 1-m telescope during May and June until it had faded to below 21’st magnitude. Nearly continuous I band CCD photometry on 2002 May 2, 3 & 4 revealed a 10 per cent sinusoidal modulation at the binary period lasting 6 cycles during the latter half of May 2. The phase indicates that the modulation may be due to a combination of emission by a hot spot on the disc and X-ray heating of the secondary. The emission generally trended bluer with B-I decreasing by 0.6 magnitudes during the observations but there were anomalous changes in colour during the first few days after optical identification when the I band flux decreased slightly while fluxes in other bands increased. Spectral analysis of the BVRI broadband photometry show evidence of a variable excess in the R & I bands. We suggest that this may be due to synchrotron emission in matter flowing out of the system and note that similar processes may have been responsible for anomalous V & I band measurements in 1998 of the persistent millisecond X-ray pulsar SAX J1808.4–3658.
keywords:
binaries close – pulsars general – pulsars individual XTE J0929–314 – stars low-mass – stars neutron – X-rays binaries1 Introduction
X-ray heating of three regions is generally believed to contribute to optical variability in low mass X-ray binary (LMXB) systems. These are the accretion disc, a bright spot on the outer edge of the accretion disc due to inflowing material and the hemisphere of the companion facing the neutron star. In most LMXBs the reprocessed X-ray optical flux dominates the optical light from the rest of the system (van Paradijs 1983, van Paradijs & McClintock 1995), particularly in the outburst phase. The companion itself may only be evident at a very faint level when the system is in quiescence. More recently it has become apparent that synchrotron emission from matter flowing out of the system via bipolar jets makes a highly variable contribution to radio and IR emission from many different classes of X-ray binaries (Fender 2003). In some cases this emission may extend into the optical region (Hynes et al. 2000). At least one other persistent millisecond X-ray pulsar, SAX J1808.4–3658, is known to have a transient IR excess and radio emission probably due to synchrotron processes (Wang et al. 2001).
On 2002 April 30 an X-ray transient was discovered by Remillard et al. (2002) using the All Sky Monitor (ASM) (Levine et al. 1996) on The Rossi X-ray Timing Explorer RXTE satellite. XTE J0929–314, the subject of this paper, was subsequently found to also be a millisecond X-ray pulsar by Remillard, Swank & Strohmayer (2002). Using additional RXTE Proportional Counter Array (PCA) observations Galloway et al. (2002a; 2002b) reported a neutron star spin frequency of 185 Hz, a binary period of 2615-s and an implied companion mass of , about 8.5 Jupiter masses. A blue and variable optical couterpart was suggested by Greenhill, Giles & Hill (2002). This identification was supported by spectra obtained by Castro-Tirado et al. (2002) who found a number of emission lines superimposed on a blue continuum which is typical of soft X-ray transients in outburst. A coincident radio source was also reported by Rupen, Dhawan & Mioduszewski (2002).
XTE J0929–314 was the third transient millisecond X-ray pulsar to be discovered. The first (SAX J1808.4–3658) has been studied extensively at all wavelengths (Giles, Hill & Greenhill 1999; Wang et al. 2001; Homer et al. 2002; Wachter et al. 2000; in ’t Zand et al. 1998; Wijnands et al. 2001; Markwardt, Miller & Wijnands 2002; Wijnands & van der Klis 1998; Chakrabarty & Morgan 1998; Chakrabarty et al. 2003; Wijnands et al. 2003). The V band flux from SAX J1808.4–3658 decayed from mag in 10-d suggesting an e-folding time of 5-6 d.
Of the other four known millisecond X-ray pulsars only two have identified visible counterparts. XTE J1814–338 (Strohmeyer et al. 2003) has been identified by Krauss et al. (2003) but no detailed optical or IR observations are available. The more recent IGR J00291+5934 (Galloway et al. 2005) has a detailed optical light curve (Bikmaev et al. 2005). The R band flux from this object decayed from mag in 30-d giving an e-folding time of d. Study of all these systems is expected to provide important information on the evolutionary path by which a conventional LMXB system might turn into a millisecond radio pulsar.
In this paper we describe the optical variability of XTE J0929–314. The measurements were made in the BVRI bands during a period of 9 weeks following its discovery.
2 Observations
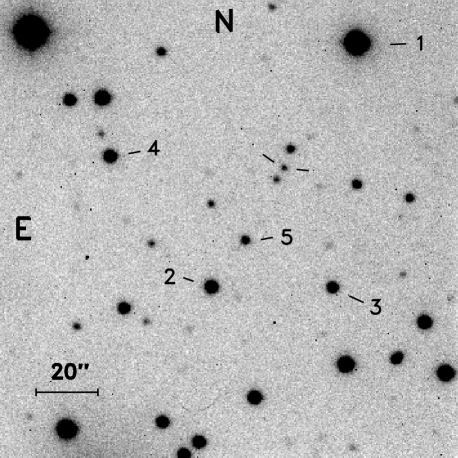
All the observations described in this paper were made using the 1-m telescope at the University of Tasmania Mt. Canopus Observatory. The CCD camera, its operating software (CICADA), the image reduction and analysis tools (MIDAS and DoPHOT) were identical to that described in Giles et al. (1999). The CCD camera contains an SITe chip which is a thinned back illuminated device providing 512 x 512 pixels with an image scale of pixel-1. Cousins standard BVRI filters (Bessell 1990) were used for the observations. The data were calibrated using a sequence of observations of 11 standard stars within the RU149D and PG1047 fields of Landolt (1992) to derive the magnitudes of five local secondary standards close to XTE J0929–314 and within the CCD frame. These local standards are marked as stars 1-5 on the finder chart in Fig. 1 and we tabulate their derived magnitudes in Table 1. The magnitudes for XTE J0929–314 were then obtained using differential photometry relative to these local secondary standards. We did not use the same stars for all colours but used a combination of three of the five as indicated in Table 1. This multi-star process revealed that differential colour corrections are negligible. A few observations were interrupted or terminated early by the arrival of clouds. The complete data set from 2002 May 1 to July 1 [HJD 2452(396) - 2452(457)] is detailed in Tables 2 & 3 and forms the subject of this paper.
| Star No. | B | V | R | I |
|---|---|---|---|---|
| 1 | 15.029 | 14.297 | 13.878 | 13.483 |
| 2 | 17.583 | 16.838 | 16.403 | 16.003 |
| 3 | 18.542 | 17.636 | 17.149 | 16.714 |
| 4 | 18.083 | 17.106 | 16.567 | 16.154 |
| 5 | 19.443 | 18.601 | 18.194 | 17.781 |
| Stars used | 1, 2, 3 | 2, 3, 4 | 2, 3, 5 | 2, 3, 5 |
| Composite error | 0.030 | 0.035 | 0.030 | 0.035 |
Table 2. A journal of the B, V & R band observations. Int. Int. Int. (-2452000) B mag. (s) (-2452000) V mag. (s) (-2452000) R mag. (s) 395.92676 19.18(4) 300 396.03104 19.32(3) 600 398.98608 19.07(4) 600 395.92676 19.18(4) 300 399.00464 19.04(3) 600 405.02222 18.94(4) 1200 395.94162 19.17(4) 120 404.96179 18.71(2) 1200 405.88013 18.83(2) 1200 395.99146 19.07(9) 120 405.86371 18.68(1) 900 405.98022 18.87(2) 1200 395.99707 19.05(8) 120 405.89260 18.67(1) 900 407.94819 18.93(3) 600 396.02051 19.15(6) 300 405.99594 18.70(2) 900 407.95190 18.93(3) 600 398.99536 18.88(3) 600 406.84912 18.63(5) 600 409.04370 19.11(4) 600 405.90308 18.45(1) 900 406.85823 18.63(3) 600 409.06494 19.05(4) 600 406.00757 18.50(3) 900 406.86554 18.69(3) 600 409.87354 19.16(3) 900 407.96997 18.50(2) 600 406.87273 18.66(4) 600 413.85767 19.07(4) 729 409.03638 18.58(2) 600 406.88182 18.64(4) 900 425.97276 19.82(9) 1200 413.88916 18.76(2) 900 406.89266 18.69(3) 900 426.87783 19.73(6) 1200 426.91064 19.47(4) 1200 406.94484 18.67(2) 900 431.92334 19.82(5) 1200 431.93872 19.60(4) 1200 406.95277 18.71(2) 424 456.88272 22.21(86) 300 456.86987 21.38(41) 300 406.96392 18.67(2) 900 456.91085 22.19(119) 300 407.94437 18.74(2) 600 409.02885 18.92(2) 600 409.97841 18.87(6) 600 413.00105 18.80(6) 900 413.86740 19.00(6) 446 413.87759 18.97(3) 900 426.89536 19.62(5) 1200 431.90887 19.91(5) 1200 456.87879 22.89(137) 300 456.91490 22.19(121) 300
a Times of mid integration. Some integrations terminated early.
Table 3. A journal of the I band observations.
Int.
Int.
(-2452000)
I mag.
(s)
(-2452000)
I mag.
(s)
396.08301
18.78(7)
600
408.85669
18.34(3)
600
396.09229
18.66(7)
600
408.87915
18.34(3)
600
396.09961
18.77(8)
600
408.89258
18.35(2)
600
396.10718
18.86(10)
600
409.02100
18.36(3)
600
396.97188
409.04932
18.40(20)
300
397.99811
409.05762
18.43(5)
600
398.96029
409.86133
18.54(4)
600
404.90161
18.22(3)
900
412.88794
18.52(6)
900
404.94751
18.18(3)
900
412.90015
18.44(5)
1200
404.97412
18.20(3)
900
412.93945
18.38(4)
1200
404.98730
18.23(3)
900
412.95410
18.38(3)
903
404.99805
18.20(3)
900
412.96509
18.35(3)
900
405.00879
18.26(3)
900
412.97876
18.39(3)
900
405.91406
18.17(2)
600
412.98999
18.32(4)
900
405.92236
18.09(3)
600
413.84814
18.54(3)
900
405.93091
18.07(3)
600
413.90015
18.54(2)
900
405.93921
18.16(2)
600
413.93921
18.53(3)
900
405.94678
18.17(2)
600
413.97998
18.51(3)
900
405.95386
18.18(2)
600
414.02148
18.47(3)
900
405.96143
18.24(3)
600
414.06055
18.53(4)
900
405.96899
18.18(3)
600
425.95044
19.35(12)
600
406.01758
18.29(7)
600
425.96143
19.66(13)
600
407.06348
18.21(4)
900
425.98877
19.61(11)
1200
407.07397
18.18(6)
900
426.86182
19.69(9)
1200
407.08496
18.16(4)
900
426.98071
19.53(9)
1200
407.92944
18.18(3)
600
431.89160
19.56(6)
1200
407.97754
18.32(4)
600
431.96948
19.78(10)
1200
408.02051
18.21(4)
600
431.98413
19.59(11)
1200
408.06104
18.14(4)
600
456.87491
20.79(45)
300
408.07007
18.18(4)
900
456.90527
20.84(63)
300
a Times of mid integration. Some integrations terminated early.
b Average magnitude and mid time for entire nights data.
3 Results
3.1 Source position
To determine the source position we selected the nearest 9 stars to the candidate from the Hubble Guide Star Catalogue 2.2 downloaded from the NASA HEASARC web site. We used the CCD coordinates of these stars and the proposed candidate on the best quality I band image from May 2 (HJD 397) to derive an accurate source position for XTE J0929–314 of R.A. 9h 29m 20 Dec. with a relative error of (equinox J2000.0). This is 0 from our initial position estimate in Greenhill et al. 2002 and only 0 away from the radio position given by Rupen et al. (2002). Chandra observations confirmed that the X-ray source was 1 from our optical position (Juett, Galloway & Chakrabarty 2003). We note that this difference is twice their quoted error.
In Fig. 1 we provide a finder chart for XTE J0929–314 constructed from an I band CCD image from May 2. The object is the central star in a line of three and for the first few weeks was seen to be of similar brightness to its two neighbours.
3.2 The X-ray light curve
XTE J0929–314 is one of the faintest transients to be found by the ASM experiment on RXTE and this detection was only possible due to its angular distance from the Galactic Centre region which minimises bright source confusion and consequent positional uncertainties. Our optical candidate was only from the X-ray position of Remillard et al. (2002). The transient was discovered near the time of peak X-ray flux, towards the end of April. It was then observed periodically with the PCA experiment on RXTE [obs id 70096-03-(**-**)] as part of a proprietary TOO campaign (Galloway et al. 2002b; Juett et al 2003). In the top panel of Fig. 2 we show the ASM intensity history for this transient up to just past the time when regular PCA observations commenced. Note that there is a single early PCA observation at HJD 397.0. The ASM points are plotted as daily averages since the data for individual dwell cycles are too noisy for such a relatively faint source. The 38 PCA values are averages over individual PCA observation id’s which typically last 1000-4000 seconds. The two X-ray light curves in Fig 2. are similar to fig. 1 in Galloway et al. (2002b) except that both vertical axes are now drawn with ’X-ray magnitude’ scales. The final three PCA observations are not plotted since only upper limit detections exist after HJD 445.0.

3.3 The optical light curves
In Fig. 2 we plot our sets of BVRI band data from Tables 2 & 3. The tight clusters of I data on May 2, 3 & 4 (HJD 397, 398 & 399) are shown in greater detail in Fig. 4. There is evidence of variability in the range 0.05 to 0.1 magnitudes on a timescale of hours during several nights when long runs of I band measurements were made. Greenhill et al (2002) reported variability of up to magnitudes on the first night (HJD 396) of our observations. Preliminary analysis suggested that a short duration (timescale minutes) magnitude flare occurred in V on this night. Subsequently we became aware of water vapour condensation on the filter during this ”event” and we are now doubtful of the reality of the flaring. In the following section we describe evidence for a low amplitude orbital period modulation seen in the I band flux at about HJD 397. It is of interest to note that no significant variations were seen in X-rays during the RXTE PCA observations (Galloway et al. 2002b). The upper limit to the orbital period modulation of the 2-10 keV X-ray flux was per cent (3) (Juett et al. 2003).
In Fig. 3 we plot the mean B-V and V-I colour indices for the nights when these three colours were measured. In order to minimise the effects of source variability the colour indices for each night are derived from one or more measurements in the different colours taken within a time interval of 1 hour. The overall trend was for the spectrum to become hotter (more blue) over the principal five weeks of observation. This suggests, assuming that most of the light comes from an accretion disc, a trend towards increasing disc temperature as the accreting matter diffuses inwards. There was also a brief decrease in B-V & V-I (increase in colour temperature) between 2002 May 1 and May 4 (HJD 396 - 399), followed by a recovery to the overall trend line. This can be seen in Fig. 2 where, for the first few days following optical identification, the I band flux decreased slightly while fluxes in the other bands increased.

The light curves in BVRI are approximately triangular in profile, on a linear scale, and similar to, but delayed by, 13 days relative to the X-ray light curve. During the time interval May 1 to May 11 (HJD 396 - 406) the BVRI fluxes increased by per cent while the X-ray flux decreased by per cent. We can think of no physical process whereby X-ray emission can lead optical emission by 13 days. In SAX J1808.4–3658, the optical decline preceded the X-ray by (Giles et al. 1999). Since we have no information on the optical flux during April we conclude that the apparent similarity between the optical and X-ray light curves is coincidental. The optical decay evident in the centre panel of Fig. 2 has an e-folding time of d. This appears to be qualitatively different to that for SAX J1808.4–3658 and IGR J00291+5934
3.4 Search for binary modulation
On the nights of May 2, 3 & 4 (HJD 397, 398 & 399) we monitored the object at I continuously in an attempt to observe an orbital period modulation. These data are plotted in Fig. 4. In mid-May Galloway et al. (2002a) detected a 2614.75(15) s orbital period modulation of the X-ray pulsation frequency. No amplitude modulation of the X-ray flux was detected. Their orbit ephemeris placed the neutron star on the far side of the companion at 2002 May 11.4941(2) UT (HJD 405.9941). The solid sine curves in the lower part of each panel in Fig. 4 represent the modulation (arbitrary amplitude) expected from X-ray heating of the companion star as in SAX J1808.4–3658 (see fig. 1 in Giles et al. 1999 and fig. 2 in Homer et al. 2002). In Fig. 4 we also show the light curves for a nearby ’constant’ comparison star ( to the NNW in Fig. 1, I mag 17.11) which has been shifted by an arbitary amount. This star does not show the modulation evident for XTE J0929–314 in the top panel. All three observing runs terminated close to the telescope elevation limit but the source exhibits significant variability which is not apparent for the plotted comparison star or for others not shown here.

The light curve for the last four hours of the night of May 2 (HJD 397) shows clear indications of modulation at or near the orbital period together with slow changes in the average magnitude. We corrected the data commencing from HJD 396.92 (h UT) for these slow changes using a second order polynomial and used the Q method (Warner & Robinson, 1972) to search the de-trended data for periodicity in the range 0.01 to 0.05 days. There is a strong single peak corresponding to a period of days. This is consistent with the orbital period of 0.030263 days discovered by Galloway et al. (2002b).

In Fig. 5. we plot the corrected light curve folded at the X-ray period and ephemeris where phase zero is defined as the time when the companion is at its greatest distance from the observer i.e. it lies beyond the neutron star. The vertical error bars are those generated by the DoPHOT photometry which appear to be slightly over-estimated. To clarify this we repeated the phase folding process for the nearby comparison star, using the same X-ray ephemeris, so that the real scatter for a ’constant’ source can be seen. These points are plotted in the lower part of Fig. 5 and have a slightly different offset to that used in Fig. 4. The formal DoPHOT average error for these 22 points is 0.021 mag but they have a scatter of only 0.017 mag so the XTE J0929–314 error bars in Figs. 4 & 5 are probably 20 per cent too large.
The modulation is approximately sinusoidal with amplitude magnitudes peak to peak and maximum at phase . Hence the modulation is unlikely to be due to X-ray heating of the companion as this would have maximum light at phase zero. In this respect XTE J0929–314 differs from SAX J1808.4–3658 in which the orbital period optical modulation had a maximum at phase zero (Giles et al., 1999). Nor is it likely that the modulation is due to emission from a hot spot on the disc since this would have a maximum at a phase between . Perhaps both processes contribute.
The first PCA X-ray observation (obs. 01-00) occurred during the time we detected an orbital period modulation on the night of 2002 May 2 (HJD 397) and its duration is shown in the top panel of Fig. 4. However, this observation consists of crossed slews to determine the X-ray source position and is thus not suitable for modulation analysis. As noted earlier, no X-ray amplitude modulation was reported in any of the many following RXTE PCA observations (Juett et al. 2003).
3.5 Spectral changes
There are many occasions within Tables 2 & 3 where we have BVRI values on the same night but some caution is required in combining these into broadband spectra due to the variability detected on several nights. In most instances the different colour averages for each night are derived from one or more measurements taken in a time interval of 1 hour. It should be clearly noted that the central wavelength and bandwidth for the R & I filters differs between the Cousins and older Johnston systems and this can affect the apparent spectral shape. Here we use the Cousins R & I parameters. In Fig. 6 we plot the broadband BVRI spectra from 8 nights, 2002 May 1, 4, 11, 13, 14, 19 & June 1, 7 (HJD 396, 399, 406, 408, 409, 414, 427 & 432).

Also shown is a curve representing a power law approximation to the emission from an optically thick, X-ray heated disc. The distribution is given by the equation where is the reddened flux at wavelength and is the wavelength dependent reddening correction toward the source. The amplitude is arbitrary and the spectrum is reddened assuming interstellar extinction . This value is scaled from the estimated value for SAX J1808.4–3658 (Wang et al., 2001) using the integrated column densities, for SAX J1808.4–3658 (Gilfanov et al., 1998) and for XTE J0929–314 (Juett et al., 2003). A similar value for is obtained by using the relationship between and given by Predehl & Schmitt (1995).
We have no information on the flux in B for the first night (HJD 396) but it is clear that the spectrum was heavily reddened on that occasion. On subsequent nights the spectra were generally steeper and had an approximately power law distribution. There was, however, a highly variable red excess above the power law. The excesses are not sensitive to the assumed value of . On HJD 399 the excess was near zero (similar to the canonical disc power law distribution) and, as noted in section 3.3, the spectrum was anomalously blue. On HJD 409 (and possibly HJD 432 although with less statistical significance) the R band was strongly enhanced consistent with strong Balmer line () emission. Balmer emission cannot however account for the variable excesses in I. Measurements errors were relatively large for the last two nights in Fig. 6 (HJD 427 and 432) but it is clear that the red excess had disappeared and that the spectra were steeper (bluer) than during earlier observations.
4 Discussion
Several features distinguish XTE J0929–314 from SAX J1808.4–3658. Firstly, the maximum of the orbital period modulation occurs at phase rather than at phase zero. This points to an origin of X-ray heating in SAX J1808.4–3658 but the situation is more complex in XTE J0929–314. Galloway et al. (2002b) have shown that the companion in XTE J0929–314 is probably a very low mass () helium white dwarf. The companion in SAX J1808.4–3658 is believed to be a brown dwarf (Bildsten & Chakrabarty, 2001). The Roche lobe radii of the companion stars will therefore differ by almost an order of magnitude substantially reducing the X-ray radiation reprocessed by the companion in XTE J0929–314. We have estimated the amplitude of optical modulation due to heating of the companion star in XTE J0929–314 using the relation where is the optical modulation observed for SAX J1808.4–3658 (Giles et al, 1999), is the ratio of the X-ray fluxes (Gilfanov et al., 1998, Juett et al., 2003), is the ratio of distances between the neutron stars and their companions and is the ratio of the Roche Lobe radii for the two systems. The estimated orbital modulation is per cent of that observed suggesting that, if it is generated thermally, much of the emission comes from a hot spot on the disc. This provides an explanation for the observed maximum phase which lies mid-way between that expected from heating of the companion and from hot spot emission.
Turning to the spectral characteristics the broadband spectra from SAX J1808.4–3658 are well fitted by smoothly varying functions derived from a thermal disc model (Wang et al., 2001). However, there are signifiant, time dependent, R & I band excesses in our XTE J0929–314 spectra. Nothing like this has been reported for SAX J1808.4–3658 although Wang et al. (2001) reported a strong near IR JHK excess on one occasion and this may well have extended to optical wavelengths. We have insufficient information to explain our observed spectral variability. As noted in section 3.5, variable Balmer emission may be responsible for the R band excesses but cannot contribute to the excesses in I. The remarkable changes in the red excesses between HJD 396 and 399 and between HJD 409 and 414 might perhaps be due to diffusion inwards of cool matter from a brief enhancement of mass transfer onto the disc from the companion star. Alternatively, the red excesses may be due to transient synchrotron emission from matter flowing out of the system via bipolar jets. The synchrotron spectrum is cut off at wavelengths shorter than R.
As noted in section 1, many different classes of X-ray binaries emit synchrotron radiation (Fender 2003). Rupen et al. (2002) identified a weak ( mJy) 4.86 GHz radio source at the SAX J0929-314 position on 2002 May 3 and 7. Unfortunately there do not appear to have been any IR observations during this outburst. We hypothesise that a rather similar phenomenon may have occurred during the 1998 outburst of the accreting millisecond pulsar SAX J1808.4–3658. Wang et al (2001) noted that the V & I band fluxes measured by the JKT 1-m telescope on 1998 April 18.2 were about 0.2 magnitudes brighter than they were 0.5 days later when measured by the Mt Canopus 1-m telescope. They assumed that the discrepancy was due to calibration uncertainties in the JKT data. There was a clear IR (JHK) excess measured by the UKIRT telescope at 1998 April 18.6 just 0.4 days after the JKT measurements. Wang et al. (2001) proposed a synchrotron origin for this IR excess. We suggest that the synchrotron excess was also present at the time of the JKT measurements and that it extended into the optical bands. It had disappeared at the time of the Mt Canopus measurements a few hours later.
5 Conclusions
The optical counterpart of XTE J0929–314 was variable on all timescales down to a few hours during the 2002 May observations. On one occasion lasting hours the I band flux was modulated at the orbital period with amplitude magnitudes. No variability was apparent in the X-ray measurements (Galloway et al, 2002b). The peak of the orbital modulation occurs at a phase of relative to the X-ray ephemeris and appears to rule out X-ray heating of the companion as the source of the modulation unless it is combined with emission from a hot spot on the disc.
Broad band BVRI spectra taken on 8 nights have an approximately power law distribution as expected for an optically thick accretion disc but with variable excesses in R & I. Overall these excesses declined and the spectra steepened (became bluer) during the period of the observations. While variable emission may be responsible for some of the excess in R, another explanantion is required for the I band enhancements. We suggest they may be due to emission from cool matter in the outer part of the disc following a transient episode of mass transfer from the companion. Alternatively, variable synchrotron emission, cut off at R band wavelengths, contributes to the emission spectrum.
There is a clear need for fast follow-up optical, IR and radio observations of millisecond X-ray pulsars. These should include polarimetry and high time resolution optical and near IR photometry to test the synchrotron emission hypothesis. The feasibility of high speed photometry at the pulsar spin frequency might also be investigated. Facilities for immediate data reduction and generation of light curves are essential in order to optimise observing strategies for these highly variable objects.
6 Acknowledgements
We thank Ron Remillard for timely information on the occurrence of this transient and Duncan Galloway for providing PCA data. This research has made use of data obtained through the High Energy Astrophysics Science Archive Research Center Online Service, provided by the NASA / Goddard Space Flight Center. We thank Don Melrose, Mark Walker and the referee for helpful comments and gratefully acknowledge financial support for the Mt Canopus Observatory by Mr David Warren. ABG thanks the University of Tasmania Antarctic CRC for the use of computer facilities.
References
- [1] Bessell M.S., 1990, PASP, 102, 1181
- [2] Bikmaev I. et al., 2005, ATEL 395
- [3] Bildsten L., Chakrabarty D., 2001, ApJ, 557, 292
- [4] Castro-Tirado A.J. et al., 2002, IAU Circ. 7895
- [5] Chakrabarty D., Morgan E.H., 1998, Nature, 394, 346
- [6] Chakrabarty D., Morgan E.H., Muno M.P., Galloway D.K., Wijnands R., van der Klis M., Markwardt C.B., 2003, Nature, 424, 42
- [7] Fender R.P., 2003, in Fender R.P., Macquart J-P., eds, Circular Polarisation from Relativistic Jet Sources, Ap&SS, 288, 79
- [8] Galloway D.K., Morgan, E.H., Remillard R.A., Chakrabarty D., 2002a, IAU Circ. 7900
- [9] Galloway D.K., Chakrabarty D., Morgan, E.H., Remillard R.A., 2002b, ApJ, 576, L137
- [10] Galloway D.K., Markwardt C.B., Morgan E.H., Chakrabarty D., Strohmayer T.E., 2005, submitted ApJ, (astro-ph/0501064)
- [11] Giles A.B., Hill K.M., Greenhill J.G., 1999, MNRAS, 304, 47
- [12] Gilfanov M., Revnivtsev M., Sunyaev R., Churazov E., 1998, A&A, 338, L83
- [13] Greenhill J.G., Giles A.B., Hill K.M., 2002, IAU Circ. 7889
- [14] Homer L., Charles P.A., Chakrabarty G., van Zyl L., 2002, MNRAS, 325, 147
- [15] Hynes R.I., Mauche C.W., Haswell C.A., Shrader C.A., Cui W., Chaty S., 2000, ApJ, 539, L37
- [16] in ’t Zand J.J.M., Heise J., Muller J.M., Bazzano A., Cocchi M., Natalucci I., Ubertini P., 1998, A&A, 331, L25
- [17] Juett A.M., Galloway D.K., Chakrabarty D., 2003, ApJ, 587, 754
- [18] Krauss M.I., Dullighan A., Chakrabarty D., van Kerkwijk M.H., Markwardt C.B., 2003, IAU Circ. 8154
- [19] Landolt A.U., 1992, ApJ, 104, 340
- [20] Levine A.M., Bradt H., Cui W., Jernigan J.G., Morgan E.H., Remillard R., Shirey R. E., Smith D.A., 1996, ApJ, 469, L33
- [21] Markwardt C.B., Miller J.M., Wijnands, R., 2002, IAU Circ. 7993
- [22] Predehl P., Schmitt J. H. M. M., 1995, A&A 293, 889
- [23] Remillard R.A. et al., 2002, IAU Circ. 7888
- [24] Remillard R.A., Swank, J., Strohmayer T., 2002, IAU Circ. 7893
- [25] Rupen M.P., Dhawan, V., Mioduszewski A.J., 2002, IAU Circ. 7893
- [26] Strohmayer T.E., Markwardt C.B., Swank J.H., in’t Zand J., 2003, ApJ, 596, L67
- [27] van Paradijs J.,1983, in Lewan W.H.G., van den Heuvel E.P.J., eds, Accretion-driven Stellar X-ray Sources, Cambridge University Press, Cambridge, p. 191
- [28] van Paradijs J., McClintock J.E., 1995, in Lewan W.H.G., van Paradijs J., van den Heuvel E.P.J., eds, X-ray Binaries. Cambridge University Press, Cambridge, p. 58
- [29] Wachter S., Hoard D.W., Bailyn C., Jain R., Kaaret P., Corbel S., Wijnands R., 2000, HEAD, 32, 24.15
- [30] Wang Z. et al., 2001, ApJ, 563, L61
- [31] Warner B., Robinson E.L., 1972, MNRAS, 159, 101
- [32] Wijnands R., van der Klis M., 1998, Nature, 394, 344
- [33] Wijnands R., Méndez M., Markwardt C., van der Klis M., Chakrabarty D., Morgan E., 2001, ApJ, 560, 892
- [34] Wijnands R., van der Klis M., Homan J., Chakrabarty D., Markwardt C.B., Morgan E.H., 2003, Nature, 424, 44