Exploring Terrestrial Planet Formation in the TW Hydrae Association
Abstract
Spitzer Space Telescope infrared measurements are presented for 24 members of the TW Hydrae association (TWA). High signal-to-noise 24 m photometry is presented for all of these stars, including 20 stars that were not detected by IRAS. Among these 20 stars, only a single object, TWA 7, shows excess emission at 24 m and at the level of only 40% above the star’s photosphere. TWA 7 also exhibits a strong 70 m excess that is a factor of 40 brighter than the stellar photosphere at this wavelength. At 70 m, an excess of similar magnitude is detected for TWA 13, though no 24 m excess was detected for this binary. For the 18 stars that failed to show measurable IR excesses, the sensitivity of the current 70 m observations does not rule out substantial cool excesses at levels 10–40 above their stellar continua. Measurements of two T Tauri stars, TW Hya and Hen 6-300, confirm that their spectacular IR spectral energy distributions (SEDs) do not turn over even by 160 m, consistent with the expectation for their active accretion disks. In contrast, the Spitzer data for the luminous planetary debris systems in the TWA, HD 98800B and HR 4796A, are consistent with single-temperature blackbody SEDs and agree with previous IR, sub-millimeter, and millimeter measurements. The major new result of this study is the dramatic bimodal distribution found for the association in the form of excess emission at a wavelength of 24 m, indicating negligible amounts of warm ( K) dust and debris around 20 of 24 stars in this group of very young stars. This bimodal distribution is especially striking given that the four stars in the association with strong IR excesses are brighter at 24 m than their photospheres. Clearly, two terrestrial planetary systems, HD 98800B and HR 4796A, exist in some form. In addition, there are at least two active accreting objects, TW Hya and Hen 6-300, that may still be forming planetesimals. The remaining stars may possess significant amounts of cold dust, as in TWA 7 and TWA 13, that have yet to be found.
Subject headings:
infrared: stars—circumstellar matter—planetary systems: formation1. Introduction
While calibrating the Infrared Astronomical Satellite (IRAS) Aumann et al. (1984) and Gillett (1986) discovered large far-infrared excesses around four nearby stars: Vega, Fomalhaut, Pictoris, and Eridani. Release of the IRAS Point Source Catalog led investigators to many other young, nearby dwarf stars displaying excess emission at mid- and far-IR wavelengths (e.g., Walker & Wolstencroft, 1988; de la Reza et al., 1989; Gregorio-Hetem et al., 1992; Mannings & Barlow, 1998; Zuckerman & Becklin, 1993). As a result, numerous investigations of these objects from the ground have added critical insights concerning circumstellar material (e.g., Jayawardhana et al., 1998; Koerner et al., 1998; Kenyon & Bromley, 2002, 2004). The Hubble Space Telescope (HST) and the Infrared Space Observatory (ISO) (Habing et al., 2001; Spangler et al., 2001; Meyer & Beckwith, 2000, and references therein) have also given us key insights into specific objects, including images taken in the near-IR showing scattered light from thin disks of dust that are shown to absorb starlight and re-emit at much longer wavelengths (e.g., Schneider et al., 1999). Thus, in the last 20 years a body of observations, measurements, analysis and theory have accumulated that leave no doubt about the reality of terrestrial planetary material around young stars. Now, investigations of planetary debris systems (PDSs) are underway with the new tools provided by the Spitzer Space Telescope (Werner et al., 2004).
We have initiated a program using Spitzer to explore a unique and varied sample of late-type stars that are nearby, 40–100 pc, and show one or more indications of young age. Our total sample of over 120 stars has been prioritized into three groups: (1) the first 19 stellar systems identified by common space motion as members of the TW Hydrae association (TWA; Kastner et al., 1997; Webb et al., 1999), (2) 60 stars that show significant lithium absorption indicating young ages, noting that all of the TWA systems easily meet this requirement and therefore overlap this sample, (3) a group of stars with less certain ages based on either detection of X-rays or H in emission.
A combination of special circumstances dictate that we start our exploration with the TW Hydrae association. First, the estimated age of the association ranges from 8–10 million years (Myr) and the ages of these stars are essentially equal (Stauffer, Hartmann, & Barrado y Navascues, 1995). Second, the TWA members are among the closest young stars available. Third, most association members lie in excellent, low-background regions of the sky for far-IR observations. IRAS has already shown that four of the brightest IR excesses known are found in the TWA. Additional important factors are that five of the TWA stars have Hipparcos distances averaging around 50 pc, their spectral types range from A0V to M5V with most objects being of M or late K spectral type, and almost all members show signs of T Tauri activity. TW Hydrae itself has been classified as a classic T Tauri system despite its apparent isolation (Herbig, G. H., 1978; Rucinski & Krautter, 1983). In contrast, and within the same association, the brightest and most dramatic PDS, HD 98800, shows no evidence for current accretion of primordial material onto the star and has served as the most direct proof of ongoing terrestrial planet formation (e.g., Low, Hines, & Schneider, 1999).
2. Observations
Observations of 24 members of the TW Hydrae association were made using Spitzer. These include 14 single stars and binaries that are unresolved at 24 m and five binary systems at least partially resolved by Spitzer at 24 m. The Multi-band Imaging Photometer for Spitzer (MIPS; Rieke et al., 2004) provided measurements or upper limits of the flux densities () at 24 m and 70 m for the entire sample. MIPS 160 m photometry was also obtained for the four IR-excess systems discovered by IRAS (i.e., TW Hya, Hen 3-600, HD 98800B, and HR 4796A). The observations were made between 2004 January 30 and June 21, with each target observed in all of the intended wavelength bands during a single visit by Spitzer. Table 1 lists the stars in the association observed with MIPS along with basic data from previous measurements. Six other systems have been identified as members of the TWA (see e.g., Song et al., 2003; Webb, 2000a) since the final planning of the Spitzer/MIPS observations, but were not included in the target list because of time limitations.
The MIPS data are reduced using the data analysis tool (DAT) of the MIPS instrument team (Gordon et al., 2005). The images are corrected for distortion, registered, and mosaicked to compensate for the movements of the spacecraft and cryogenic scan mirror mechanism (CSMM) within MIPS that are employed to produce a series of spatially dithered images on the three detector arrays. Aperture photometry is then performed on the calibrated, mosaicked images. Table 2 summarizes the MIPS bandpasses, aperture photometry parameters, and the calibration factors adopted for the data reduction. The data have been color corrected using the relevant tables in the Spitzer Observer’s Manual.
The 24 m data were collected using the standard MIPS point source observing template that obtains 14 images of the target at various standard locations on the 128128-pixel Si:As detector array during each cycle of the template. Either 3 s or 10 s integration times and 1–4 complete template cycles were used to ensure high signal-to-noise ratio (S/N) measurements of the targets. Total observation times were estimated for each target so that a S/N10 measurement was achieved at the expected 24 m flux level of the star’s photosphere, and all stars were detected to at least this S/N. Indeed, the median S/N is 160, though the internal photometric calibration is estimated to be 1–2% in this bandpass (e.g., Rieke et al., 2005).
For the aperture photometry of the 24 m data, an aperture 15″ in radius () was typically used along with a sky annulus centered on the aperture and having an inner radius of 63″ and width of 25″. The large sky annulus was chosen to avoid as much flux as reasonable from the Spitzer plus MIPS point spread function (PSF) of the target. A larger aperture (375 radius) was used for four binary TWA systems that are at least partially resolved at 24 m (TWA 8, 9, 13, and 15). The relative brightnesses of individual components of the binaries were estimated by comparing the fluxes measured in 5 apertures centered on the components. For TWA 9 and 13, a third source of 24 m flux fell within the large photometric apertures. The flux from these sources were subtracted and are not included in the values for at 24 m.
Only HD 98800 was bright enough that the core of the PSF saturated even in the minimum observation time allowed at 24 m. In this case, the flux in the saturated core was estimated by measuring the flux in the wings of the PSF. This was done for the entire sample as well. The exercise on the non-saturated stars showed that the 24 m flux in the saturated portion of the PSF for HD 98800 could be recovered to within 5%. After correcting for the saturated core, the 24 m flux density was measured for HD 98800 in the usual manner.
Observations, data reduction, and aperture photometry for the 70 m data are similar to those at 24 m. However, the pixel scale of the 70 m wide-field optical train (10″ pixel-1) dictates that none of the binaries in the TWA can be resolved except for TWA 19. Therefore, we have used a uniform photometry aperture (3-pixel radius) and sky annulus (radius = 4–6 pixels) for the stars observed in the 70 m wide-field mode. The chosen photometry aperture is very large compared to the ″ pointing accuracy of the telescope, eliminating the ambiguity in both the target position on the array and the determination of flux density upper limits for undetected sources.
TW Hya, HD 98800, and HR 4796A were observed in the 70 m narrow-field mode to prevent saturation by these bright IR sources as this optical train halves the pixel scale. For these observations, an 67 aperture was chosen. Instead of an annulus centered on the target to estimate the sky contribution within the photometric aperture, rectangular regions on either side of the target were utilized because of the narrow, 16-pixel width of the usable portion of the detector array.
Because of the degraded sensitivity and higher instrumental noise of the 70 m Ge:Ga detector array relative to pre-launch estimates, it was not practical to obtain measurements accurate enough to detect objects at the expected levels of the TWA photospheres. As a result, the 70 m observations were tailored to detect excesses at flux levels 10 the expected 70 m photospheric flux density with a reasonably high degree of confidence (3–4). Unfortunately, most of the TWA observations occurred before the bias level for the 70 m detector was reduced. During the period before the bias change, the overall noise in the detector was greater and there were more pronounced changes seen in background levels across array modules. Because of these instrumental effects, a conservative criterion of 5 above background was adopted for a detection at 70 m.
All four targets observed at 160 m were detected at a S/N ranging from 6–160 using the standard MIPS photometry observing template. In all cases, an aperture of ″ was used for the photometry. The sky contribution within the photometric aperture was estimated using rectangular regions on either side of the target. As with the 24 m and 70 m data, the 160 m photometry is corrected for the loss in flux caused by the use of apertures of finite size not encompassing the total flux from the PSF. The multiplicative aperture corrections to a hypothetical aperture of infinite extent are listed in Table 2.
The 160 m data were also corrected for the blue filter leak discovered in this bandpass after the launch of Spitzer. This leak allows light at 2 m in wavelength to reach the detector which is sensitive to near-IR radiation. Tests made during flight have shown that the contaminating flux is about 15 the flux received from a star’s photosphere at 160 m assuming a Rayleigh-Jeans law between the near and far-IR. In all four cases in the TWA where 160 m measurements were made, the expected photospheric 160 m flux density is 1% of the measured signal. Given the bright far-IR excesses of these stars, the filter leak corrections are small.
In addition to broad-band photometry, observations of TW Hya and HD 98800 were made using MIPS in its SED mode. These observations were made on JD = 2453395, roughly a year after the MIPS photometry of TW Hya was obtained and about seven months after the photometry of HD 98800. In this observing mode, the CSMM brings light from the telescope to a reflective diffraction grating that also performs the functions of a slit and collimator. The collimated, dispersed light is then focused onto the 70 m detector array. The result is a very low-resolution (-25) first-order spectrum covering a wavelength range of 52–97 m. The slit/grating has a width of two pixels (″) and the dispersion is 1.7 m pixel-1. An unusable portion of the 70 m array restricts the slit length to 7. Also, a dead 48-pixel readout at one end of the slit further reduces the effective length of the slit where the full spectral range can be sampled.
Observations in SED mode involve chopping the CSMM between the target and a region 1–3′ away to sample the background, and using small spacecraft moves to dither the target between two positions along the slit. Data reduction is again handled by the DAT in essentially the same manner as for 70 m broad-band imaging. The result is co-added “on-” and “off-target” images. After the background image has been subtracted from the target, the spectrum is extracted using an extraction aperture of set width (8 pixels). Flux calibration of the TW Hya and HD 98800 spectra was accomplished using a MIPS SED-mode observation of Boo made on JD = 2453196. The 50–100 m continuum of Boo is assumed to be and Jy at the effective wavelength of the 70 m filter bandpass. The observations and spectral extractions of Boo and the two TWA systems were identical and the same DAT calibration files were used for every target.
3. Results
Table 3 summarizes the MIPS photometric results for the TWA. Several stars in the association are known optical variables and we give the epoch of the start of the observations in the second column of the table. The 24 m, 70 m, and 160 m flux densities are given in units of milli-Janskys (mJy; where 1 mJy = erg cm-2 s-1 Hz-1). Uncertainties in the flux densities are the square root of the quadratic sum of the measurement and calibration uncertainties, noting that most relative uncertainties are much lower. Also listed in Table 3 is the S/N of the detections in each MIPS band. Although some of the S/N values are extremely high, the uncertainties quoted for the photometry in all three bandpasses are dominated by uncertainties in the absolute flux calibration of the instrument. These are estimated to be 10% for the 24 m band and 20% for the 70 m and 160 m bandpasses. Upper limits assigned in Table 3 to non-detections at 70 m are at the level of 3 over the noise of the background.
Our primary goal for this observational program is to detect and measure IR excesses in the TWA. This requires that good estimates of be made for the TWA stellar photospheres at the effective wavelengths of the MIPS bandpasses. For all of stars in the sample, stellar photospheres were derived using a grid of Kurucz (Kurucz, 1979) and “NextGen” (Hauschildt, Allard, & Baron, 1999) photospheric models and fitting available optical photometry combined with near-IR flux densities compiled from the Two-Micron All Sky Survey (2MASS) Point Source Catalog. Temperature is a free parameter in the fitting, but in all cases solar metallicity and are assumed. The NextGen models are known to yield better fits to late-type main sequence stars than Kurucz models, and were used for all TWA members except for HR 4796A and TWA 19A, which have much higher effective temperatures than the rest of the sample. The best-fitting model temperatures () of the TWA are listed in Table 1.
3.1. 24 m Excesses
Comparison of the 24 m data for the TWA with the 2MASS -band flux densities of these stars shows that the association can essentially be divided into two populations. Figure 1 plots the 24-to-2.17 m flux density ratio against the flux density in the -band. In all cases, the 2MASS photometry is consistent with the stellar photospheres emitting the near-IR light. The four stars with IR excesses discovered by IRAS are about a factor of 100 brighter at 24 m relative to than the other stars in the sample. In fact, for the stars with flux ratios 0.02, the data are consistent with the 24 m flux being solely from the photosphere. As a guide, a dashed line in Figure 1 marks the limit of (24 m)/ if both bandpasses fall within the Rayleigh-Jeans regime of the stellar continuum. Since the TWA members are typically spectral type K and M, the band falls close to the emission peak of the photosphere. As a result, the stars typically lie above the Rayleigh-Jeans limit in Figure 1.
Figure 2 further explores the empirical relation between the 24 m flux density with the near-IR. The stars with previously known IR excesses or K are omitted from Figure 2, and the flux ratio shown in Figure 1 is now plotted against the temperature of the model stellar photosphere. The majority of the 19 stars plotted form a locus that is offset from the (24 m)/ ratios expected from blackbodies. Spectra derived from the NextGen models generally give a good approximation to the observed flux ratios, although the TWA members have not reached the main sequence. The unweighted average flux ratio with an RMS of only 0.004. The concentration of the points close to the expected values from the NextGen models in Figure 2 suggests that we are seeing no IR excess at 24 m for most of these late-type, young stars. The MIPS photometry is consistent with the 24 m flux emanating from the photosphere for most of the members of the TWA. One example is TWA 6, where the MIPS 24 m measurement supports the contention by Uchida et al. (2004) that the 5–20 m spectrum of this star taken with Spitzer and the Infrared Spectrograph (IRS; Houck et al., 2004) is indeed the spectrum of the photosphere.
Although the NextGen models yield a much better brightness estimate of the photosphere at 24 m than blackbodies in this temperature range, Figure 2 shows that the flux ratio is possibly more dependent on the model temperature than is actually observed. Note, TWA 12, 13B, and 17 fall well below the NextGen curve. These deviations and the intrinsic scatter of the data are intriguing, but the limited number of objects in the sample complicate a detailed investigation of their possible causes, especially considering that only temperature was varied in constructing the models and that the TWA stars are younger than the nominal zero-age main sequence stars described by the NextGen models. In the case of TWA 17, the 24 m flux density is measured to be only mJy and the source is detected at a with MIPS. Therefore, we do not confirm the possible excess at 12 and 18 m reported from ground-based observations by Weinberger et al. (2004).
The measurement of (24 m)/ for TWA 7 suggests that it possesses a 24 m excess that contributes 40% to the total brightness of this system at this wavelength. Except for the four IRAS detections, TWA 7 has a higher flux ratio in Figures 1 and 2 than all of the other TWA members. The next highest ratio belongs to TWA 9B, but its deviation from the expected flux of the photosphere is less than half of that shown by TWA 7, and is no larger than the flux deficits at 24 m measured for TWA 12, 13B, and 17. Since the 2MASS and MIPS measurements are not simultaneous, an alternate explanation for the apparent IR excess in TWA 7 could be the variability of the star which is not uncommon for T Tauri stars, although there are no published data suggesting that this star is variable. Also, the clustering of most measurements around (24 m)/ is a clear demonstration that most stars in the TWA do not, in fact, exhibit significant variability.
3.2. 70 m Excesses
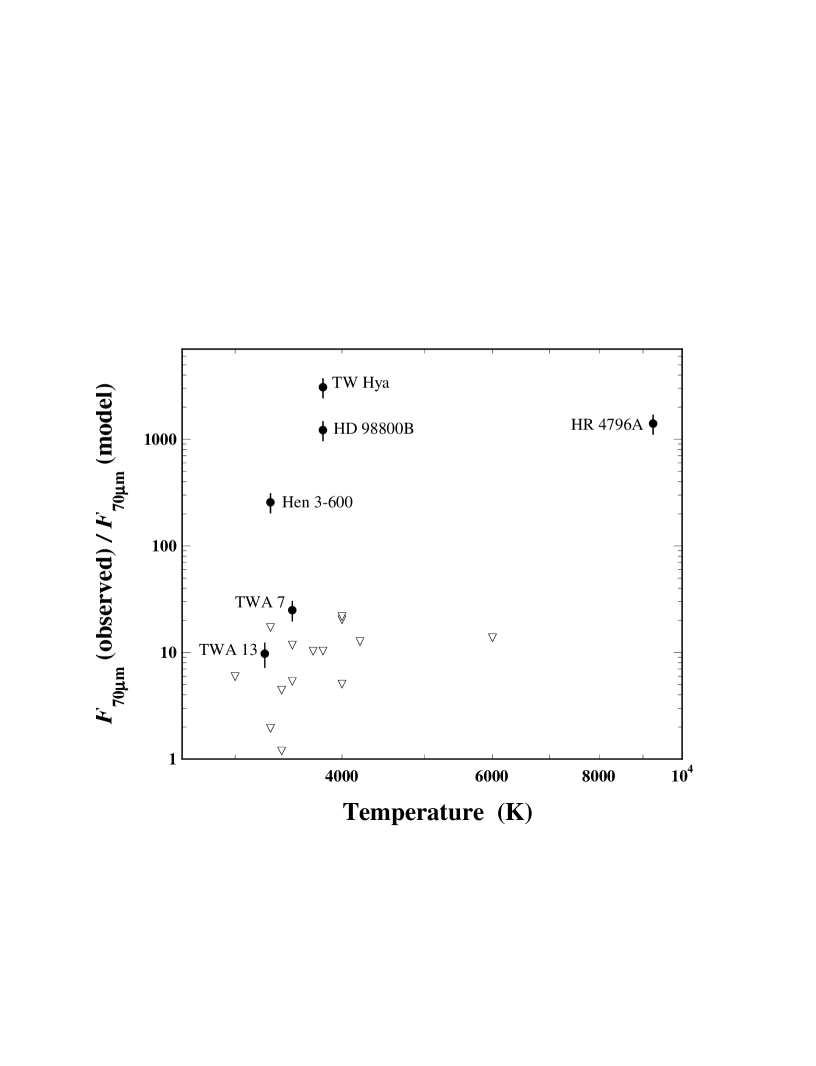
Regardless of the strength of a possible 24 m excess in the observed continuum of TWA 7, this object is detected at 70 m at a flux level 40 brighter than the photospheric emission estimated for the star at this wavelength. Figure 3 presents the ratio between the observed and predicted 70 m flux densities. Only six of the 20 systems (TWA 19 is resolvable at 70 m) are detected with MIPS at 70 m. TWA 13 joins TWA 7 and the four IRAS sources in having a detected 70 m excess. TWA 13 cannot be resolved with Spitzer at 70 m, so it is unknown which of the two components produces the excess, or if both components of the binary contribute to the observed flux.
Figure 3 shows the same basic division in the TWA sample as is found at 24 m. The 70 m excesses for TWA 7 and 13 are 10 fainter than the other detections. One-sigma upper limits are also shown in Figure 3 for the remainder of the sample. As discussed in §2, the sensitivity limits of the 70 m array render detection of the photospheres of the TWA sample impractical. Excesses similar to those of TWA 7 and 13 cannot be ruled out for many members of the association, and it is clear from the data that it is not necessary for an object to show an excess at 24 m to find one at 70 m. For instance, there is no hint from the 24 m measurement of TWA 13 of an excess at longer wavelengths. There are three stars where a 70 m excess at 10 the flux density of the photosphere can be ruled out at the 3 confidence level: TWA 2, 5A, and 8A. Therefore, the minimum range in strength for 70 m excesses in the TWA is greater than a factor of 300.
3.3. Spectral Energy Distributions
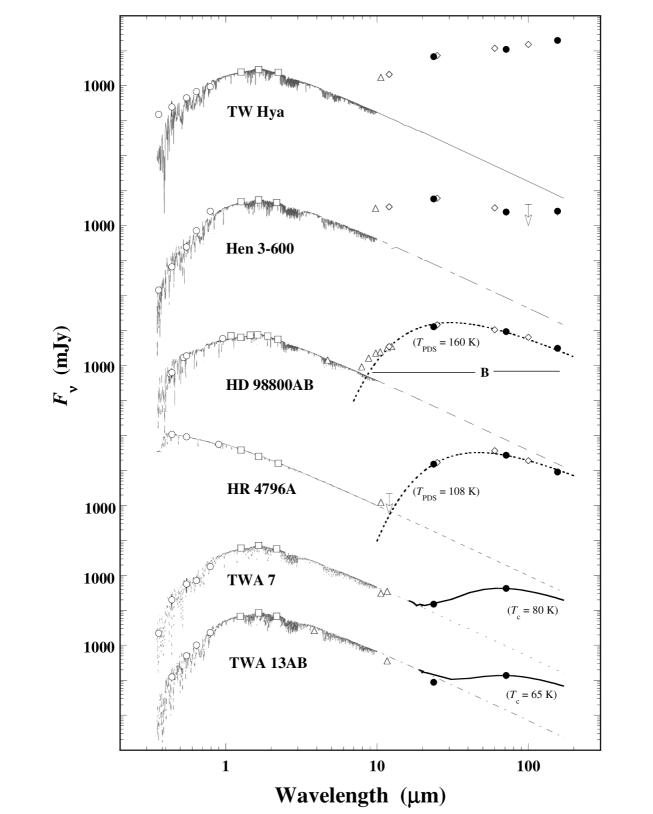
The SEDs of the six systems in the TWA with confirmed IR excesses are shown in Figure 4. It is readily apparent that this small sample of young stars exhibits a rich variety of IR properties. The T Tauri stars TW Hya and Hen 3-600 show no hint of their SEDs turning over even out to 160 m. In fact, the MIPS 160 m measurement for TW Hya reveals that the spectrum of the presumed optically thick accretion disk continues to rise into the infrared. Similar to TW Hya, the MIPS data for Hen 3-600 are consistent with the earlier IRAS results and show that the 70 and 160 m flux densities are roughly equivalent.
In contrast, HD 98800A and B do not show the extreme activity associated with T Tauri stars. However, HD 98800B generates a huge IR excess that is well fit by a single blackbody with -170 K (Low, Hines, & Schneider, 1999; Hines et al., 2004), whereas component A lacks an easily measured excess even though the total luminosities of the two companions are virtually identical. The MIPS photometry is consistent with earlier results. Likewise, the IR excess of HR 4796A produces an IR SED that can be fit by a single blackbody, but it is significantly cooler than found for HD 98800B ( K; Jura et al., 1993). With the addition of the Spitzer observations, we fit this excess with a K blackbody. Given that HR 4796A is an A0V star, it is not surprising that it has an IR excess because of the finding that younger A stars have a higher probability of possessing a 24 m excess and having stronger thermal excess emission than older A stars (Rieke et al., 2005). It is of note that HR 4796A has by far (by 10) the largest ratio of 24 m excess emission-to-photospheric emission of the 265 A and B stars examined by Rieke et al. (2005).
Figure 5 presents the MIPS SED-mode observations of TW Hya and HD 98800B. These low-resolution spectra do not show any spectral features of high equivalent width in either object. Arcturus was used to calibrate the spectra and they are consistent with the 70 m flux densities derived from the photometry. The IR spectral slopes of TW Hya and HD 98800B are quite different, with the continuum of TW Hya being much redder than that of HD 98800B. A power-law having a spectral index, , where , is adequate to describe these data. For TW Hya, , and is consistent with the finding that the 160 m flux density is higher than the 70 m measurement. The slope of a single power-law fit to the continuum of HD 98800B between 52 and 97 m yields . The blackbody fit with K to the PDS of HD 98800B is also shown in Figure 5, and its slope within this spectral region is in good agreement with the SED-mode data.
3.4. PDS Luminosity and Mass
Our primary reason for calculating the stellar and IR excess luminosity is to measure the fractional luminosities of those stars that show direct evidence of PDS formation and to provide well defined upper limits for those stars that fail to show an excess. Table 4 lists the stellar luminosity, , derived by numerical integration, and the fractional luminosity, , where is the luminosity of the infrared excess that is the result of numerically integrating the flux density in excess of the predicted level of the photosphere. Direct measurements of the distance to TWA members are limited to only five systems (Table 1). We have assigned a distance of 55 pc, the distance corresponding to the unweighted average of the parallaxes measured by Hipparcos excluding TWA 19, to the other stars in the sample. In general, is higher than expected for the TWA given their spectral types because these young, rapidly evolving stars have higher luminosities, lower temperatures, and larger radii than when they reach the main sequence.
Conservative upper limits for have been assigned to objects listed in Table 4 that show no evidence for a 24 m excess by assuming that the 1 upper limits estimated for the 70 m flux densities represent the brightness of a possible IR excess plus photosphere at this wavelength. It is also assumed that any possible IR excess is well approximated by a blackbody with temperature, . The upper limit on the temperature of a possible cold PDS is given in Table 4 and is set so that and the assumed value for (70 m) raise (24 m) by no more than 10%; the adopted uncertainty in the absolute flux calibration of the MIPS measurements at 24 m. These upper limits on temperature do not preclude small amounts of warmer dust within systems that are still consistent with the 24 m measurements, but they do constrain the properties of circumstellar material able to produce substantial excesses at 70 m and be undetected by Spitzer.
The mass of circumstellar dust responsible for the luminosity of IR excesses observed in the TWA, or that could produce the upper limits found for and , can be deduced following the inferences of Jura et al. (1995) and Chen & Jura (2001). That is, the minimum mass in dust can be estimated by
(Jura et al., 1995), where is the average radius of a dust grain, is the minimum distance from the star where the grains are in radiative equilibrium, and is the mass density of the grains. The equation above assumes that the dust is radiating from a thin shell at a distance from the illuminating star and that the debris disk is optically thin. Also, it is assumed that the dust grains are spherical and have cross sections equal to their geometric cross sections. In Table 4, we tabulate using the values for average grain size and density adopted by Chen & Jura (2001) ( m; g cm-3). The minimum dust mass responsible for detected IR excesses range from g for HR 4796A to g for TWA 13. For HD 98800B, the assumption that the debris disk is optically thin is not valid, accounting for the much smaller mass estimate than that determined by Low, Hines, & Schneider (1999).
The mass estimates in Table 4 for the TWA are conservative lower bounds for the total circumstellar dust mass in these systems since the MIPS observations are not sensitive to colder material located further from a star and emission from larger particles. For example, there is evidence for material around TWA 7 colder than the 80 K dust detected by Spitzer. Observations at 850 m by Webb (2000a) detected TWA 7 with mJy. This flux density is about a factor of seven higher than the extrapolation to 850 m of the 80 K blackbody determined by the 24 and 70 m excesses. Webb (2000a) and Webb et al. (2000b) interpret the sub-millimeter emission as coming from 20 K dust with grain sizes on the order of a few hundred microns. As a consequence, the mass estimate for the dust disk around TWA 7 derived by the sub-millimeter measurement is greater than that estimated from the IR excess.
4. Discussion
4.1. Infrared Properties of the TWA
The main result of the Spitzer-MIPS observations of the TWA is to show that most stars in the association exhibit no evidence for circumstellar dust and that the 24 m data place severe limits on the presence of warm ( K) dust within these systems. Although the TWA includes four remarkable IR-excess systems, there are no other objects that come close to their 24 m output relative to the observed near-IR photospheric emission. The bimodal distribution of warm dust in the TWA, identified by Weinberger et al. (2004) at shorter wavelengths, is confirmed at 24 m for a larger sample of objects (see Figure 1).
The bimodal nature of 70 m excesses is not as pronounced as at shorter wavelengths, but there is still a gap of about a factor of 10 between the strengths of the 70 m excess of Hen 3-600 and the Spitzer detections of TWA 7 and 13. There is also a range of at least between the brightest and faintest of the 70 m excesses in the TWA relative to their photospheres at this wavelength. The luminosity of the observed IR excesses range from % (TW Hya and HD 98800B) to % (TWA 13) of .
It is difficult to fully characterize the IR excesses of TWA 7 and 13 given that they only begin to appear at 24 m. In the case of TWA 13, there is also the complicating factor that the system is a binary and the distribution of the material responsible for the excess is unknown. However, calculating a color temperature for the two objects yields similar results: –80 K. Assuming that the excesses are well fit by blackbodies, both systems have a fractional IR luminosity of 1% of that measured for HD 98800B; and , for TWA 7 and 13, respectively. Although the lack of observed excess 24 m emission constrains the temperatures of possible PDSs for most of the 70 m non-detections to be K, the MIPS observational upper limits cannot rule out IR excesses with fractional luminosity in the range of –. Even at the estimated young age of the association it may already be more likely to detect cooler material, further away from the stars, than warmer material that results in an excess at 24 m or shorter wavelengths. Clearly, at 70 m wavelength, large amounts of additional Spitzer time will be needed to detect and measure the cool dust and debris around these stars.
The variety of the IR properties in the TWA is remarkable given the assumption that its members have similar ages. At 8–10 Myr after the formation of the TWA, there are still two systems (TW Hya and Hen 3-600) accreting presumably primordial dust and they have enough circumstellar material to reprocess a large fraction (10–30%) of the stellar luminosity into the infrared. Also in the association are two multiple-star systems, HD 98800 and HR 4796, that have a prominent PDS around only one of the stellar components and the debris is relatively warm (–170 K). TWA 7 shows evidence for a weak 24 m excess with the detected material being cooler ( K) and located in orbits AU from the star. The remaining 19 stars, including TWA 7 and 13, have apparently been cleansed to a high degree of dust with K. This variety of properties suggests that dust is swept from regions within several AU (see Table 4) of the star very early in the system’s evolution. The fact that stars in the association show no signature of warm dust while other members exhibit strong T Tauri activity implies that the transition period from the T Tauri stage to the more quiescent state observed for most of the TWA K- and M-type stars, is very short.
An efficient mechanism for the removal of dust is thought to be the formation of planets that sweep up dust and larger debris in the regions that they orbit. Weinberger et al. (2004) suggest that planetary formation was rapidly completed in the TWA at least in the region where terrestrial planets would be expected to form. This led to the rapid disappearance of dust in the inner several AU of these systems, leaving only the stellar photosphere to be detected at wavelengths of 24 m and shorter. Strong stellar winds during the T Tauri stage and the Poynting-Robertson drag are also mechanisms that can decrease the IR emission from a system by ridding the environment of small dust grains. Of course, in most TWA systems, and within 10 Myr of their formation, dust destruction mechanisms must more than compensate for the dust production mechanism of collisions between larger bodies to clear out the terrestrial planet region. HD 98800B and HR 4796A are likely cases where their debris systems indicate that collisions between bodies are still important and produce dust close enough to the stars to result in large excesses at 24 m.
Nearly all members of the observed sample are X-ray emitters, supporting the assertion that stellar winds in these young, low-mass stars may be an important dust destruction mechanism (see e.g., Hollenbach, Yorke, & Johnstone, 2000). We list the X-ray–to–stellar luminosity ratios, , for TWA stars in the last column of Table 4. The X-ray data are drawn from the ROSAT All Sky Survey Catalog and is calculated in the manner described by Sterzik et al. (1999). Chen et al. (2005) find an apparent correlation between IR and X-ray luminosity for their sample of F- and G-type stars with ages spanning 5–20 Myr in the Scorpius-Centaurus OB Association. This possible correlation is in the sense of brighter 24 m excesses tending to be associated with fainter stars in X-ray flux, and Chen et al. (2005) suggest that the stronger stellar wind implied by the chromospheric activity may help explain the general lack of young systems with 24 m excesses. Given that only three stars in the TWA sample have confirmed PDSs that produce measurable excesses at 24 m, it is not possible to test the validity of the X-ray–IR flux correlation. However, HD 98800B, HR 4796A, and TWA 7, are all underluminous in X-rays compared to the average observed X-ray emission for the TWA.
4.2. Comparison of the TWA with the Young Solar System
We can compare the Spitzer observations of young stars with models for the early Solar System. Following the discussions in Gaidos (1999) and Jura (2004), we assume that the rate of dust production directly scales as the rate of lunar cratering during the Late Heavy Bombardment. The rate of dust production, , is given by:
where is the look-back time in 109 yr (Gyr), is the current rate of dust production and and are fitting constants such that and = 0.144 (Chyba, 1991). In this model, the dust production rate has been approximately constant during the past 3.3 Gyr, but was as high as the current value when . We set g s-1 based on the zodiacal light in the Solar System (Fixsen & Dwek, 2002), implying that the early Solar System may have had a dust production rate of g s-1. In a model where this quantity of dust is produced far from the star and then loses angular momentum under the action of the Poynting-Robertson effect, it is straightforward to show (e.g., Gaidos, 1999) that the luminosity of the dust, , is given by the expression:
For the TWA, young M-type stars would have luminosities at 24 m of erg s-1 Hz-1 and, for distances of 50 pc, we expect Fν(24 m) 700 mJy, vastly greater than what is observed. This result suggests the absence of terrestrial planet-forming environments around these stars. However, in M-type stars where the luminosity is relatively low and the stellar wind rate is relatively large, dust grains mainly lose angular momentum by stellar wind drag rather than through Poynting-Robertson drag (see Jura, 2004; Plavchan et al., 2005). In this case, and if denotes the stellar wind loss rate, then:
Although we do not know for young M-type stars, we can extrapolate from their X-ray emission since the winds are likely to be driven by the same hot corona which produces the X-rays. It is plausible that young M-type stars have mass loss rates 102 greater than the current Solar wind loss rate of g s-1, and we estimate that g s-1. For main sequence early M-type stars, we may adopt . Therefore, we expect that at 24 m, erg s-1 Hz-1 and a predicted flux at 50 pc of only 0.7 mJy. A 24 m excess this small is beyond the sensitivity of our current measurements, and it is possible that planet forming activity may still be occurring around the young M-type stars in the TWA even though we do not detect an infrared excess.
The TWA gives us an important example of the rapid evolution of the circumstellar material around generally low-mass stars with ages of Myr that is in line with time scales of terrestrial planet formation inferred for our solar system from radiochemistry of meteorites (Yin et al., 2002; Kleine et al., 2002). The diverse IR properties of the association also suggest that the evolutionary processes relevant to planetary formation and accretion disk dispersal may occur at different rates even for stars with similar spectral types. For most of the systems observed, the lack of emission from dust within a few AU of the stars leads to two possible conclusions. Either, (1) the early conditions around pre-main sequence M and late K stars prevent the formation of terrestrial planets in most cases, or that (2) terrestrial planet building has already progressed to the point where the mass is in the form of planetesimals.
References
- Aumann et al. (1984) Aumann, H. H., et al. 1984, ApJ, 278, L23
- Beichman et al. (1988) Beichman, C. A., Neugebauer, G., Habing, H. J., Clegg, P. E., & Chester, T. J. 1988, in Infrared Astronomical Satellite (IRAS) Catalogs and Atlases, vol. 1, Explanatory Supplement, NASA RP-1190 (Washington, DC: GPO)
- Chen & Jura (2001) Chen, C. H., & Jura, M. 2001, ApJ, 560, L171
- Chen et al. (2005) Chen, C. H., Jura, M., Gordon, K. D., & Blaylock, M. 2005, ApJ, 623, 493
- Chyba (1991) Chyba, C. F. 1991, Icarus, 92, 217
- Cutri et al. (2003) Cutri, R.M., et al. 2003, Explanatory Supplement to the 2MASS All Sky Data Release, http://www.ipac.caltech.edu/2mass/releases/ allsky/doc/explsup.html
- de la Reza et al. (1989) de la Reza, R., Torres, C. A. O., Quast, G., Castilho, B. V., Vieira, G. L. 1989, ApJ, 343, L61
- Epchtein et al. (1999) Epchtein, N. et al. 1999, A&A, 349, 236
- ESA (1997) European Space Agency 1997, The Hipparcos and Tycho Catalogues (Paris: ESA), SP-1200
- Fixsen & Dwek (2002) Fixsen, D. J. & Dwek, E. 2002, ApJ, 578, 1009
- Gaidos (1999) Gaidos, E. J. 1999, ApJ, 510, L131
- Gehrz et al. (1999) Gehrz, R. D., Smith, N., Low, F. J., Krautter, J., Nollenberg, J. G., & Jones, T. J. 1999, ApJ, 512, L55
- Gillett (1986) Gillett, F. C. 1986, in Light on Dark Matter, ed. F. P. Israel (Dordrecht: D. Reidel), 61
- Gordon et al. (2005) Gordon, K. D., et al. 2005, PASP, 117, 503
- Gregorio-Hetem et al. (1992) Gregorio-Hetem, J., Lépine, J. R. D., Quast, G. R., Torres, C. A. O., & de la Reza, R. 1992, AJ, 103, 549
- Habing et al. (2001) Habing, H. J., et al. 2001, A&A, 365, 545
- Hines et al. (2004) Hines, D. C., Low, F. J., Schneider, G., Chandler, C. J., Plait, P., & Smith, P. S. 2004, in ASP Conference Series, 324, Debris Disks and the Formation of Planets: A Symposium in Memory of Fred Gillett, eds. L. Caroff, L. J. Moon, D. Backman, & E. Praton (San Francisco: ASP), 262
- Hollenbach, Yorke, & Johnstone (2000) Hollenbach, D. J., Yorke, H. W., & Johnstone D. 2000, in Protostars and Planets IV, eds. V. Mannings, A. P. Boss, & S. S. Russell (Tucson: The University of Arizona Press), 401
- Hauschildt, Allard, & Baron (1999) Hauschildt, P. H., Allard, F., & Baron, E. 1999, ApJ, 512, 377
- Herbig, G. H. (1978) Herbig, G. H. 1978, Origin of the Solar System (New York: Wiley-Interscience), 219
- Houck et al. (2004) Houck, J. R., et al. 2004, ApJS, 154, 18
- Houk (1982) Houk, N. 1982, Michigan Spectral Survey (Ann Arbor: University of Michigan Press), 3
- Jayawardhana et al. (1998) Jayawardhana, R., Fisher, S., Hartmann, L., Telesco, C., Piña, R., & Fazio, G. 1998, ApJ, 503, L79
- Jayawardhana et al. (1999) Jayawardhana, R., Hartmann, L., Fazio, G., Fisher, R. S., Telesco, C. M., & Piña, R. K. 1999, ApJ, 521, L129
- Jura (2004) Jura, M. 2004, ApJ, 603, 729
- Jura et al. (1995) Jura, M., Ghez, A. M., White, R. J., McCarthy, D. W., Smith, R. C., & Martin, P. G. 1995, ApJ, 445, 451
- Jura et al. (1993) Jura, M., Zuckerman, B., Becklin, E. E., & Smith, R. C. 1993, ApJ, 418, L37
- Kastner et al. (1997) Kastner, J. H., Zuckerman, B., Weintraub, D. A., & Forveille, T. 1997, Science, 277, 67
- Kenyon & Bromley (2002) Kenyon, S. J., & Bromley, B. C. 2002, ApJ, 577, L35
- Kenyon & Bromley (2004) Kenyon, S. J., & Bromley, B. C. 2004, AJ, 127, 513
- Kleine et al. (2002) Kleine, T., Münker, C. Mezger, K., & Palme, H. 2002, Nature, 418, 952
- Koerner et al. (1998) Koerner, D. W., Ressler, M. E., Werner, M. W., & Backman, D. E. 1998, ApJ, 503, L83
- Kurucz (1979) Kurucz, R. L. 1979, ApJS, 40, 1
- Lasker et al. (1990) Lasker, B. M., Stuch, C. R., McLean, B. J., Russell, J. L., Jenker, H., & Shara, M. 1990, AJ, 99, 2019
- Low, Hines, & Schneider (1999) Low, F. J., Hines, D. C., & Schneider, G. 1999, ApJ, 520, L45.
- Mamajek, Lawson, & Feigelson (2000) Mamajek, E. E., Lawson, W. A., & Feigelson, E. D. 2000, ApJ, 544, 356
- Mannings & Barlow (1998) Mannings, V.i, & Barlow, M. J. 1998, ApJ, 497, 330
- Meyer & Beckwith (2000) Meyer, M. R., & Beckwith, S. V. W. 2000, in ISO Surveys of a Dusty Universe, eds. D. Lemke, M. Stickel, & K. Wilke (New York: Springer), 341
- Monet (1999) Monet, D. G. 1999, USNO A2.0 (CD-ROM)
- Perryman et al. (1997) Perryman, M. A. C., et al. 1997, A&A, 323, L49
- Platais et al. (1998) Platais et al. 1998, AJ, 116, 2556
- Plavchan et al. (2005) Plavchan, P., Jura, M. & Lipscy, S. 2005, ApJ, in press
- Prato et al. (2001) Prato, L., et al. 2001, ApJ, 549, 590
- Reid (2003) Reid, N. 2003, MNRAS, 342, 837
- Rieke et al. (2005) Rieke, G. H., et al. 2005, ApJ, 620, 1010
- Rieke et al. (2004) Rieke, G. H., et al. 2004, ApJS, 154, 25
- Rucinski & Krautter (1983) Rucinski, S. M., & Krautter, J. 1983, A&A, 121, 217
- Schneider et al. (1999) Schneider, G., et al. 1999, ApJ, 513, L127
- Soderblom et al. (1998) Soderblom D. R., et al. 1998 ApJ, 498, 385
- Spangler et al. (2001) Spangler, C., Sargent, A. I., Silverstone, M. D., Becklin, E. E., & Zuckerman, B. 2001, ApJ, 555, 932
- Song et al. (2003) Song, I., Zuckerman, B., & Bessel, M. S., 2003, ApJ, 599, 342
- Stauffer, Hartmann, & Barrado y Navascues (1995) Stauffer, J. R., Hartmann, L. W., & Barrado y Navascues, D. 1995, ApJ, 454, 910
- Sterzik et al. (1999) Sterzik, M. F., Alcalá, J. M., Covino, E., & Petr, M. G. 1999, A&A, 346, L41
- Torres et al. (2000) Torres, C. A. O., da Silva, L., Quast, G. R., de la Reza, R., & Jilinski, E. 2000, AJ, 120, 1410
- Uchida et al. (2004) Uchida, K. I., et al. 2004, ApJS, 154, 439
- Walker & Wolstencroft (1988) Walker, H. J., & Wolstencroft, R. D. 1988, PASP, 100, 1509
- Webb (2000a) Webb, R. A. 2000a, Ph.D. thesis, UCLA
- Webb et al. (2000b) Webb, R. A., Zuckerman, B., Greaves, J. S., & Holland, W. S. 2000b, BAAS, 197, 827
- Webb et al. (1999) Webb, R. A., Zuckerman, B., Platais, I., Patience, J., White, R. J., Schwartz, M. J., & McCarthy, C. 1999, ApJ, 512, L63
- Weinberger et al. (2004) Weinberger, A. J., Becklin, E. E., Zuckerman, B., & Song, I. 2004, AJ, 127, 2246
- Werner et al. (2004) Werner, M. W., et al. 2004, ApJS, 154, 1
- Yin et al. (2002) Yin, Q., Jacobsen, S. B., Yamashita, K., Blichert-Toft, J., Télouk, P., & Albarède, F. 2002, Nature, 418, 949
- Zacharias (2000) Zackarias, N., et al. 2000, AJ, 120, 2131
- Zacharias (2004) Zackarias, N., Urban, S. E., Zacharias, M. I., Wycoff, G. L., Hall, D. M., Monet, D. G., Rafferty, T. J. 2004, AJ, 127, 3043
- Zuckerman & Becklin (1993) Zuckerman, B., & Becklin, E. E. 1993, ApJ, 414, 793
- Zuckerman et al. (2001) Zuckerman, B., Webb, R. A., Schwartz, M., & Becklin, E. E. 2001, ApJ, 549, L233
| StaraaAB designates binaries that are unresolved by Spitzer at m. | Other Name | Spectral Type | Ref.bbReferences for spectral types and identifications as members of the TWA — (1) Rucinski & Krautter (1983); (2) de la Reza et al. (1989); (3) Gregorio-Hetem et al. (1992); (4) Webb et al. (1999); (5) Houk (1982); (6) Sterzik et al. (1999); (7) Zuckerman et al. (2001). | distanceccData are from the Hipparcos Catalog (Perryman et al., 1997). | Ref.ddSources and references for previous optical–IR photometry — (1) Torres et al. (2000); (2) Reid (2003); (3) Hipparcos-Tycho (ESA, 1997); (4) 2MASS (Cutri et al., 2003); (5) DENIS (Epchtein et al., 1999); (6) Jayawardhana et al. (1999); (7) IRAS (Beichman et al., 1988); (8) UCAC1 (Zacharias, 2000); (9) Yale-SPM (Platais et al., 1998); (10) Low, Hines, & Schneider (1999); (11) UCAC2 (Zacharias, 2004); (12) GSC (Lasker et al., 1990); (13) Soderblom et al. (1998); (14) Prato et al. (2001); (15) Gehrz et al. (1999); (16) Weinberger et al. (2004); (17) USNO A2.0 (Monet, 1999); (18) Zuckerman et al. (2001). | eeApparent magnitude is from the 2MASS Point Source Catalog, except for HD 98800, where the -band magnitudes for both components are from Low, Hines, & Schneider (1999). | ffTemperature of the best-fit Kurucz or NextGen model to the stellar photometry. | |
|---|---|---|---|---|---|---|---|---|
| (pc) | (K) | |||||||
| TWA 1 | TW Hya | K8e | 1 | 56 7 | 11.07 | 1–9 | 7.30 | 3700 |
| TWA 2AB | CD29∘8887 | M2e+M2 | 2 | 11.42 | 1–4,6,8,9 | 6.71 | 3500 | |
| TWA 3AB | Hen 3-600 | M3e+M3.5 | 2 | 12.04 | 1,2,6,7 | 6.77 | 3300 | |
| TWA 4AB | HD 98800 | K4+K5 | 3 | 47 6 | 8.89 | 1–7, 10–15 | 5.59(A), 5.90(B) | 4800(A), 3800(B) |
| TWA 5A | CD33∘7795 | M3e | 3 | 11.72 | 1–5,8,9,16 | 6.75 | 3400 | |
| TWA 6 | K7 | 4 | 12.00 | 1–4,6,12,16,17 | 8.04 | 4000 | ||
| TWA 7 | M1 | 4 | 11.06 | 1–4,6,9,16 | 6.90 | 3500 | ||
| TWA 8A | M2e | 4 | 13.30 | 1–3,6,12 | 7.43 | 3300 | ||
| TWA 8B | M5 | 4 | 9.01 | 3100 | ||||
| TWA 9A | CD36∘7429A | K5 | 4 | 50 6ggSee Mamajek, Lawson, & Feigelson (2000) for a discussion of the Hipparcos parallax measurement for TWA 9. | 11.32 | 1–6,9,12 | 7.85 | 4200 |
| TWA 9B | CD36∘7429B | M1 | 4 | 50 6ggSee Mamajek, Lawson, & Feigelson (2000) for a discussion of the Hipparcos parallax measurement for TWA 9. | 14.10 | 9.15 | 3300 | |
| TWA 10 | M2.5 | 4 | 12.70 | 1,2,4,6,12 | 8.19 | 3400 | ||
| TWA 11A | HR 4796A | A0 | 5 | 67 2 | 5.78 | 2–4,6–9,12 | 5.77 | 9250 |
| TWA 12 | M2 | 6 | 13.60 | 2,4,12,16 | 8.06 | 3000 | ||
| TWA 13A | CD34∘7390A | M1e | 1,6 | 12.10 | 1,4,12,16 | 7.50 | 3300 | |
| TWA 13B | CD34∘7390B | M1e | 1,6 | 12.40 | 7.46 | 3200 | ||
| TWA 14 | M0 | 7 | 13.80 | 2–4,12,16,18 | 8.50 | 3300 | ||
| TWA 15A | M1.5 | 7 | 14.10 | 2,4,16,18 | 9.68 | 3500 | ||
| TWA 15B | M2 | 7 | 14.00 | 9.56 | 3500 | |||
| TWA 16 | M1.5 | 7 | 12.30 | 2,4,12,16,18 | 8.10 | 3700 | ||
| TWA 17 | K5 | 7 | 12.70 | 2,4,5,12,16,18 | 8.98 | 4000 | ||
| TWA 18 | M0.5 | 7 | 12.90 | 2,4,5,12,16,18 | 8.84 | 3800 | ||
| TWA 19A | HD 102458A | G5 | 7 | 104 15 | 9.10 | 2–5,7,12,16 | 7.51 | 6000 |
| TWA 19B | HD 102458B | K7 | 7 | 104 15 | 11.90 | 2,4,12,16,18 | 8.28 | 4000 |
| Band | scale | aaConversion factor from the calibrated instrumental units of the DAT output to mJy. | Phot. Apt. | bbFactor to correct aperture photometry to that expected from a hypothetical aperture of infinite extent. | ||
|---|---|---|---|---|---|---|
| (m) | (m) | (″ pixel-1) | (radius in ″) | |||
| 24 m | 23.7 | 4.7 | 2.55 | 1.042 10-3 | 15 or 37.5 | 1.15 or 1.06 |
| 70 m wide field | 71 | 19 | 9.85 | 14.9 | 29.6 | 1.35 |
| 70 m narrow field | 71 | 19 | 5.24 | 52.7 | 29.7 | 1.35 |
| 160 m | 156 | 35 | 16 | 1.0 | 64 | 1.33 |
| Star | Epoch | 24 m | (S/N) | 70 maaUpper limits listed are the detected signal within the photometric aperture plus 3. If the flux measured within the aperture is less than the background level measured for the aperture, the upper limit listed is 3. | (S/N) | 160 m | (S/N) |
|---|---|---|---|---|---|---|---|
| (JD-2453000.0) | (mJy) | (mJy) | (mJy) | ||||
| TW Hya | 38.282 | 2270 230 | 104 | 3640 730 | 170 | 6570 1310 | 160 |
| TWA 2AB | 35.384 | 20.1 2.0 | 200 | 40 | |||
| Hen 3-600 | 38.268 | 1650 170 | 104 | 700 140 | 140 | 740 190 | 6 |
| HD 98800AB | 177.665 | 8500 350 | 1000 | 6260 1250 | 200 | 2100 420 | 67 |
| TWA 5A | 38.255 | 21.1 2.1 | 220 | 9 | |||
| TWA 6 | 134.825 | 5.7 0.6 | 240 | 8 | |||
| TWA 7 | 35.398 | 30.2 3.0 | 260 | 85 17 | 22 | ||
| TWA 8 | 35.905 | 14.5 1.5 | 160 | 11 | |||
| A | 11.1 1.5 | ||||||
| B | 3.4 0.4 | ||||||
| TWA 9 | 37.870 | 9.3 1.1 | 160 | 34 | |||
| A | 6.0 0.6 | ||||||
| B | 3.3 0.3 | ||||||
| TWA 10 | 55.726 | 5.1 0.5 | 190 | 8 | |||
| HR 4796A | 35.928 | 3030 303 | 104 | 5160 1100 | 240 | 1800 360 | 55 |
| TWA 12 | 177.907 | 5.7 0.6 | 50 | 29 | |||
| TWA 13 | 177.680 | 17.6 1.8 | 150 | 27.6 5.9 | 13 | ||
| A | 8.8 1.3 | ||||||
| B | 8.8 1.3 | ||||||
| TWA 14 | 55.677 | 4.1 0.4 | 27 | 25 | |||
| TWA 15 | 55.701 | 2.9 0.3 | 72 | 12 | |||
| A | 1.4 0.2 | ||||||
| B | 1.5 0.2 | ||||||
| TWA 16 | 55.714 | 6.6 0.6 | 45 | 18 | |||
| TWA 17 | 55.743 | 1.5 0.2 | 13 | 13 | |||
| TWA 18 | 55.762 | 2.3 0.3 | 20 | 9 | |||
| TWA 19A | 55.689 | 10.4 1.1 | 100 | 27 | |||
| TWA 19B | 55.689 | 4.6 0.5 | 44 | 27 |
| Star | (K) | aaThe minimum distance from a star for dust in thermal equilibrium at temperature, , is given by , where is radius of the star. (AU) | ( g)bbThe estimated minimum mass in dust, , consistent with the observations for systems where can be determined or constrained, and assuming that the circumstellar debris is optically thin. An average dust grain size of 2.8 m in radius and a density for the material of g cm-3 are assumed (Chen & Jura, 2001). For systems with no detected IR excesses, is an estimate using the limits determined for and . | ccA distance to the TWA of 55 pc is assumed except for the five systems with measured parallaxes. For these systems, the distances listed in Table 1 are used to determine . | ||
|---|---|---|---|---|---|---|
| TW Hya | 0.24 | |||||
| TWA 2ABddTWA 2, Hen 3-600, and HD 98800B are binaries and both stellar components are included in the luminosity values. | 0.27 | 0.39 | ||||
| Hen 3-600ddTWA 2, Hen 3-600, and HD 98800B are binaries and both stellar components are included in the luminosity values. | 0.35 | |||||
| HD 98800BddTWA 2, Hen 3-600, and HD 98800B are binaries and both stellar components are included in the luminosity values. | 160 | 2.2 | eeThe minimum dust mass for the HD 98800B debris system is likely to be underestimated because the assumption that the circumstellar material is optically thin in the IR is not valid (see, Low, Hines, & Schneider, 1999). | 0.53 | ||
| TWA 5A | 0.01 | 0.36 | ||||
| TWA 6 | 0.02 | 0.14 | ||||
| TWA 7 | 6.8 | 2.4 | 0.31 | |||
| TWA 8A | 0.04 | 0.19 | ||||
| TWA 8B | 0.19 | 0.04 | ||||
| TWA 9A | 1.3 | 0.15 | ||||
| TWA 9B | 1.5 | 0.03 | ||||
| TWA 10 | 0.09 | 0.09 | ||||
| HR 4796A | 30 | 110 | 19.7 | |||
| TWA 12 | 0.94 | 0.09 | ||||
| TWA 13A | 7.8 | 1.4 | 0.18 | |||
| TWA 13B | 7.7 | 1.4 | 0.17 | |||
| TWA 14 | 0.59 | 0.07 | ||||
| TWA 15A | 0.27 | 0.03 | ||||
| TWA 15B | 0.20 | 0.03 | ||||
| TWA 16 | 0.15 | 0.12 | ||||
| TWA 17 | 0.54 | 0.06 | ||||
| TWA 18 | 0.06 | 0.06 | ||||
| TWA 19A | 1.0 | 2.10 | ||||
| TWA 19B | 2.7 | 0.38 |