11email: emason@eso.org 22institutetext: WIYN/NOAO, P.O. Box 26732, 950 Cherry Ave., Tucson, AZ 85719
22email: howell@noao.edu
On the new short orbital period cataclysmic variable H0242-2802††thanks: Based on observations obtained at the ESO Paranal Observatory (ESO proposal 269.C-5056(A)).
We present results from our phase-resolved spectroscopy of the newly identified cataclysmic variable H0242-2802. H0242-2802 was identified from a deep UK Schmidt H-R band survey as a candidate cataclysmic variable. Although initial spectroscopy revealed an optical spectrum very similar to that of the famous short orbital period system WZ Sge, the analysis of our data shows that this is not the case. H0242-28 differs from WZ Sge in both the accretion disk structure and the orbital period. In particular, H0242-28 appears to be a system which has not reached the orbital period minimum, yet.
Key Words.:
star: cataclysmic variables, dwarf novae – individual: H0242-28021 Introduction
Cataclysmic variables (CVs) are binary systems where a white dwarf (WD) accretes material from a secondary star which is filling its Roche lobe (see Warner 1995 for a review).
Recent theoretical works (e.g. Howell et al. 2001, and Kolb 2001) predict that the majority of the CVs should be very old and evolved systems. These systems are characterized by short orbital periods (i.e. 2 hr), low intrinsic luminosity ( mag), and evolved low mass secondary stars (see also Howell et al. 1995). However, the number of currently known/observed short orbital period systems does not match the expectation. Thus, in recent years, many surveys have taken place to fill such a gap (e.g. SDSS by Szkody et al. 2002, HQS by Gansicke et al. 2002, FSVS by Groot et al. 2003, etc). At a same time, new ideas (e.g., the need to go even fainter) and different accretion scenarios (e.g. Spruit and Taam 2001, Dubus et al. 2002), have been presented and analyzed.
H0242-2802 (hereafter H0242) was a CV candidate within the UK-Schmidt survey (Davenhall et al. 2001). It was confirmed as CV by Howell et al. (2002), who observed it spectroscopically and reported a spectrum very similar to that of WZ Sge. Indeed, the authors also advanced the hypothesis that H0242 belongs to the same dwarf nova subclass of Tremendous Outburst Amplitude Dwarf novae (TOADs, see Howell et al. 1995 for a review on TOADs). An interesting implication of this would be that H0242 is quite high above the galactic plane ( pc), and resides in the hold disk - halo population.
Here, we present time-series spectroscopy obtained with VLT+FORS2 with the aim of determining the orbital period, the system parameters, the emission lines characteristics, and comparing such values with those of WZ Sge, the prototype object of the very old evolved CV population (see Howell et al., 2004). We present our spectroscopic observations in Sec. 2, the data analysis in Sec. 3 and our conclusions in Sec. 4
2 Observations and data reduction
H0242 was observed at VLT+FORS2 using a series of 5 min exposures over 4 consecutive hours. An 8-m class telescope is mandatory in order to perform time resolved spectroscopy of faint targets (H B mag is 19, see Howell et al. 2002), and determine the radial velocity curve of systems having orbital period around 2 hr. We used FORS2 in Multi Object Spectroscopy (MOS) mode with the holographic grism 1400V. We preferred the MOS mode to the long slit spectroscopy (LSS), in order to cover a bluer wavelength range111Namely 4270-5550, rather than the standard 4560-5860.. Indeed, the bluer wavelength coverage allowed us to observe the Doppler broadened Balmer lines H and H (see Fig. 1). The slit width was set to 1” and together with the grism 1400V provided a dispersion of 0.63 Å/pix.
| date of obs. | 2002/09/10 |
|---|---|
| UT start | 05:41 |
| UT end | 09:52 |
| average seeing | 0.7 |
| average transparency | CLR-THN |
| number of spectra | 40 |
| exptime per spectrum | 300 sec |
| instrument | FORS2 |
| instr. set up | MOS/SR/no filter/GRIS 1400V |
| read out mode | 200kHz, 2x2, 1.25 (speed, binning, gain) |

The log. of observation is presented in Table 1 . A standard star with the same instrument set up was observed one month later allowing us to place the spectra on a relative flux scale. Fortunately, absolute flux measurements are not needed for the analysis presented in this paper.
The data reduction was performed through standard IRAF routines within the packages ccdproc, apex, and onedspec.
3 Data analysis
3.1 Overview/General properties
We plot in Fig.1 the average spectrum of H0242. The continuum shape is not as blue as in the previous observation of Howell et al. (2002) and this is probably an artifact of the calibration. The emission lines which are visible in the spectrum are the two Balmer lines H and H and the FeII lines from multiplets 37, 38, 42 (the strongest), and 49. Visible are also the HeI lines 4471 and 4713. The observation of optical FeII emission has already been reported in the literature but never with sufficient attention. We will develop a brief discussion about FeII emission and their formation mechanism in CVs in Sec. 3.6. Here, we note that all the emission lines have a similar shape. They are double peaked with a deep central absorption core which extends below the continuum. This is signature of high orbital inclination. The B/R ratio of the average spectrum (Fig. 1) appears greater than 1 for the Balmer lines and 1 for the FeII. This is, at least in part, an artifact of the flux calibration which introduces a red continuum. Indeed, on one hand, the normalized average spectrum shows that B/R1 in the Balmer lines and B/R1 in the FeII (42) emission lines. On the other hand, the analysis of the single spectra shows that the Balmer, HeI, and the FeII lines follow a similar modulation throughout the orbit. This is well shown by the trailed spectrograms that we present further below (see Fig. 5). A possible explanation for the different B/R ratio between the Balmer and the FeII lines in the average spectrum, may be a larger fractional contribution of the hot spot in the Balmer lines, when it is blue shifted.
We also observed a weak emission from the HeII 4684. The HeII line is not readily visible in the single spectra, nor in the average one. It is visible only in the trailed spectrogram where it produces a pure S-wave (see Fig. 5 and Sec. 3.4).
In the following sections we will analyze the spectra searching for the orbital period of the binary system, and applying the usual analysis for the accretion disk emission lines (RV measurements, trailed spectra etc). We will pay particular attention to the comparison between WZ Sge and H0242.
3.2 Period search

We searched for the binary system orbital period applying the Phase Dispersion Minimization method (PDM method, Stellingwerf 1987) to different emission line features222We measured in particular: the position of the red and the blue peak in the emission line, the position of the central absorption, and the line flux barycenter.. We did not discover any statistically significant period. However, we found clear evidence for the orbital period by plotting the light curve of the continuum flux measured at 5500Å (see Fig. 2). Indeed, the light curve is characterized by a deep eclipse of almost 2 magnitudes with periodicity of 107 min. Woudt et al. (2004), determined the same orbital period through time resolved photometry.
We also found a periodicity of 106 min from the radial velocity measurements of the Balmer emission lines through the double Gaussian fit method which was developed by Shafter (1983, and reference therein).
Within this paper, we will adopt the period of 107 min and will phase our spectra assuming as the time of the observed mid-eclipse minimum333Due to the time resolution of our spectra, the “true” minimum could be deeper.. Our approximate ephemeris is:
where the uncertainty on the time corresponds to the time resolution of our data points which is 341 sec, i.e. the sum of the exposure time and the readout time of the mosaic CCD. Thus, the uncertainty on the period (150 sec), was derived both from measuring the width of the period peak in the standard PDM (, P) plot and an estimation from the eclipse light curves in Fig. 2.
3.3 Radial velocity curves
Knowing the orbital period we can phase the spectra and the radial velocity measurements to derive a few parameters characterizing the binary system. We can then produce trailed spectrograms and Doppler maps to qualitatively analyze the evolution of the line profile and the emission components.
In principle, radial velocity measurements of the accretion disk emission lines provide valid information on the white dwarf orbital motion. However, this does not appear to be the case for many CVs and, in particular, the short orbital period systems (e.g. WZ Sge, Mason et al. 2000 and reference therein, and V893 Sco, Mason et al. 2001). The exact causes of such behavior is not well known, nor is there a model capable to explain why the radial velocity curves from different emission lines yield discordant system parameters. Since we are not yet able to quantify the discrepancy between the derived quantities and the corresponding real values, it is still worthwhile measuring and fitting the radial velocity curves of the emission lines and determining coarse values which reasonably constraint the WD Keplerian velocity and the systemic velocity. Of course, within our uncertainties, the readers should be cautionary in their interpretation.
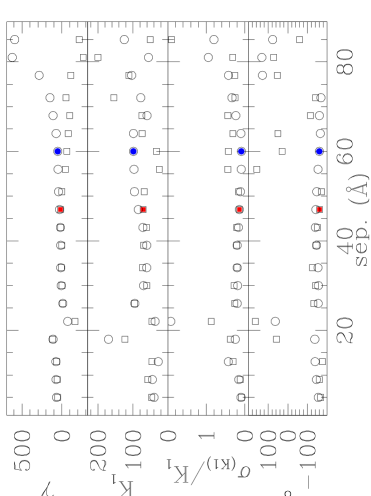
We measured the radial velocity of the Balmer lines using the double Gaussian fit method as defined by Shafter (1983, and references therein). We used narrow Gaussian FWHM (4-2Å), and Gaussian separation steps of equal size. The diagnostic diagram in Fig. 3 shows the fitting parameters corresponding to steps of 4 Å. The best fit for the H radial velocity curve is found at a Gaussian separation of 60 Å, while the best fit for the H radial velocity curve is at a separation of 47 Å. We list in Table 2 the best fit parameters and plot in Fig. 4 (two top panels) the radial velocity curves. As expected and already observed in other short orbital period systems, the two Balmer lines do not produce consistent values for the WD Keplerian velocity and the systemic velocity, which indeed differs by more than . In addition we may note that the two radial velocity curves consist of largely scattered points. We believe that one possible explanation can be found in the fact that the line profile is largely variable across different orbital cycles (see Fig. 5 and Sec. 3.4). Also, the larger scatter of the velocity measurements in the H lines are probably due to the smaller Gaussian separation, which, in principle, can be biased by the hot spot S-wave. However, a larger separation does not produce a better result due to the noisy wings of the H emission line. We will thus adopt a white dwarf Keplerian velocity of 99 km/sec (from just the H line) throughout the present work. Since the systemic velocity resulting by the application of the Gaussian fit method is the most un-reliable parameter (see Tappert 1999 for details), we will adopt the value of km/sec derived below.
The HeII emission is visible only as an S-wave in the trailed spectrogram (see Fig.5), thus, the only way we had to measure its radial velocities was by cursor position and visual inspection.

| em. line | (km sec-1) | K1 (km sec-1) | |
| H | 536 | 999 | 0.0560.014 |
| H | 187 | 7110 | 0.0530.025 |
| HeII | 223 | 6804 | 0.441E-3 |
The radial velocity curve is plotted in Fig. 4, while its best fit parameters are reported in Table 2. The derived value corresponds to the Keplerian velocity of the outer edge of the accretion disk, to a first approximation. Indeed, the real value should be larger as the WD (instantaneous) radial velocity subtracts off from each spectrum/measurement. However, the derived value km/sec matches fairly well the half peak separation (HPS) measured on the Balmer lines: km/sec. The HPS is also a good estimate of the Keplerian velocity at the outer accretion disk edge. We used the value of K=680 km/sec to determine the accretion disk size. Assuming a WD mass of 0.64 (see Sec. 3.5) we find km/sec444The slightly smaller velocity derived from the HPS produces a larger accretion disk radius of km/sec. However, we believe that the average spectrum is affected by both the orbital motion and the hot spot emission which reduce the peak separation..
The derived value of is consistent with the standard hot spot position at an angle of 50-60 deg from the line connecting the two star centers of mass. While, the HeII value corresponds to just the systemic velocity, within our assumption. This is the value adopted in our next analysis.
3.4 Trailed spectra and Doppler maps
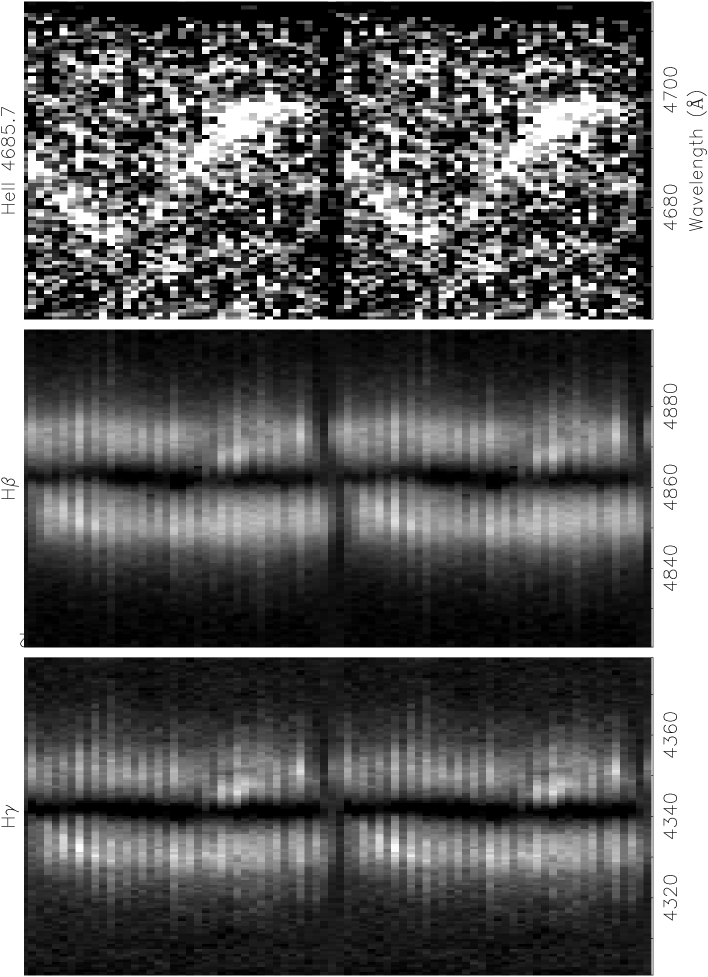
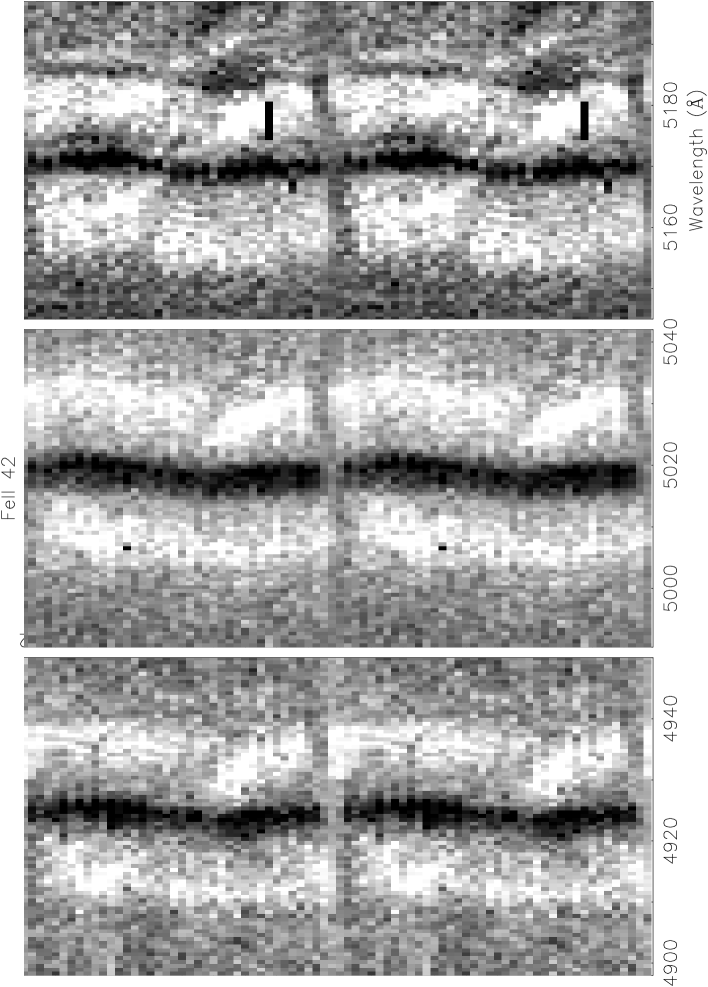
Trailed spectrograms and Doppler maps of the observed emission lines are a common tool to qualitatively analyze the line forming region. We thus plot in Fig. 5 the trailed spectrograms of the Balmer lines and the HeII 4686 (top panels of Fig. 5), as well as of the FeII (42) lines (bottom panels of Fig. 5). All the emission lines clearly show evidence for an eclipse, which implies a high orbital inclination of the binary system (with possibly total eclipse of the white dwarf itself). The Balmer and the FeII lines are double peaked, i.e. form in the upper atmosphere/corona of the accretion disk. They also show only weak evidence of the hot spot emission which indeed is visible only in the phase ranges 0.250.30 and 0.750.85, i.e. when it is seen from the “outside” and the “inside” respectively (see Mason et al. 2000). We also note that the Balmer emission lines vary in width and intensity both across the orbit and different orbital cycles (alternate spectra in the trailed spectrograms belong to two distinct orbital cycles). The same behavior is not evident in the FeII lines but we cannot say whether this is an effect of the smaller S/N or is rather and an intrinsic properties of the system.
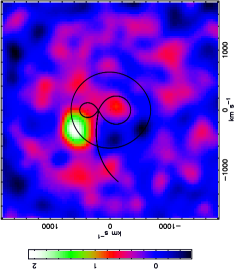
On the other side, the HeII emission shows no evidence for the accretion disk contribution and produces just a clear S-wave which is signature of pure hot spot emission. This can be explained with the fact that the high ionization emission lines can form only at high temperatures, as in the hot spot region where the stream of in-falling gas from the secondary star hits the outer edge of the accretion disk.
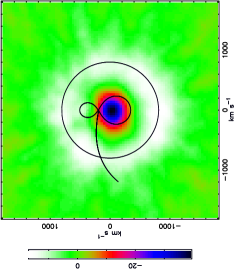
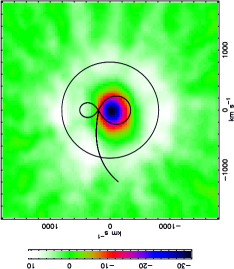
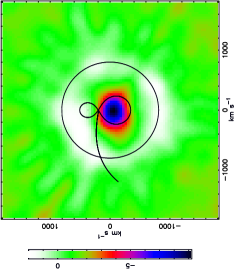
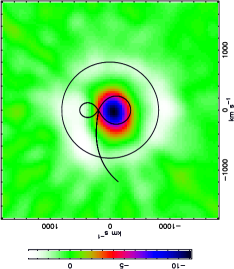
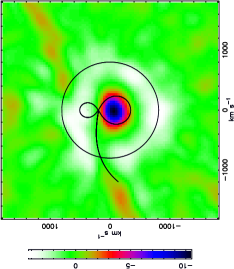
The Balmer, FeII, and HeII lines were also used to produce back projected Doppler maps. The maps confirm our previous conclusions about the emission lines from the Balmer series and low ionization elements. They mostly form in the accretion disk while the hot spot fractional contribution is small and washed out by the disk emission555We may stress that this was not at all the case in WZ Sge where the hot spot emission was contributing up to 50% of the line flux.. The high ionization emission line from HeII is confirmed to form in the impact region within the accretion disk.
We plot on top of each Doppler map the Roche lobe geometry and the stream trajectory derived for H0242 (see section 3.5). Also, the circle drawn on top of the H and FeII Doppler maps fits by eye the bulk of the accretion disk emission and corresponds to 0.55 of the white dwarf Roche lobe radius (). In the case of the HeII Doppler map we draw the circle at 0.76 , as derived from the computation in Sec. 3.5.
3.5 System parameters and geometry
In the present section we will make use of the previous observations and results to constraint the system geometry.
The continuum light curve at 5500 Å shows a 2 mag deep eclipse which is comparable to that observed in Z Cha and OY Car (e.g. Ritter and Kolb 2004). We infer, to first approximation, that the orbital inclination of H0242 must be similar to these two eclipsing systems, hence 82o.
Howell and Skidmore (2002) present a - relation which can be used to predict the mass of the secondary star in both the hypothesis of a pre- and post-orbital period minimum system. In particular, we found a secondary star of mass and radius in the case of pre- orbital period minimum system; while, a secondary star of mass and radius , in case of a system which has already evolved past the orbital period minimum.
Knowing the orbital inclination and the mass of the secondary star, we can solve for (the white dwarf mass), the secondary star mass function (i.e. equation 2.79 in Warner 1995). We derive a primary mass of either 0.64 or , depending on H0242 being a pre- or post-orbital period minimum system. The case seems unlikely both because of standard stellar evolution time scales (a star able to form a low mass WD of just 0.03 has not evolved off the main sequence, yet, within our galaxy), and the standard scenario for interacting binaries. Thus, we discard it and conclude that H0242 has not reached the orbital period minimum yet and is likely to have a white dwarf of mass 0.64 .
In the case of , the mass ratio will be , the binary separation is cm and the radius of the primary star Roche lobe is cm. Thus, the accretion disk radius (see Sec. 3.3) is times the size of the Roche lobe, and 0.38 times the star separation .
3.6 The iron lines and the Balmer decrement
As already pointed out, FeII emission are probably quite common in CVs, though, they have never been studied carefully. In particular, many times they have likely been identified either as HeI (due to limited spectral rage) or a combination of FeII and HeI. In the case of H0242, we see a multitude of FeII emissions and just weak HeI lines. Thus, it is reasonable to conclude that (at least for this system) the emission lines at 4924Å and 5018Å consist mostly of FeII transitions.
FeII emission in the optical were observed since the 70s in Seyfert 1 galaxies (see Osterbrock 1975 and Phillips 1977). The two mechanisms which are believed to produce optical FeII emissions in Seyfert 1 galaxies are: 1) the resonance fluorescence (e.g. Wampler & Oke 1967), and 2) the collisional excitation (e.g. Boksenber et al. 1975). In the first case the UV photons emitted by a hot source ( K) are absorbed by the iron peak elements mostly in the wavelength range 23002800Å. These UV absorption would be followed by downward transitions in the optical. In the second case the UV spectrum should be characterized by emission resonance lines in the UV region.
Now, the optical spectrum of H0242 shows emission lines from FeII 42, 49, 37 and 38 similar to what is seen in many Seyfert 1 galaxies. We do not have UV observation of H0242, still several DN systems have been observed by HST, and for at least some of them (OY Car, Horne et al. 1994; Z Cha, WZ Sge and V2051 Oph, Catalan et al. 1998) the observations of an iron curtain (the UV absorption of the iron peak elements) has been reported. It is thus reasonable to infer that H0242 UV spectrum is characterized by iron peak absorptions, and that the mechanism responsible for the observed optical FeII emission is indeed resonance fluorescence possibly from a disk wind. It would be interesting, now, to observe/recover high S/N spectra of DNe to search for FeII emission in order to both derive the fraction of DNe which show optical FeII emission lines and verify the formation of these FeII lines through the fluorescence mechanism. We are currently analyzing our database with such a purpose. Here, we can comment that the optical spectrum of WZ Sge in 2002 was showing FeII optical emissions (see Fig. 4 of Howell et al. 2002), while the same system was not showing optical FeII emission lines in 1996. This is perfectly consistent with the fact that WZ Sge underwent an outburst in 2001 and the idea that WD became hotter as a consequence of the accretion, exciting the FeII in an increased disk wind. It also matches the observation by Catalan et al. (1998) who report the weakest signature of iron curtain in WZ Sge (before the 2001 outburst).
| object | date | H/H | H/H | H/H |
|---|---|---|---|---|
| WZ Sge | 1996 | 3.82 | - | - |
| WZ Sge | 08/2002 | 1.33 | 0.75 | 0.61 |
| H0242 | 08/2002 | 1.10 | 0.77 | 0.74 |
| H0242 | 11/2003 | - | 0.59 | - |
In order to complete our comparison between H0242 and WZ Sge, we also compare the Balmer decrement in the two systems. Direct comparison is not simple/possible because of the different wavelength and phase coverages666Some of the data are in time resolved mode, while others consist of just a single spectrum. of the spectra in our hand. Still, we report in Table 3 the Balmer decrements measured in WZ Sge before the outburst (spectra from Mason et al. 2000) and after the 2001 outburst (spectrum from Howell et al. 2002) with the Balmer decrement of H0242-28 measured in 2001 (Howell et al. 2002) and in this work. From Table 3, it is clear that: i) the Balmer decrement in WZ Sge before the 2001 outburst was larger (and probably steeper) than after its outburst; ii) the Balmer decrement in H0242 is flatter than in WZ Sge (at least in 2002). We also note that in the 2003 spectra of H0242 there is little or no difference in the Balmer decrement resulting from the average spectrum and/or the time-resolved spectra (which exclude the hot spot). This implies that the opacity and probably the gas physics within the disk and the hot spot are similar. The conclusion is that the line forming region in the accretion disk of H0242 consists of gas which is optically thicker, thus, probably denser and/or warmer, than that in WZ Sge.
4 Summary and conclusions
We have presented time series spectra of the CV H0242. The object was identified as a CV candidate from an H-R band survey (Davenhall et al. 2001) and further suspected as a candidate TOAD by Howell et al. (2002). We determined the system orbital period of 107 min and showed evidence for a very deep eclipse in the light curve (Sec. 3.1), both reported also by Woudt et al. (2004). We infer an orbital inclination of 82o from the observed eclipse depth. We measured radial velocities of the Balmer lines and derived an approximate value for the white dwarf Keplerian velocity (Sec. 3.3). We constrained the secondary star on the basis of current evolution theory and derived the mass of the white dwarf through geometrical considerations (Sec.3.5). We found and for the mass of the secondary star and the white dwarf, respectively. We examined the line forming region within the accretion disk (Sec. 3.4 and 3.6), observing a multitude of FeII emission lines and a flat Balmer decrement.We note strong FeII emission in the optical spectrum and postulate that many other cataclysmic variables show it as well, but previous observations often lacked of either the proper wavelength coverage and/or sufficient S/N. We believe that the FeII lines are produced by the resonance fluorescence mechanism and, therefore, that the white dwarf has a relatively high effective temperature. From the Balmer decrement we also conclude that the gas both in the accretion disk and the hot spot is optically thick. The hot spot was found to not contribute significantly to both the Balmer and the FeII lines. On the contrary, we show evidence for pure hot spot emission in the HeII line 4684. We interpret the HeII emission as a signature of high temperature in the impact region, thus of high density gas within the accretion disk.
The results listed above clearly indicate that H0242 is a short orbital period system which has not yet evolved past the orbital period minimum. The accretion disk appearance (see trailed spectrograms, Doppler maps and Table 3) resemble that of a normal SU UMa star.
Acknowledgements.
The authors wish to thank the ESO Director for the generous allocation of time allowing these observations to be made.References
- (1) Boksenberg, A. , Shortridge, K., Fosbury, R. A. E., Penston, M. V., Savage, A., 1975, MNRAS, 172, 289
- (2) Catalan, M. S., Horne, K., Cheng, F. H., Marsh, T. R., Hubeny, I., 1998, Wild stars in the Old West, ASP Conference series, 137, 426
- (3) Davenhall, A. C., Clowes, R. G., Howell, S. B., 2001, The new era of wide field astronomy, ASP Conference series, 232, 314
- (4) Dubus, G., Taam, R. E., Spruit, H. C., 2002, ApJ, 569, 395
- (5) Gansicke, B. T., Hagen, H. J., Engles, D., 2002, The physics of cataclysmic variables and related objects, ASP Conference proceedings, 261, 190
- (6) Groot, P. J., Vreeswijk, P. M., Huber, M. E., Everett, M. E., Howell, S. B., and 9 coauthors, 2003, MNRAS, 339, 427
- (7) Horne, K., Marsh, T. R., Cheng, F. H., Hubeny, I., Lanz, T., 1994, ApJ, 426, 294
- (8) Howell, S. B., Szkody, P., Cannizzo, J. K., 1995, ApJ, 439, 337
- (9) Howell, S. B., Nelson L. A., Rappaport, S., 2001, ApJ, 550, 897
- (10) Howell, S. B., Harrison, T. E., & Szkody, P., 2004, ApJ, 602, L49
- (11) Howell, S. B., Skidmore, W., 2002, NewAR, 46, 801
- (12) Howell, S. B., Mason, E., Huber, M. E., Clowes, R. G., 2002, A&A, 395, L47
- (13) Howell, S. B., Henden, A. A., Landolt, A. U., Dain, C., 2004, PASP, 116, 527
- (14) Kolb, U., 2001, Astrophysical and Space Science Library, 264, 321
- (15) Mason, E., Skidmore, W., Howell, S. B., Ciardi, D. R., Littlefair, S., Dhillon V. S., 2000, MNRAS, 318, 440
- (16) Mason, E., Skidmore, W., Howell, S. B., Mennickent, R. E., 2001, ApJ, 563, 351
- (17) Osterbrock, D. E., 1975, ApJ, 203, 329
- (18) Phillips, M. M., 1977, ApJ, 215, 764
- (19) Richter, He., Wood, P.R., Woitke, P.R., Bolick, U., Sedlmayr, E., 2003, A&A, 400, 319
- (20) Ritter, H., Kolb, U., 2004, Cataclysmic Binaries, LMXBs, and related objects, VizieR On-line Data Catalog
- (21) Shafter, A. W., 1983, ApJ, 267, 222
- (22) Spruit, H. C., Taam, R. E., 2001, ApJ, 548, 900
- (23) Stellingwerf, R. F., 1978, ApJ, 224, 953
- (24) Szkody, P., Andreson, S. F., Agueros, M., Covarrubias, R., Bentz, M., and 26 coauthors, 2002, AJ, 123, 430
- (25) Tappert, C., 1999, Isolated emission sources in cataclysmic variables, PhDT, Ruhr-Universitat Bochum, Germany
- (26) Wampler, E. J., Oke, J. B., 1967, ApJ, 148, 695
- (27) Warner, B., 1995, Cataclysmic variable stars, Cambridge astrophysical series
- (28) Woudt, P.A., Warner B., Pretorius, M.L., 2004, MNRAS, 351, 1015