Discovery of the Binary Pulsar PSR B125963 in Very-High-Energy Gamma Rays around Periastron with H.E.S.S.
We report the discovery of very-high-energy (VHE) -ray emission of the binary system PSR B125963 / SS 2883 of a radio pulsar orbiting a massive, luminous Be star in a highly eccentric orbit. The observations around the 2004 periastron passage of the pulsar were performed with the four 13 m Cherenkov telescopes of the H.E.S.S. experiment, recently installed in Namibia and in full operation since December 2003. Between February and June 2004, a -ray signal from the binary system was detected with a total significance above . The flux was found to vary significantly on timescales of days which makes PSR B125963 the first variable galactic source of VHE -rays observed so far. Strong emission signals were observed in pre- and post-periastron phases with a flux minimum around periastron, followed by a gradual flux decrease in the months after. The measured time-averaged energy spectrum above a mean threshold energy of 380 GeV can be fitted by a simple power law with a photon index and flux normalisation . This detection of VHE -rays provides unambiguous evidence for particle acceleration to multi-TeV energies in the binary system. In combination with coeval observations of the X-ray synchrotron emission by the RXTE and INTEGRAL instruments, and assuming the VHE -ray emission to be produced by the inverse Compton mechanism, the magnetic field strength can be directly estimated to be of the order of 1 G.
Key Words.:
Gamma-rays: observations – Pulsars: individual: PSR B1259631 Introduction
PSR B125963 / SS 2883 is a binary system consisting of a 48 ms pulsar in orbit around a massive B2e companion star (Johnston et al., 1992a, b). The highly eccentric orbit of the pulsar places it just from the companion during periastron every 3.4 years. Be stars are known to have non-isotropic stellar winds forming an equatorial disk with enhanced mass outflow (e.g. Waters et al., 1988). In the case of PSR B125963, timing measurements suggest that the disk is inclined with respect to the orbital plane (Wex et al., 1998), probably because the neutron star received a substantial birth kick, causing the pulsar to cross the disk two times near periastron. These unique properties make the binary system PSR B125963 an excellent laboratory for the study of pulsar winds interacting with a changing environment in the presence of an extremely intense photon field. The synchrotron origin of optically thin unpulsed radio emission detected from this source, in particular during the periastron passage (e.g. Johnston et al., 1999; Connors et al., 2002), indicates acceleration of electrons to relativistic energies. The acceleration process has been argued to be most efficient when the pulsar passes through the equatorial disk (Ball et al., 1999). The basic features of such a system (“binary plerion”) in the context of higher energy X- and -radiation components have been comprehensively discussed by Tavani & Arons (1997).
The intense photon field provided by the companion star not only plays an important role in the cooling of relativistic electrons but also serves as perfect target for the production of high energy -rays through inverse Compton (IC) scattering (Tavani et al., 1996; Kirk et al., 1999; Ball & Kirk, 2000; Ball & Dodd, 2001; Murata et al., 2004). Some of these emission models predict wind powered shock acceleration of electrons to multi-TeV energies, radiating predominantly through the synchrotron and IC channels, with the main energy release in the X- and high energy -ray bands, respectively.
The unpulsed non-thermal X-ray emission detected from PSR B125963 throughout its orbital phase in 1992 to 1996 by the ROSAT and ASCA satellites (Cominsky et al., 1994; Kaspi et al., 1995; Hirayama et al., 1996) generally supports the synchrotron origin of X-rays. The spectrum of the synchrotron radiation seems to extend to hard X-rays/low energy -rays as shown by OSSE (Grove et al., 1995) and recently confirmed by observations with the INTEGRAL satellite (Shaw et al., 2004).
Since the companion star provides the dominant source of photons for IC scattering, the target photon density is well known throughout the entire orbit. Therefore, the ratio of X-ray flux to high energy -ray flux depends only on the strength of the ambient magnetic field. Although the latter can be estimated within a general magneto-hydrodynamic treatment of the problem, it contains large uncertainties which affect the estimate of the IC -ray flux as .
Kirk et al. (1999) studied the light curves of very-high-energy (VHE) -rays under the assumption of a dependence of the magnetic field which implies that the ratio of the energy density of the photon field to that in the magnetic field is independent of orbital phase. They also assumed that the position of the termination shock as well as the strength of the magnetic field is not affected by the disk of the B2e star. Under such assumptions, they predicted an asymmetric -ray light curve with respect to periastron (because of the inclination of the orbit with respect to the line of sight and the dependence of the inverse Compton -ray emissivity on the scattering angle), with an increase towards periastron and monotonic decrease after the passage of periastron. However, one might possibly expect significant deviation from such a simplified picture given the apparent strong impact of the disk on the pulsar wind termination as seen in the X-ray light curve (Tavani & Arons, 1997). Moreover, during the time periods of interaction of the pulsar wind with the equatorial disk one may expect, in addition to the IC -rays, a new component of -radiation associated with interactions of accelerated electrons and possibly also protons with the dense ambient gas (Kawachi et al., 2004). Up to now, the theoretical understanding of the properties of this complex system, involving pulsar and stellar winds interacting with each other, is quite limited because of the lack of constraining observations.
Nevertheless, the fortunate combination of: (1) the high spin-down luminosity of the pulsar, , which is partially converted into populations of ultra-relativistic particles, (2) the presence of the intense target photon field provided by the companion star with energy density (where is the spatial separation between the pulsar and the companion star), and (3) the relatively small distance to the source () makes this object a very attractive candidate for VHE -ray emission.
Previous observations of PSR B125963 in VHE -rays, apart from its periastron passage were performed using the CANGAROO I and CANGAROO II detectors, but did not result in significant signals and provided upper limits at of the flux from the Crab Nebula (see Kawachi et al., 2004, and references therein). The first significant detection in VHE -rays based on preliminary analysis results was reported in Beilicke et al. (2004) a few days prior to the periastron passage in February 2004 by the High Energy Stereoscopic System (H.E.S.S.) to allow for target of opportunity observations of other instruments. The analysis of the data from this initial detection and the data obtained in the subsequent H.E.S.S. observation campaign on PSR B125963 is presented in this paper.
2 VHE -ray Observations and Results
2.1 Observations and Analysis
The observations from February to June 2004 were performed with the High Energy Stereoscopic System (H.E.S.S.), consisting of four imaging atmospheric Cherenkov telescopes (Hinton, 2004) located in Namibia, at S E in 1800 m above sea level. Each telescope has a tesselated spherical mirror with 13 m diameter and area (Bernlöhr et al., 2003; Cornils et al., 2003) and is equipped with a camera of 960 -photomultiplier tubes providing a total field of view of in diameter (Vincent et al., 2003). During the stereoscopic observations, an array trigger requires the simultaneous detection of air-showers by several telescopes at the hardware level, allowing a suppression of background events (Funk et al., 2004).
All observations were carried out in moonless nights tracking sky positions with an alternating offset of typically in declination relative to the source (the wobble mode) in time intervals of 28 minutes duration. This allows to determine the background from the same field of view and one can omit off-source observations, effectively doubling the observation time. Due to the serendipitous discovery of another source in the field of view around PSR B125963 (see Aharonian et al., 2005a), for all observations subsequent to the 14th of May 2004 (MJD 53139) the array pointing was changed to a position ° north of PSR B125963 and an alternating wobble offset of ° in right ascension (instead of declination) was used.
The data set, selected on the basis of standard quality criteria, has a dead time corrected exposure (live time) of 48.6 h and a mean zenith angle of 42.7. The corresponding mean threshold energy defined by the peak -ray detection rate for a source with a Crab-like spectrum (Aharonian et al., 2000) after selection cuts was estimated to be 380 GeV. In the phase prior to the periastron passage (7.8 h live time), due to technical problems, data from only three telescopes were considered, and for the post-periastron phase (41.9 h live time) data from the full telescope array were used.
After the calibration of the recorded air shower data (Aharonian et al., 2004), each telescope image was parametrised by its centre of gravity and second moments (Hillas, 1985) followed by the stereoscopic reconstruction of the shower geometry providing an angular resolution of for individual -rays. The -ray energy was estimated from the image intensity and the shower geometry with a typical resolution of . In order to reject the vast background of cosmic-ray showers, -ray candidates are selected using cuts on image shape scaled with their expectation values obtained from Monte Carlo simulations. The cuts used for this analysis were optimised on simulations of a -ray point source with a flux level of 10% of the Crab Nebula VHE -ray flux, allowing 41.2% of the -rays to be retained while rejecting more than 99.9% of the cosmic-ray air showers. A more detailed description of the analysis techniques can be found in Aharonian et al. (2005b).
2.2 Detection
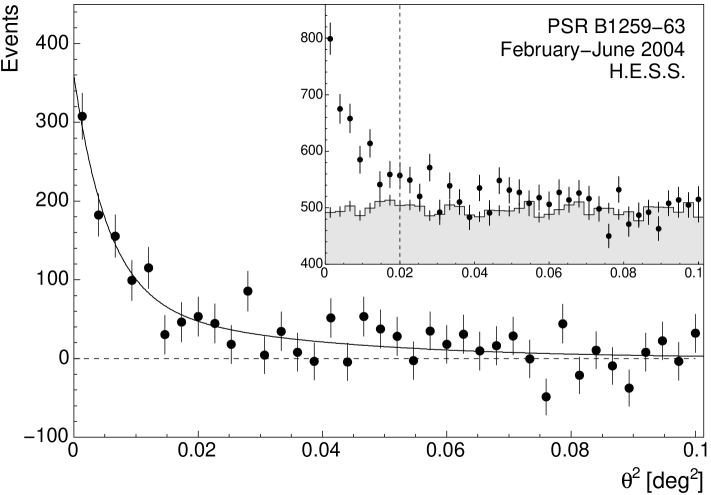
Figure 1 shows the distribution of the squared angular distance of excess events relative to the position of PSR B125963 for the whole data set. The circle with a radius corresponding to the angular cut in the field of view around the source position was considered as the on-region. The background was estimated from several non-overlapping circles of the same radius (off-regions) with the same angular distance from the camera centre, allowing corrections due to the varying camera acceptance to be omitted (Aharonian et al., 2001). The clear excess in the direction of the pulsar has a significance of 13.8 and is consistent with a distribution obtained from a simulated -ray point source. The -ray signal from the direction of PSR B125963 was detected in most of the darkness periods from February to June 2004, for which the results are summarised in Table 1.
| Period | |||||||
|---|---|---|---|---|---|---|---|
| 2004 | [h] | [] | |||||
| February | 3 | 7.9 | 9.8 | 691 | 2 591 | 0.172 | 24625 |
| March | 4 | 17.8 | 7.2 | 1 740 | 8 459 | 0.169 | 30743 |
| April | 4 | 5.1 | 7.8 | 644 | 2 705 | 0.167 | 19325 |
| May | 4 | 9.9 | 5.2 | 910 | 4 499 | 0.167 | 16031 |
| June | 4 | 9.1 | 1.8 | 722 | 4 027 | 0.167 | 5128 |
| Total | 49.8 | 13.8 | 4 707 | 22 281 | 0.168 | 95569 |
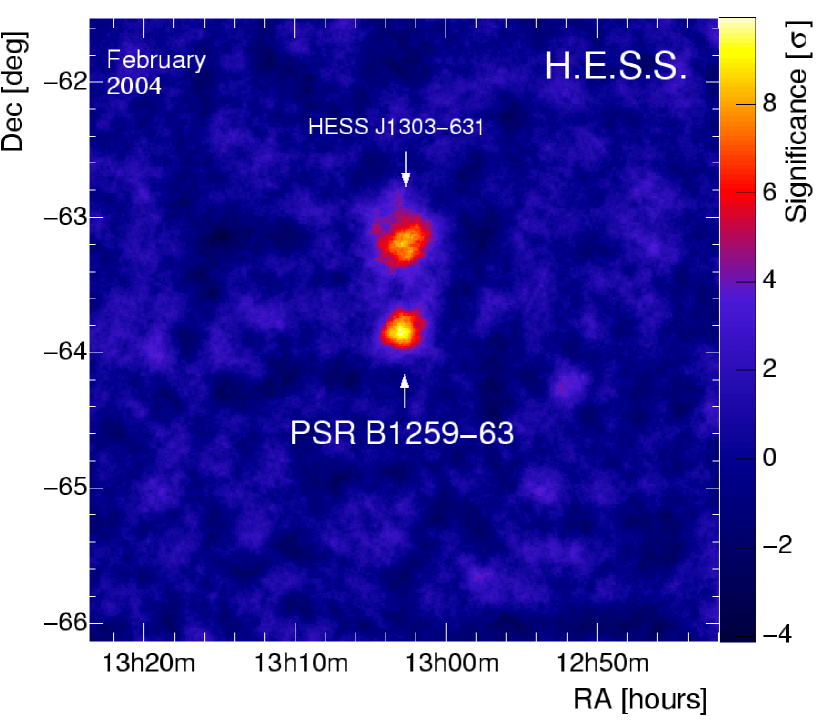
A 2D-analysis of the H.E.S.S. field of view around PSR B125963 was performed using the ring background technique as alternative background estimation method. In this method, for each bin, the number of on-events was derived by integrating the bin content within a circle of radius (on-region). The number of background events was estimated from a ring around the bin position with mean radius and an area 7 times larger than the area of the on-region. The normalisation was corrected for the decrease of the radial acceptance of the cameras towards the edge of the field of view. Figure 2 shows the significance sky-map of a field of view around PSR B125963 for the February data. The excess at the pulsar position (, with a significance ) is consistent with the excess given in Table 1. The additional broad excess north of the pulsar is the unidentified TeV source HESS J1303631 discovered in the same field of view (Aharonian et al., 2005a). The resulting bias in the background estimation due to both sources was corrected in the analysis by excluding events from a circle with radius around each source from the background estimation.
In order to derive the position of the pulsar excess and to check for possible source extension, the data was reanalysed using hard cuts requiring a minimal camera image intensity of 200 photo-electrons which significantly improves the angular resolution and drastically reduces the cosmic ray background at the expense of a higher energy threshold of 750 GeV. The uncorrelated two dimensional excess distribution for the whole data set was fitted assuming a radially symmetric, Gaussian source intensity profile
convolved with the point spread function of the detector. A possible bias from the second source within the field of view was corrected for by including an additional non-symmetric two dimensional Gaussian excess distribution in the fit, centred at the position of HESS J1303631 and allowing the orientation and width to vary freely. The resulting pulsar excess position of , is consistent with the position of PSR B125963 (, ) within statistical errors. The systematic uncertainty on the absolute pointing of the telescopes has been estimated in Gillessen (2003) to be . A limit for the source extension was found to be at confidence level which corresponds to 0.24 pc at an assumed distance of 1.5 kpc. Note that a possible source confusion with the variable hard X-ray source 1RXP J130159.6635806 (Kaspi et al., 1995), located southeast from the pulsar, can be firmly excluded.
2.3 Energy Spectra

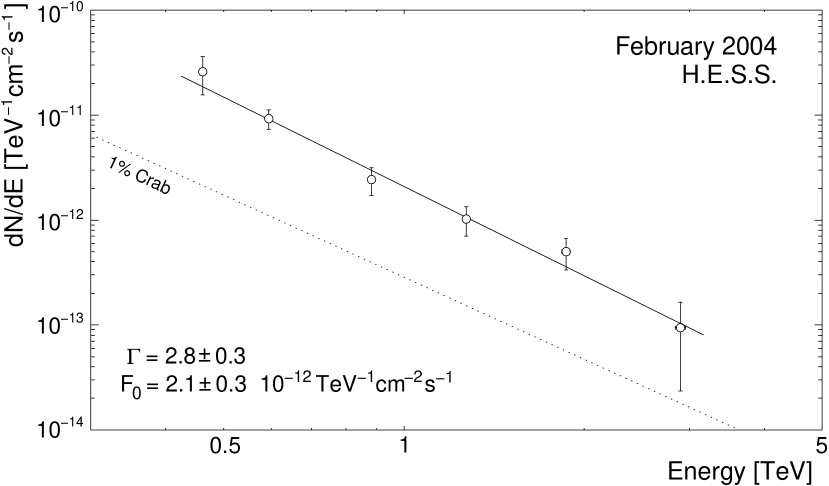
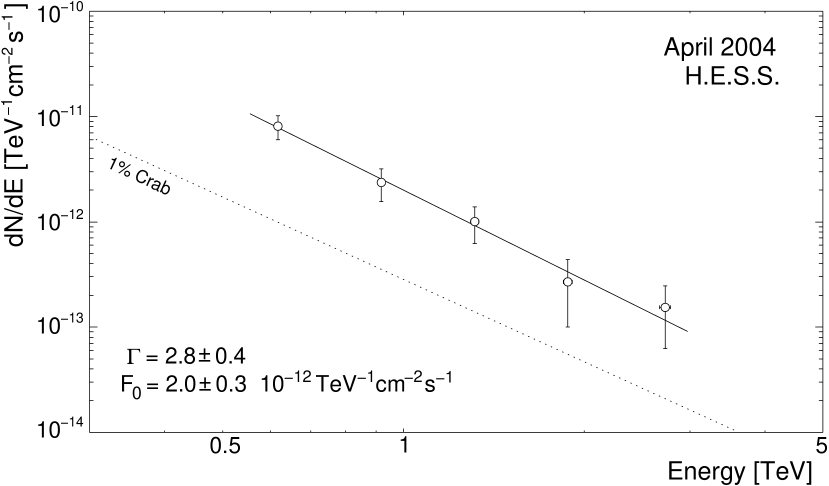
The measured differential energy spectrum derived from all darkness periods with a significant detection of the source (February to May) is shown in Fig. 3. A power-law fit
| (1) |
of this spectrum yields a photon index and . The integral flux above the mean threshold energy is , equivalent to of the Crab Nebula flux (Aharonian et al., 2000) above this threshold.
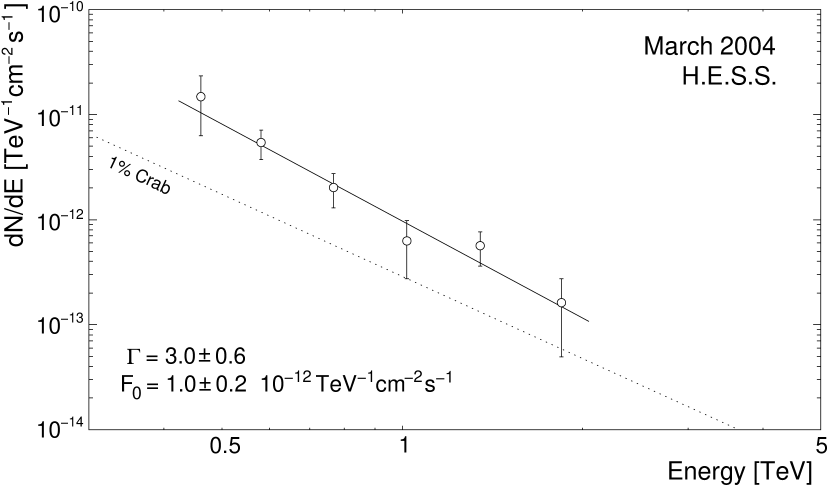
For each darkness period for which the significance of the observed -ray excess exceeded (February, March, and April) a differential spectrum was derived (see Fig. 4) and the results of the corresponding power law fit according to Eq. (1) are listed in Table 2. Within statistical errors, there is no indication of time variability of the photon index. However, the changing flux normalisation indicates source flux variability (see next section). Systematic errors were estimated to be and , dominated by the precision of the energy calibration of the instrument and variations in the atmospheric extinction of the Cherenkov light.
| Period | |||||
| 2004 | |||||
| February | 370 | ||||
| March | 420 | ||||
| April | 350 | ||||
| Overall∗ | 380 | ||||
| ∗ includes all data from February to May 2004 | |||||
2.4 Flux Variability
The daily integral flux of -rays above the mean threshold of 380 GeV is shown in Fig. 5 (lower panel). Since the spectrum cannot be derived on a daily basis due to limited statistics, the integral flux was obtained by integrating Eq. (1) assuming the spectral index of the time-averaged spectrum . The flux normalisation was calculated using the measured excess of -rays given by
with the daily live time as a function of the zenith angle , and the effective area after selection cuts obtained from simulations. Note that this method does not depend on the energy reconstruction and so the complete sample of excess events can be used. An alternative method, using the energy reconstruction to calculate the flux based on the effective area for each event above the energy threshold according to
with as the reconstructed energy and as the background normalisation, yields consistent results but introduces a bigger statistical error since only events above the threshold are considered.
The daily light curve in Fig. 5 clearly indicates a variable flux. This can be quantified by a fit of a constant flux to the data yielding a of 90.9 per 35 degrees of freedom corresponding to a probability of .
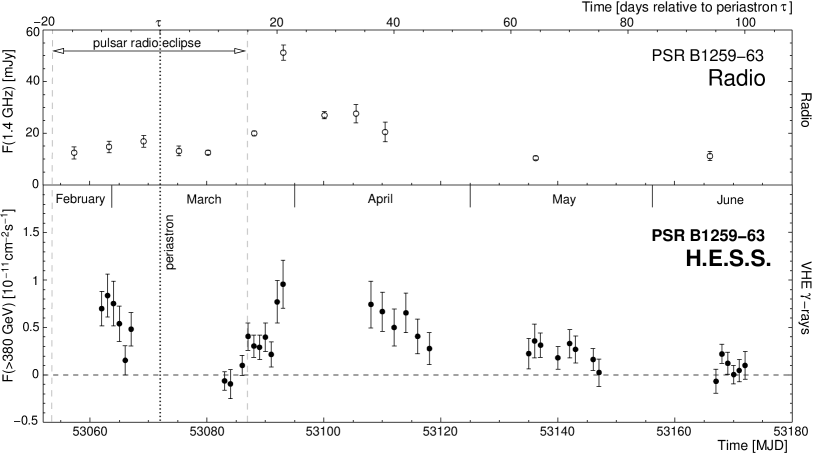
In order to investigate the flux trend in each darkness period, the individual light curves were fitted separately by a straight line and the significance for an increasing or decreasing flux is listed in Table 3. The low flux state after periastron is followed by a distinct rise beginning at days and a slow decrease until days where the observed excess is no longer significant.
| Period | |||||
| 2004 | |||||
| February | 2.2 | ||||
| March | 4.6 | ||||
| April | 1.8 | ||||
| May | 1.3 | ||||
| June | 0.2 | ||||
| ∗ 99% CL, calculated according to Feldman & Cousins (1998) | |||||
The upper panel of Fig. 5 shows the light curve of the transient unpulsed radio emission obtained from 2004 observations of PSR B125963 (Johnston et al., 2005) for the same time range as for the TeV band. There is some correlation visible between the radio and the TeV bands, especially a low flux state around periastron and a high flux state at days. The pulsed radio emission from the pulsar was eclipsed during the periastron passage (Johnston et al., 1992a), interpreted as due to scattering in the dense disk material and allowing the dates of the disk crossings to be estimated, in particular days and days for the 2004 periastron passage (Johnston et al., 2005). The observed dates of enhanced VHE -ray flux roughly correspond to orbital phases a few days after the assumed disk crossings. However, the coverage of the considered time interval by H.E.S.S. observations is limited and does not allow firm conclusions about VHE -ray flux maxima, especially pre-periastron.
3 Discussion and Conclusions
The detection of VHE -rays from PSR B125963 gives the first unambiguous and model-independent evidence of particle acceleration to multi-TeV energies in this unique binary system. The (most likely) synchrotron origin of X-rays (e.g. Tavani & Arons, 1997) also indicates the presence of ultra-relativistic particles, in the form of electrons, but other possible explanations of the X-radiation, e.g. due to the bulk motion Comptonisation of the stellar photons by the pulsar wind with a moderate Lorentz factor of 10–100 (Chernyakova & Illarionov, 1999), cannot be firmly excluded.
In contrast to the X-ray emission, the extension of the -ray spectrum to several TeV necessarily implies that the parent particles, electrons and/or protons, are accelerated to at least 10 TeV. The point-like feature of the detected signal constrains the extension of the -ray production region to . The information contained in the time variability of the signal on timescales of days provides a hundred times more stringent upper limit on the size of the -ray source of about .
The most likely scenario of particle acceleration and radiation in this system is a variety of the standard model of Pulsar Driven Nebulae (see e.g. Rees & Gunn, 1974; Kennel & Coroniti, 1984) which postulates that the deceleration of the ultra-relativistic pulsar wind (with a bulk motion Lorentz factor of –) by the pressure forces of the external medium enforces a termination shock. In this context electrons are accelerated to multi-TeV energies. These electrons radiate in the magnetic and photon fields in which they propagate and thus produce synchrotron and Inverse-Compton nebulae with a typical size exceeding 0.1 pc, commonly called plerions.
The mean energy flux contained in the VHE -ray emission derived from the time-averaged energy spectrum is which represents a -ray luminosity of for an assumed distance of the binary system of kpc. This corresponds to of the pulsar spin-down luminosity. Interestingly, this value matches the typical ratio between the pulsed and unpulsed component of X-ray radiation from isolated pulsars with associated pulsar wind nebulae and their spin-down luminosity (see e.g. Cheng et al., 2004), supporting the suggestion that the energy for the observed -rays is provided by the pulsar.
However, in the case of PSR B125963 both the spatial and temporal scales are expected to be rather different from those in plerions around isolated pulsars. Also, dynamical flow effects can play a different role since the pulsar moves through the stellar wind and the photon field of the massive companion star. Due to the high pressure of the stellar wind, the pulsar wind terminates very close to the pulsar and thus the electrons are accelerated well within the binary system. Moreover, because of severe adiabatic and radiative losses, the TeV electrons have a very short lifetime. As a result, the radiation is emitted in a rather compact region not far from the acceleration site, and for any given time the emission originates from a quite short sector of the pulsar trajectory.
In the following we summarise the physical processes expected to be at work, and put our observational results into this perspective.
3.1 Characteristic Cooling Times
The synchrotron loss time
| (2) |
of an electron with energy depends on the local magnetic field strength (where ) which is not known a priori. We shall estimate below by combining the INTEGRAL X-ray data and our H.E.S.S. TeV -ray data. In contrast, we can estimate the inverse Compton cooling rate of electrons with very good accuracy at any given time, i.e. at any location of the pulsar in its orbit (Tavani & Arons, 1997; Kirk et al., 1999).
Indeed, the inverse Compton losses are dominated by the scattering of electrons on the light of the companion star with luminosity and effective blackbody temperature . At any distance , the black-body radiation decreases by a factor of , where is the radius of the companion star. Thus at the distance of the pulsar to the star , the energy density of the radiation is
| (3) |
and correspondingly the electron cooling time is determined in the deep relativistic Klein-Nishina regime which applies here for TeV energies, given the high energies of the seed photons. For a Planckian seed photon spectrum, and using the formalism of Blumenthal & Gould (1970), one obtains
| (4) |
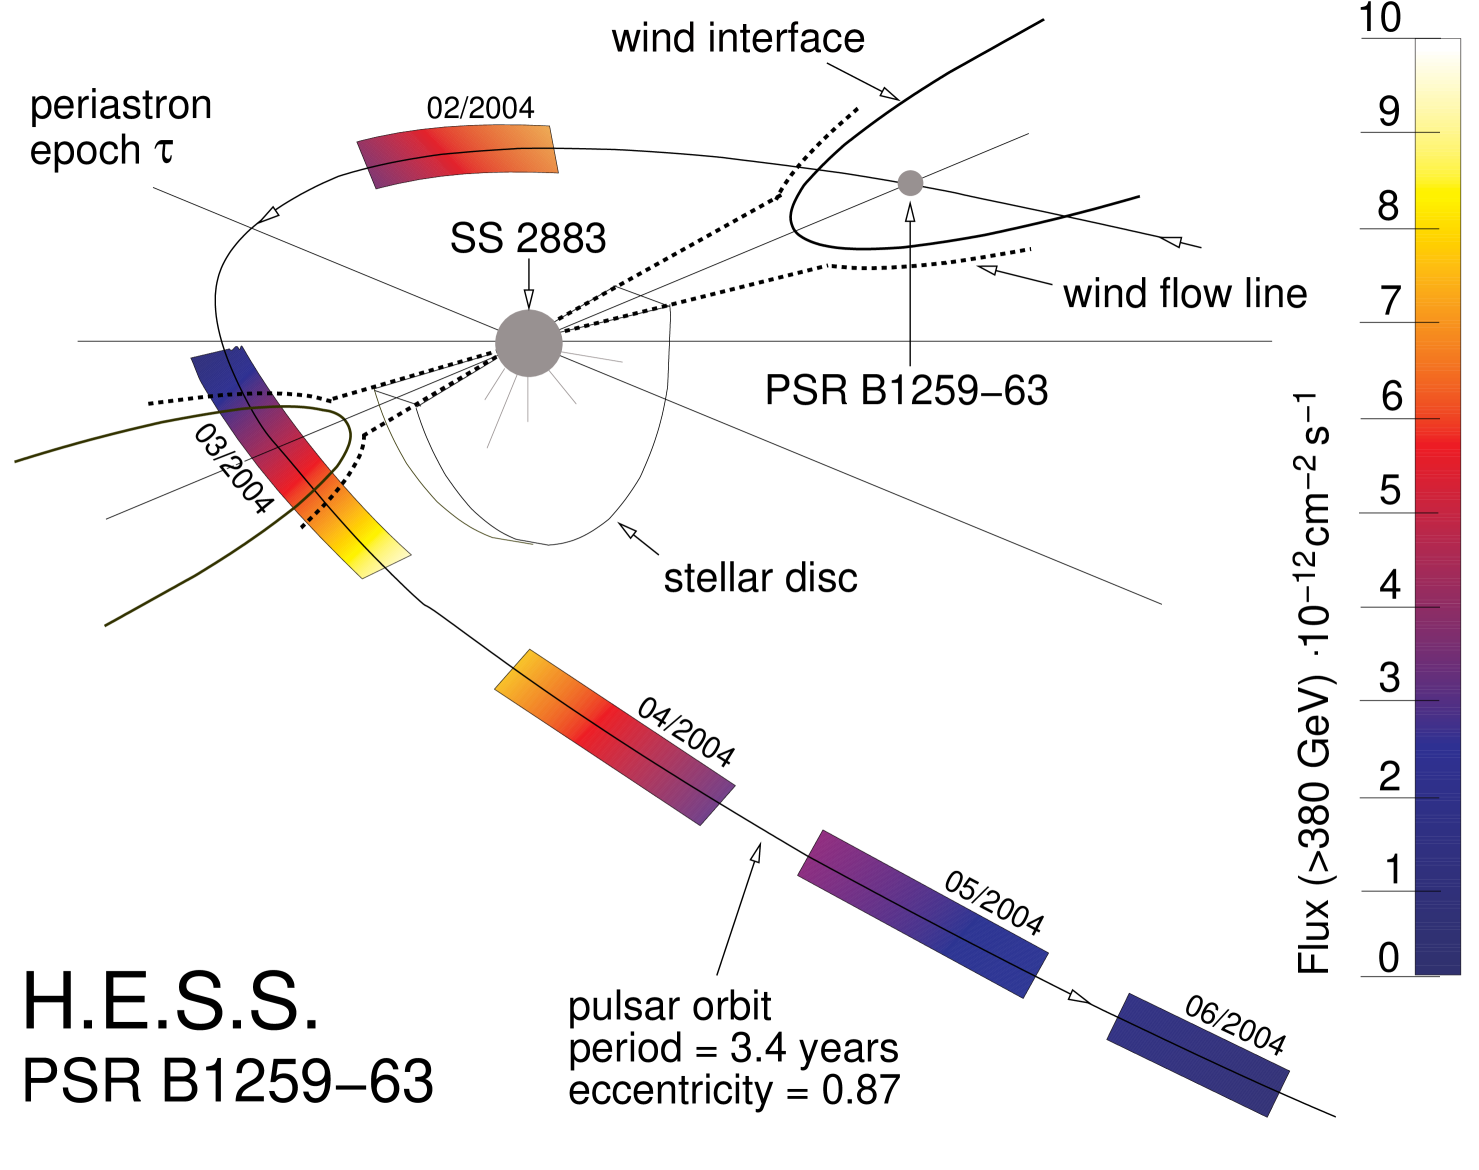
For PSR B125963, with its environment of a strong stellar wind and a strong radiative flow from the companion, we must in addition consider the adiabatic losses of the accelerated pulsar particles. This has already been noted by Tavani & Arons (1997). Indeed, the plasma flow beyond the pulsar wind termination shock differs strongly from the spherically symmetric configuration of an isolated pulsar in a static pressure environment. Rather than being decelerated in a spherically symmetric fashion while compressing the post-shock magnetic field, the actual flow will stagnate at the sub-stellar point at a distance cm and expand relativistically into the downstream direction, which roughly points away from the Be star. The surface of separation between the interior flow of the pulsar particles and the exterior stellar wind flow is indicated as “Wind interface” in Fig. 6.
The expansion of the relativistic, shocked pulsar wind gas will proceed with a flow velocity of magnitude , roughly equal to the relativistic magnetosonic speed , where , over a distance , where is a few . The factor ranges between and 1, if the direction of the postshock MHD flow ranges between a perpendicular and a parallel orientation with respect to the magnetic field direction, respectively. Assuming the pitch angle scattering mean free path of the accelerated pulsar wind particles to be small compared to , their adiabatic loss time is then given by
| (5) |
with , depending on the details of the post-shock MHD flow.
In this picture the adiabatic losses proceed about as fast as the synchrotron losses if G (compare with Eq. (2)) – while both are faster than the inverse Compton losses – and the energy spectrum of the radiating electrons is close to their source spectrum produced during acceleration at the termination shock. We shall consider neither electron Bremsstrahlung nor -ray production in interactions of relativistic protons with the ambient gas via decay of secondary -mesons (see e.g. Kawachi et al., 2004) here, since the accelerated pulsar wind particles are hydromagnetically constrained to the magnetic field lines of the pulsar outflow and will hardly interact individually with the stellar wind particles, except in a thin boundary layer at the Wind interface far downstream.
The missing quantity in our cooling considerations is the value of . We shall use the contemporaneous INTEGRAL results and our H.E.S.S. fluxes to estimate it as follows: Since there is little doubt that the detected TeV -rays are produced in the Klein-Nishina regime, we may conclude that they are emitted by electrons of the same energy, . This allows to set up a direct relation between -rays and X-rays produced by the same electrons,
| (6) |
The Compton losses with take place in a spatial region that is larger than that of synchrotron losses, and therefore adiabatic losses have already occurred there.
An experimental estimate of is possible by comparing the energy fluxes of the detected X- and -rays. The post-periastron data obtained in March by RXTE and INTEGRAL in the X-ray band from 1 keV to 100 keV (see Shaw et al., 2004) show a relatively flat spectral energy distribution at the level of . The VHE -ray flux for the same period was . This implies that in the TeV energy regime the synchrotron losses of electrons proceed an order of magnitude faster than the inverse Compton losses. Therefore, from the comparison of the synchrotron cooling time, given by Eq. (2), with the Klein-Nishina cooling time given by Eq. (4), and taking into account that two weeks after the periastron the separation between the pulsar and the companion star was approximately , we find
| (7) |
Our experimentally determined fields of the order of 1 G agree rather well with the theoretical estimate of the field derived from the MHD treatment of the pulsar wind (Tavani & Arons, 1997; Ball et al., 1999), and the value deduced from the observed unpulsed radio emission near periastron (Connors et al., 2002).
3.2 Spectral and Temporal Characteristics of the TeV Radiation
Let us assume that the accelerated electrons enter the -ray production region with a rate . As a consequence, in the case of dominant synchrotron or inverse Compton losses in the Thompson regime, a steeper electron spectrum is established in the -ray production region with power-law index , while dominating adiabatic (or Bremsstrahlung losses) will not change the initial electron spectrum, i.e. , both for .
Let us conversely assume that the radiating electrons have a power law distribution . Then the inverse Compton scattering in the Klein-Nishina regime leads to a -ray spectrum (Blumenthal & Gould, 1970)
| (8) |
Using the H.E.S.S. results, the photon index of the radiating electrons can therefore be estimated from the observed -ray spectrum with by equating it with the expected Klein-Nishina spectrum of Eq. (8). A more detailed numerical evaluation of the IC -ray spectrum shows that in our energy range the average photon spectral index can be approximated as . Therefore we find . In the scenario in which adiabatic losses dominate, this is, within errors, compatible with an acceleration process giving . If radiation losses dominate, this requires an injection spectrum significantly harder than .
The relevant photon spectral index range in the keV energy range from the 1994 ASCA observations (Hirayama et al., 1996), although not coeval, would also indicate a rather hard spectrum of the radiating electrons which would again be difficult to reconcile with dominant synchrotron cooling. This 1994 synchrotron photon spectral index is consistent with a preliminary spectral fit with derived from the coeval INTEGRAL observations (Shaw, 2004). In this paper we shall ultimately rely on the H.E.S.S. spectrum.
Within the scheme of dominant adiabatic cooling, the strong variability of the VHE -ray emission might be explainable by a varying spatial confinement of the accelerated pulsar wind particles by the kinetic and thermal pressure of the stellar mass outflow. In Figure 6 the variations of the measured VHE -ray flux are illustrated within the context of the orbital parameters and environment of the binary system with respect to the line of sight. The enhanced mass outflow in the equatorial disk will result in a more compact emission region – and therefore weaker adiabatic cooling – during the pulsar disk passages compared to the other regions of the orbit, in particular the periastron phase, where the expected stronger adiabatic cooling could lead to a minimum of the -ray flux. A second flow aspect would be a Doppler modulation due to the relativistic bulk flow velocity away from the stagnation point of the shocked pulsar wind. Considering Fig. 6, this could again lead to a flux minimum during periastron. However, a detailed consideration of this overall physical picture is beyond the scope of the present paper.
A minimum in the X-ray flux, observed for previous periastron passages, has been interpreted as being due to increased IC losses (Tavani & Arons, 1997). However, H.E.S.S. measurements indicate a minimum in the IC flux around periastron, which would rule out such an interpretation for this periastron passage. Unfortunately, due to the full moon and bad weather conditions we were not able to take data during the periastron passage of the pulsar.
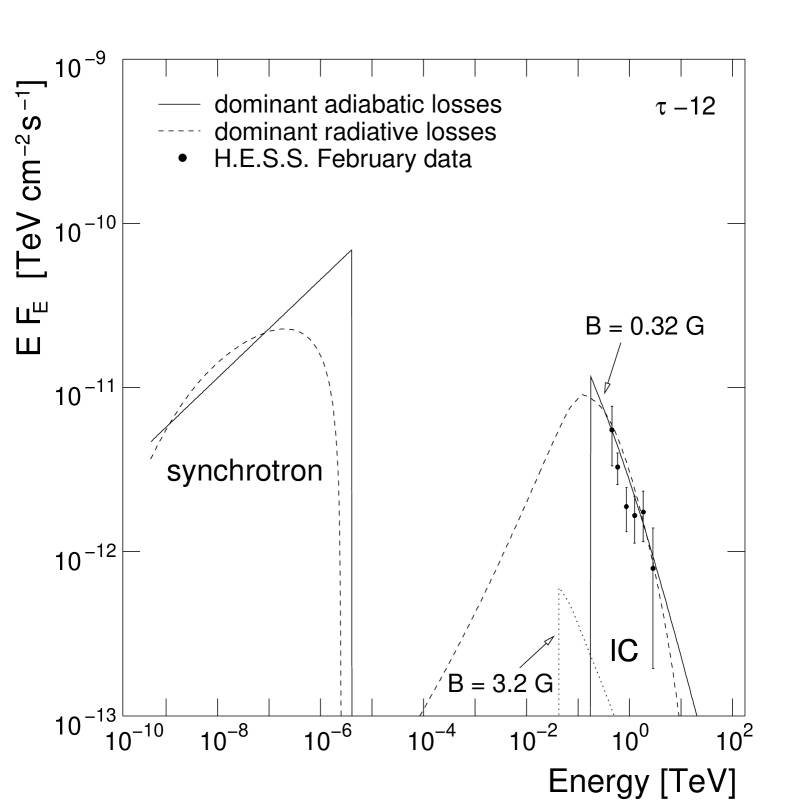
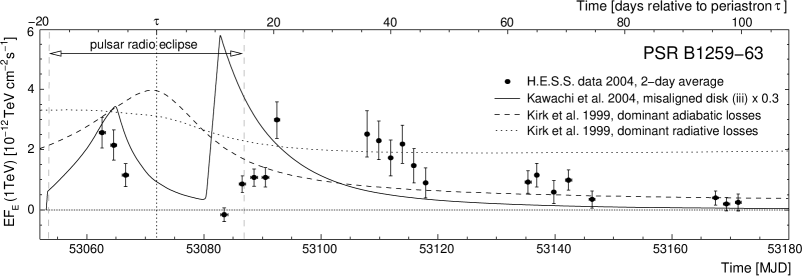
The predicted pre-periastron spectrum from Kirk et al. (1999) is compared to the corresponding H.E.S.S. data in Fig. 7. The model curves, taken from Kirk et al. (1999) (Figs. 2,6), were computed for the two scenarios of dominant radiative losses and dominant adiabatic losses, and matched the archival X-ray data for electron injection spectra with and , respectively. They agree well with the TeV data, assuming a magnetic field strength of G supporting the estimate of the order of 1 G obtained from the H.E.S.S. data. Despite the spectral agreement, the models fail to describe the TeV light curve as can be seen in Fig. 8 (dashed and dotted lines). In particular, neither the minimum around nor the high flux states before and after periastron are described by the model. This is perhaps not surprising, because the model assumed that the ratio between the energy densities of the magnetic field and the photon field does not change throughout the full orbit, and that the effects related to the pulsar passage through the stellar disk can be neglected.
Interestingly, the observed light curve seems to be qualitatively similar to the prediction made by the model of Kawachi et al. (2004) which is also shown in Fig. 8 (solid line). In this model, hadronic interactions and production in the misaligned stellar disk plays a dominant role in the -ray production mechanism. However, present data do not allow safe conclusions concerning the interpretation of the TeV light curve. Studies of the most interesting part of the pulsar orbit have to be postponed until multi-wavelength observations during periastron become possible.
In summary, the detection of VHE -ray emission from the binary pulsar PSR B125963 by H.E.S.S. provides the first model-independent evidence of particle acceleration in this object. The results clearly demonstrate the power of -ray observations for the study of the properties and the nature of high energy processes in this unique cosmic accelerator. Further observations at VHE -ray energies are necessary to derive spectra on a daily basis also during periastron passage.
Acknowledgements.
The support of the Namibian authorities and of the University of Namibia in facilitating the construction and operation of H.E.S.S. is gratefully acknowledged, as is the support by the German Ministry for Education and Research (BMBF), the Max Planck Society, the French Ministry for Research, the CNRS-IN2P3 and the Astroparticle Interdisciplinary Programme of the CNRS, the U.K. Particle Physics and Astronomy Research Council (PPARC), the IPNP of the Charles University, the South African Department of Science and Technology and National Research Foundation, and by the University of Namibia. We appreciate the excellent work of the technical support staff in Berlin, Durham, Hamburg, Heidelberg, Palaiseau, Paris, Saclay, and in Namibia in the construction and operation of the equipment. We also thank S. Shaw for informations on the photon spectral index from the INTEGRAL X-ray observations.References
- Aharonian et al. (2000) Aharonian et al. (HEGRA collaboration). 2000, ApJ, 539, 317
- Aharonian et al. (2001) Aharonian et al. (HEGRA collaboration). 2001, A&A, 370, 112
- Aharonian et al. (2004) Aharonian et al. (H.E.S.S. collaboration). 2004, Astropart. Phys., 22, 109
- Aharonian et al. (2005a) Aharonian et al. (H.E.S.S. collaboration). 2005a, “Serendipitous discovery of the unidentified extended TeV -ray source HESS 1303631 with the H.E.S.S. Cherenkov telescopes”, in preparation
- Aharonian et al. (2005b) Aharonian et al. (H.E.S.S. collaboration). 2005b, A&A, 430, 865
- Ball & Dodd (2001) Ball, L. & Dodd, J. 2001, Publications of the Astronomical Society of Australia, 18, 98
- Ball & Kirk (2000) Ball, L. & Kirk, J. G. 2000, Astroparticle Physics, 12, 335
- Ball et al. (1999) Ball, L., Melatos, A., Johnston, S., & Skjæraasen, O. 1999, ApJ, 514, L39
- Beilicke et al. (2004) Beilicke, M., Ouchrif, M., Rowell, G., & Schlenker, S. 2004, IAU Circ., 8300
- Bernlöhr et al. (2003) Bernlöhr, K., Carrol, O., Cornils, R., et al. 2003, Astropart. Phys., 20, 111
- Blumenthal & Gould (1970) Blumenthal, G. R. & Gould, R. J. 1970, Reviews of Modern Physics, 42, 237
- Cheng et al. (2004) Cheng, K. S., Taam, R. E., & Wang, W. 2004, ApJ, 617, 480
- Chernyakova & Illarionov (1999) Chernyakova, M. A. & Illarionov, A. F. 1999, MNRAS, 304, 359
- Cominsky et al. (1994) Cominsky, L., Roberts, M., & Johnston, S. 1994, ApJ, 427, 978
- Connors et al. (2002) Connors, T. W., Johnston, S., Manchester, R. N., & McConnell, D. 2002, MNRAS, 336, 1201
- Cornils et al. (2003) Cornils, R., Gillessen, S., Jung, I., et al. 2003, Astroparticle Physics, 20, 129
- Feldman & Cousins (1998) Feldman, G. J. & Cousins, R. D. 1998, Phys. Rev. D, 57, 3873
- Funk et al. (2004) Funk, S., Hermann, G., Hinton, J., et al. 2004, Astroparticle Physics, 22, 285
- Gillessen (2003) Gillessen, S. 2003, in Proc. 28th ICRC, Tsukuba (Univ. Academy Press, Tokyo), 2899
- Grove et al. (1995) Grove, J. E., Tavani, M., Purcell, W. R., et al. 1995, ApJ, 447, L113+
- Hillas (1985) Hillas, A. 1985, in Proc. 19th ICRC, La Jolla, 445
- Hinton (2004) Hinton, J. A. 2004, New Astronomy Review, 48, 331
- Hirayama et al. (1996) Hirayama, M., Nagase, F., Tavani, M., et al. 1996, PASJ, 48, 833
- Johnston et al. (2005) Johnston, S., Ball, L., Wang, N., & Manchester, R. N. 2005, MNRAS, 358, 1069
- Johnston et al. (1992a) Johnston, S., Lyne, A. G., Manchester, R. N., et al. 1992a, MNRAS, 255, 401
- Johnston et al. (1992b) Johnston, S., Manchester, R. N., Lyne, A. G., et al. 1992b, ApJ, 387, L37
- Johnston et al. (1999) Johnston, S., Manchester, R. N., McConnell, D., & Campbell-Wilson, D. 1999, MNRAS, 302, 277
- Kaspi et al. (1995) Kaspi, V. M., Tavani, M., Nagase, F., et al. 1995, ApJ, 453, 424
- Kawachi et al. (2004) Kawachi, A., Naito, T., Patterson, J. R., et al. 2004, ApJ, 607, 949
- Kennel & Coroniti (1984) Kennel, C. F. & Coroniti, F. V. 1984, ApJ, 283, 694
- Kirk et al. (1999) Kirk, J. G., Ball, L., & Skjaeraasen, O. 1999, Astroparticle Physics, 10, 31
- Li & Ma (1983) Li, T.-P. & Ma, Y.-Q. 1983, ApJ, 272, 317
- Murata et al. (2004) Murata, K., Tamaki, H., Maki, H., & Shibazaki, N. 2004, Advances in Space Research, 33, 601
- Rees & Gunn (1974) Rees, M. J. & Gunn, J. E. 1974, MNRAS, 167, 1
- Shaw (2004) Shaw, S. 2004, private communication
- Shaw et al. (2004) Shaw, S. E., Chernyakova, M., Rodriguez, J., et al. 2004, A&A, 426, L33
- Tavani & Arons (1997) Tavani, M. & Arons, J. 1997, ApJ, 477, 439
- Tavani et al. (1996) Tavani, M., Grove, J. E., Purcell, W., et al. 1996, A&AS, 120, C221+
- Vincent et al. (2003) Vincent, P., Denance, J.-P., & Huppert, J.-F. et al. 2003, in Proc. 28th ICRC, Tsukuba (Univ. Academy Press, Tokyo), 2887
- Waters et al. (1988) Waters, L. B. F. M., van den Heuvel, E. P. J., Taylor, A. R., Habets, G. M. H. J., & Persi, P. 1988, A&A, 198, 200
- Wex et al. (1998) Wex, N., Johnston, S., Manchester, R. N., et al. 1998, MNRAS, 298, 997