Properties of FIRBACK-ELAIS sources in the ELAIS N2 region
Abstract
We report on a search for the optical counterparts of 175 – selected sources from the Far–Infrared Background (FIRBACK) survey in the European Large Area ISO Survey (ELAIS) N2 field. Applying a likelihood ratio technique to optical catalogues from the Isaac Newton Telescope – Wide Field Survey (INT–WFS), we found optical identifications for 33 out of 55 FIRBACK sources in this field. These were then reassessed in the light of associations with the ELAIS final catalogue for the the N2 field, to yield a final set of 31 associations. We have investigated the nature of this population through a comparison of their observed spectral energy distributions (SEDs) with predictions from radiative transfer models which simulate the emission from both cirrus and starburst components. We find the far–infrared sources to be 80 per cent star bursting galaxies with their starburst component at a high optical depth. The resulting SEDs were used to estimate far–infrared luminosities, star formation rates, dust temperatures and dust masses. The N2 FIRBACK population is found to consist of four suspected ultra–luminous infrared galaxies (ULIRGs) with and , a number of luminous infrared galaxies (LIRGs) with moderate star formation rates and and a population of low redshift quiescently star forming galaxies. We also discuss the implications of these results for current evolutionary models.
keywords:
galaxies: evoluntion – galaxies: fundamental parameters – galaxies: starburst – infrared: galaxies – surveys1 Introduction
Evidence available in the 1960s and 1970s from regions of active star formation in nearby galaxies, and our own Milky Way, suggested that star forming galaxies would be strong sources of thermal infrared radiation, and implied that regions of dust and molecular clouds should be found within them (Sunyaev et al., 1978). It was then predicted that this dust reprocessed redshifted starlight from distant galaxies, would form a far–infrared background (FIRB) signal (Partridge and Peebles, 1967).
With the advent of the Infrared Astronomical Satellite (IRAS) in the 1980s hundreds of previously undetected galaxies were discovered, which emit up to 95 per cent of their total luminosity in the infrared (Soifer et al., 1987). This indicated significant dust reprocessing of their starlight and implied that star formation rates previously calculated from rest frame optical/uv luminosities were only a lower limit. Follow up redshift surveys, such as QDOT (Lawrence et al., 1999), showed that these galaxies were far more numerous in the past (e.g. Oliver et al. 1992), requiring stronger cosmological evolution than had previously been predicted by conventional models for the passive evolution of galaxies and providing support was building for models in which starbursts are important evolutionary mechanisms (Lonsdale et al., 1990).
The IRAS results allowed far tighter limits to be put on the level of the predicted far–infrared background. Hacking and Soifer (1991) predicted that the background should be detectable by the Cosmic Background Explorer satellite (COBE) at 100 and noted that discovering its exact level would allow further refinement of evolutionary models. No-evolution models placed a lower limit on the predicted background level, while detection of a strong background would indicate the existence of a population of objects with significant cosmological evolution. The FIRB was finally discovered by Puget et al. (1996) in the whole sky survey taken by FIRAS on COBE just as Hacking and Soifer (1991) had predicted.
Puget et al. (1996) found a signal which could be explained by the thermal emission from particles with temperatures of 20 and 12 K with emissivities of and 5 K with an emissivity of . This detection has fueled a new generation of galaxy evolution models but it is clear that to further differentiate between them we must understand the nature of the objects which contribute to the far–infrared background.
1.1 The Far–Infrared Background
The FIRBACK survey was carried out jointly with the ELAIS team at 175 using ISOPHOT (Lemke et al., 1996) on the Infrared Space Observatory (ISO) (Kessler et al., 1996). This survey aimed to resolve the FIRB into discrete sources and also allow studies of FIRB fluctuations. FIRBACK covered 3 main fields [South Marano, N1 and N2] covering a total area of 4 deg2. The final source catalogue contains 106 sources with fluxes between 180 mJy and 2.4 Jy and a supplementary catalogue containing 90 sources with fluxes 135-180 mJy (Dole et al., 1999, 2001). The northern fields lie within the previously defined ELAIS N1 and N2 survey regions whose selection was based primarily on their low Galactic cirrus emission (as quantified by IRAS 100 emission) and high visibility, given ISO’s orbit. This choice of fields allows multiwavelength follow–up thus providing a global view of galaxy evolution.
There have been several suggestions as to the nature of these 175 ISO sources. Two sources were examined in detail in the optical and near-IR by Chapman et al. (2002) who found two nearby () galaxies with characteristic temperatures of 30 K and 50 K and bolometric luminosities (40–200 ) of . These galaxies were classified as ULIRGs with morphologies suggesting the early stages of mergers adding weight to arguments for interactions sparking periods of increased star formation. A sample of ISO 175 sources were also examined at sub–mm and near-IR wavelengths by Sajina et al. (2003) who found a bimodal galaxy population: one population of normal star forming galaxies at and a second more luminous population at . There has been spectroscopic follow–up of the brightest 175 sources in the FIRBACK South Marano field (Patris et al., 2003) which were found to be nearby (), heavily extincted ( with extreme cases up to ), star forming galaxies with moderate star formation rates (a few 10 ). These were classified at LIRGs, with .
We have gone one step further by seeking associations for all 55 N2 ISO sources in the FIRBACK survey with optical sources from the INT–WFS catalogues in four bands (g’,r’,i’,Z), the other ELAIS survey wavelengths (J, H, K, 15, 6.7, 90 , 20 cm) and IRAS wavelengths (60, 100 ). (Also see Dennefeld et al. 2005 for investigations into sources in the N1 field). In doing so we are able to gain a multiwavelength view of the nature of these interesting objects. We have compared their SEDs with those predicted by the radiative transfer models of Efstathiou and Rowan-Robinson (2003) to provide further insight into their properties.
The layout of this paper is as follows: Section 2 describes the multiwavelength data, Section 3 discusses the methods of associating the multiwavelength data with the 175 ISO sources, provides a summary of the results of this process and briefly describes the optical properties of the sources. The radiative transfer models are described in Section 4 and Secton 5 describes the comparison of the sources’ SEDs with predictions from the models. The resulting star formation rates, far–infrared luminosities and dust temperature estimations are given in Sections 6 and 7. Section 8 provides a summary of current evolutionary models, while conclusions and a discussion are provided in Section 9. An Appendix provides details of individual associations.


2 Complementary Data
Optical associations were sought in r’ data from the INT–WFS (McMahon et al., 2001) which used the Wide Field Camera (WFC) on the 2.5 m Isaac Newton Telescope at the Observatorio del Roque de Los Muchachos (La Palma, Spain). The WFC is formed by four 4k x 2k CCDs. The arrays have 13.5 pixels corresponding to 0.33 arcsec/pixel at the telescope prime focus and each one covers an area on the sky of 22.8 arcmin x 11.4 arcmin. The total sky coverage per exposure for the array is therefore 0.29 deg2. Gaps between detectors are typically 20 arcsec and optical observaions are carried out allowing for a 10 per cent overlap between adjacent pointings for photometric purposes. The ELAIS-N2 optical field is approximately 9 deg2. The survey has a typical completeness limit of 23 mag (Vega) in wavebands U, g’, r’, i’ and Z. However, there are no U–band data for our sources the N2 field. All optical magnitudes were calculated directly from the INT–WFS data.
Associations were then sought with sources in the multiwavelength ELAIS band-merged catalogue at 6.7, 15 and 90 with associated data at U,g’,r’,i’,Z,J,H,K and 20 cm (Rowan-Robinson et al., 2004) which by then had become available. This was a survey carried out using ISO covering a total of 12 deg2 over five main fields, three in the north (N1, N2, N3) and two in the south (S1,S2). These areas were also surveyed at 20 cm with the Very Large Array (VLA) and AT. The separate wavebands making up the ELAIS survey each comprise an independent survey, the band–merged catalogue simply brings together the results of each of their final anayses, as described in Section 3.
Where detections were not found at 15 and 90 upper limits were extracted directly from the survey maps (Vaccari et al. 2004; Héraudeau et al. 2004) to a level using aperture photometry with an aperture size of 6 arcsec and 90 arcsec respectively. An aperture correction was applied to the 15 upper limits since 40 per cent of the point spread function (PSF) lies outside the aperture.
IRAS 100 and 60 fluxes or upper limits () were obtained at the galaxy optical positions using the IRAS Scan Processing and Inegration (SCANPI) internet facility111http://irsa.ipac.caltech.edu/applications/IRAS/Scanpi/ to provide extra constraints on the source SEDs.
Associations were also sought in the Submillimetre Common User Bolometer Array (SCUBA) 850 (Scott et al., 2002) and Max–Planck Millimeter Bolometer array (MAMBO) 1200 (Greve et al., 2004) catalogues within 10 and 3 arcsec of the optical position of the 175 counterpart, respectively. However, none were found for any of our 175 sources.
3 Identifications: method and results
The positional accuracy of the ISO 175 sources was determined using simulated maps by Dole et al. (2001). Since 93 per cent of artificial sources brighter than 180 mJy in the simulated maps were recovered within a radius of 50 arcsec, associations were sought for the N2 sources within a 90 arcsec radius. This ensured the capture within the source error circle of the true source position for even faint source IDs. Associations were made using a likelihood ratio technique described in full in Mann et al. (2002). In brief, the likelihood ratio is the ratio of the probability of finding the true counterpart to a particular source at the source position with that magnitude to the probability of finding an object of the same magnitude there by chance. In terms of flux this takes the form:
| (1) |
where q(f) is the flux probability distribution function for the source counterparts, e(x,y) is the probability distribution of positional offsets between the source and object and n(f) is the surface density of objects per unit flux interval. e(x,y) was taken to be a gaussian distribution with arcsec. This choice prevents too many objects being assigned moderate likelihood ratios, without excluding objects which should be considered or including objects which should not. The function q(f) is unknown for a new source population, as is the case here, and, as shown in Mann et al. (1997), an empirical estimate is very noisy for a small number of sources, q(f) was taken to be a constant. The probability, , that a fictitious, randomly-placed source would have a likeliest assocation with an optical object in the catalogue producing a likelihood ratio at least as high as the source-object pair in question was then calculated. Thus good associations have low values of , corresponding to a high probability that the association is correct. The object with the lowest was chosen as the source optical ID, with a cut off for non-association of . This is an arbitrary value chosen by inspection of the distribution, see Figure 1. It is expected (Mann et al., 2002) that true IDs will cluster at low values with a tail of objects reaching to high values due to sources without good associations in the optical catalogue, as seen in the plot.
Counterparts were also sought in the band-merged ELAIS multiwavelength catalogue (Rowan-Robinson et al., 2004) using a search radius of 60 arcsec consistent, with the band merging procedure used in the collation of this catalogue. The individual wavelength ELAIS catalogues were merged, taking into account the different positional accuracies of each catalogue, sequentially as follows. The 15 and 20 cm catalogues (Vaccari et al., 2004; Ciliegi et al., 1999) were first identified with optical objects from the INT–WFS catalogue (González–Solares et al., 2003) and then merged according to their optical positions using a search radius of 2 arcsec. These were then matched with the 6.7 catalogue using a search radius of 5 arcsec and those 6.7 sources not merged were associated with optical counterparts. These were then merged with the 90 and 175 sources (Héraudeau et al., 2004; Dole et al., 2001) using search radii of 30 arcsec and 60 arcsec respectively. Where these were matched with more than one catalogue entry the less probable assocations were flagged in the catalogue. After this those sources that were still unmatched were associated with optical counterparts. These optical counterparts were sought by Rowan-Robinson et al. (2004) independently from our work and the resulting optical IDs were then compared.
In summary, we sought associations on the basis of applying the likelihood ratio method to the optical data alone, then, with the availablility of the final band-merged ELAIS catalogue, we reassessed them. Our final optical and ELAIS wavelength ID list was drawn up using the following criteria:
-
1.
If our optical ID, selected using the likelihood ratio method, agreed with the ELAIS optical ID to which the 175 flux had been assigned then both the ELAIS optical ID and band-merged data were accepted.
-
2.
If the ELAIS optical ID had a (cut off value see earlier) for association with the 175 ISO source then the ELAIS optical ID and band-merged data were accepted.
-
3.
If our optical ID and ELAIS optical ID were in fact the same galaxy but had different entries in the INT–WFS catalogue due to the way the image analyser splits up bright galaxies into multiple sources, then the band-merged ELAIS data and optical ID were accepted.
-
4.
If our optical ID had but no optical ELAIS catalogue match then the source has optical and 175 data only (it may also have IRAS detections/upper limits and 60 and 90 upper limits)
-
5.
If our optical ID had the source has no association
For sources in the main N2 FIRBACK catalogue ( mJy), which contains 27 detections, we made 22 confident optical associations with galaxies, 7 of which agree exactly with the ELAIS optical ID (category i.) and 6 for which we accepted the ELAIS optical ID (categories ii. or iii.). Nine confident optical associations were made for sources in the supplementary catalogue ( mJy, 28 sources), 2 of which agreed with the ELAIS optical ID (category i.) and 2 of which where the ELAIS optical ID was accepted (categories ii. or iii.). There also were two sources in the supplementary catalogue with stellar IDs, one of which agreed with the ELAIS optical ID (category i.) and one of which was an accepted ELAIS optical ID (category ii. or iii.). The data for the identified sources are given in Table 1. and notes on individual sources are given in the Appendix, including values of any other plausible identifications.
The identified sources were morphologically classified by visual inspection. We used i’-band images from the INT–WFS, and followed the same classification method as Postman et al. (2005). The galaxies were classified using the classical Hubble sequence: E, E/S0, S0, S0/a, Sa, Sa/b, Sb, Sb/c, Sc, Irr. For the Advanced Camera for Surveys (ACS) on HST, for galaxies with redshift of around unity, visual classifications of this kind have a typical random error of 25 per cent, this reduces to 6 per cent when galaxies are classified in two broad cathegories: 1. early-type, 2. spirals and irregulars. These errors were estimated from the average scatter found in classifications by four ACS team members. The majority of our sources are spiral galaxies, we also have a number of S0 galaxies, 2 sets of interacting galaxies, 2 pairs and 2 irregulars, the morphology of 6 sources was unable to be deduced from the images.
| Table 1. Multiwavelength data for associated sources, fluxes in mJy. | ||||||||||||||
| nb. Sources listed with greater than the threshold 0.15 due to falling into category (iii) (see Section 3) | ||||||||||||||
| FN2 004 has since the associated galaxy is mistakenly classified as a star in the INT WFS catalogue. | ||||||||||||||
| FIRBACK | FIRBACK position | optical position | 175 | r’–mag | 15 | 6.7 | 60 | 90 | 100 | 20 cm | morphological classification | |||
| FN2 000 | 16 37 33 +40 52 26 | 16 37 34.53 +40 52 11.2 | 2377213 | 0.026 | 18.46 | 53.90.3 | 18.30.1 | - | 146136 | - | 8.740.02 | - | 0.03 | irregular or edge–on |
| spiral with tidal tail | ||||||||||||||
| FN2 001 | 16 35 08 +40 59 20 | 16 35 07.87 +40 59 28.9 | 1251139. | 0.002 | 18.28 | 26.10.4 | 4.110.12 | 0.150.03 | 33715 | - | 0.760.04 | 0.10 | 0.03 | edge–on |
| Sb/c | ||||||||||||||
| FN2 002 | 16 36 10 +41 05 16 | 16 36 08.15 +41 05 07.7 | 803102 | 0.086 | 19.33 | 8.90.1 | 2.30.1 | 0.410.02 | 61437 | - | - | 0.15 | 0.17 | irregular with |
| tidal tail | ||||||||||||||
| FN2 003 | 16 35 25 +40 55 51 | 16 35 25.22 +40 55 42.1 | 68292 | 0.001 | 17.45 | 13.90.1 | 5.50.1 | 0.190.03 | 41619 | - | 1.700.02 | 0.17 | 0.03 | Sa |
| FN2 004 | 16 34 01 +41 20 49 | 16 34 01.82 +41 20 52.5 | 66691 | 1.000 | 16.41 | 20.40.1 | 9.60.1 | 0.400.02 | 40326 | - | 1.80.02 | 0.05 | 0.03 | SBa |
| FN2 005 | 16 32 43 +41 08 38 | 16 32 42.39 +41 08 46.1 | 52278 | 0.011 | 18.67 | 6.10.2 | 2.10.1 | 0.160.03 | 39927 | - | 0.670.04 | 0.02 | 0.26 | Sa |
| FN2 007 | 16 35 45 +40 39 14 | 16 35 46.91 +40 39 03.4 | 31660 | 0.022 | 17.95 | 6.10.2 | 2.40.1 | 0.090.03 | 8425 | - | 0.920.02 | 0.02 | 0.12 | compact source |
| with 2 nuclei | ||||||||||||||
| FN2 008 | 16 35 47 +41 28 58 | 16 35 48.04 +41 28 30.3 | 29358 | 0.084 | 18.32 | 4.50.1 | 1.30.1 | 0.120.03 | 7418 | - | 0.380.01 | 0.10 | 0.14 | Sb |
| FN2 010 | 16 35 38 +41 16 58 | 16 35 36.16 +41 17 27.3 | 28557 | 0.451 | 19.47 | 2.80.6 | - | 0.060.03 | 74.0017 | - | 0.800.01 | 0.02 | 0.17 | pair: irregular with |
| tidal tail and Sa | ||||||||||||||
| FN2 011 | 16 38 07 +40 58 12 | 16 38 08.78 +40 58 07.4 | 26055 | 0.118 | 19.78 | 1.97 | - | 0.12 | 0.44 | 0.26 | - | 0.51 | - | Sa? |
| FN2 012 | 16 34 13 +40 56 45 | 16 34 11.98 +40 56 52.8 | 24954 | 0.088 | 19.99 | 2.70.1 | 1.00.1 | 0.08 | 8310 | - | 0.510.01 | 0.07 | 0.14 | Sa? |
| FN2 015 | 16 36 07 +40 55 37 | 16 36 07.71 +40 55 47.1 | 22351 | 0.015 | 18.64 | 5.50.1 | 1.20.1 | 0.06 | 10911 | - | 0.810.02 | 0.26 | 0.17 | interacting galaxies: |
| Sa/b and Sa | ||||||||||||||
| FN2 016 | 16 34 26 +40 54 07 | 16 34 23.90 +40 54 10.0 | 21851 | 0.191 | 19.88 | 3.10.1 | 1.00.1 | 0.060.03 | 0.25 | 0.200.08 | 0.550.01 | 0.10 | 0.13 | edge–on: |
| type not clear | ||||||||||||||
| FN2 017 | 16 34 44 +41 08 42 | 16 34 44.90 +41 08 20.6 | 21350 | 0.030 | 18.46 | 2.20.7 | - | 0.10 | 0.25 | 0.18 | - | 0.18 | - | interacting galaxies: |
| Sa with edge–on | ||||||||||||||
| FN2 018 | 16 33 38 +41 01 15 | 16 33 37.23 +41 01 09.1 | 21250 | 0.037 | 19.51 | 2.98 | - | 0.080.03 | 0.28 | 0.19 | - | 0.15 | - | S0/a |
| FN2 019 | 16 37 17 +40 48 36 | 16 37 16.80 +40 48 25.6 | 20549 | 0.001 | 18.05 | 3.99 | - | 0.060.04 | 0.26 | 0.18 | - | 0.10 | 0.03 | Sb |
| FN2 020 | 16 32 41 +41 06 10 | 16 32 40.50 +41 06 15.4 | 20149 | 0.086 | 20.21 | 6.58 | - | 0.07 | 0.25 | 0.11 | - | 0.15 | - | - |
| FN2 021 | 16 37 58 +40 51 21 | 16 37 59.39 +40 51 15.8 | 19649 | 0.001 | 17.57 | 2.18 | - | 0.07 | 0.19 | 0.17 | - | 0.10 | - | - |
| FN2 022 | 16 37 08 +41 28 26 | 16 37 08.21 +41 28 56.1 | 19048 | 0.140 | 18.80 | 2.50.1 | 1.70.2 | 0.10 | 0.28 | 0.23 | 0.560.02 | 0.05 | 0.17 | Sa |
| FN2 023 | 16 33 51 +40 49 44 | 16 33 51.65 +40 49 46.3 | 18848 | 0.018 | 19.04 | 2.50.7 | - | 0.11 | 0.28 | 0.32 | - | 0.02 | - | Sb/c |
| FN2 025 | 16 36 31 +40 47 38 | 16 36 31.23 +40 47 24.7 | 18448 | 0.119 | 20.24 | 2.10.7 | - | 0.110.03 | 0.33 | 0.110.07 | - | 0.20 | - | Sa |
| CFN2 029 | 16 34 20 +41 06 54 | 16 34 19.46 +41 06 37.8 | 17847 | 0.070 | 19.62 | 4.36 | - | 0.060.02 | 0.21 | 0.24 | - | 0.15 | - | - |
| CFN2 030 | 16 35 23 +40 38 42 | 16 35 22.81 +40 38 37.1 | 17847 | 0.086 | 20.26 | 3.66 | - | 0.060.03 | 0.24 | 0.170.05 | - | 0.15 | - | S0/a |
| CFN2 034 | 16 34 12 +40 46 26 | 16 34 12.52 +40 46 34.4 | 16646 | 0.030 | 19.42 | 2.61 | - | 0.08 | 0.11 | 0.10 | - | 0.55 | - | S0/a |
| CFN2 036 | 16 37 01 +40 43 08 | 16 36 59.92 +40 42 46.6 | 16546 | 0.119 | 19.40 | 5.08 | - | 0.040.03 | 0.25 | 0.28 | - | 0.10 | - | Sa |
| CFN2 038 | 16 34 32 +41 22 37 | 16 34 31.57 +41 22 45.7 | 16145 | 0.023 | 19.26 | 1.80.1 | - | 0.08 | 0.17 | 0.120.05 | 0.15 | 0.02 | 0.14 | Sb/c |
| CFN2 039 | 16 36 13 +40 42 25 | 16 36 13.65 +40 42 30.0 | 16045 | 0.001 | 17.15 | 5.90.2 | 2.50.1 | 0.110.00004 | 9021 | - | 0.880.01 | 0.02 | 0.07 | Sb |
| CFN2 044 | 16 37 26 +40 45 39 | 16 37 25.93 +40 45 37.1 | 15044 | 0.053 | 19.96 | 2.87 | - | 0.020.05 | 0.30 | 0.14 | - | 0.05 | - | S0/a |
| CFN2 047 | 16 34 51 +41 20 27 | 16 34 49.54 +41 20 49.2 | 14744 | 0.125 | 19.16 | 2.40.1 | 1.30.1 | 0.05 | 0.20 | 0.21 | 0.150.04 | 0.07 | 0.25 | S0/a |
| CFN2 049 | 16 37 42 +41 19 11 | 16 37 41.44 +41 19 14.8 | 14344 | 0.210 | 20.87 | 1.90.2 | - | 0.090.03 | 7424 | - | 0.15 | 0.51 | - | Sa? |
Figure 2 shows the optical (r’–band) magnitude distribution of the N2 175 ISO source optical counterparts compared to that of the overall INT-WFS catalogue. The source IDs are, in general, bright objects with apparent magnitudes ranging from 21 to as bright as 16.
Figure 3 shows the redshift distribution of the sources: they lie predominantly at with only two sources having . Redshifts are discussed in more detail in Section 5.
4 Radiative Transfer Models
It was initially attempted to fit the data to the GRASIL model SEDs of Silva et al. (1998). These provide six templates for nearby galaxies, three starbursts (Arp 220, M82 and NGC 6090) and three sprials (M100, M51 and NGC 6946). However, these templates did not describe the data well. Instead radiative transfer models of Efstathiou and Rowan-Robinson (2003) and Efstathiou et al. (2000) were employed to generate SED predictions for comparison with the data. These are able to model both cirrus and starburst emission or a combination of the two. The models used are briefly described below.
Ultraviolet to submillimetre emission from stars embedded in interstellar dust in galaxies known as the ’infrared cirrus component’ are modelled. The model consists of the input stellar radiation field, an interstellar dust model and the radiative transfer treatment of the interaction between the two which generates the output SED.
The input stellar radiation field is taken from the Galaxy Isochrone Synthesis Spectral Evolution Library (GISSEL, Bruzual and Charlot 1993 ). This gives the radiation from a mass of stars from the ultraviolet to near-infrared as a function of time.
Stars form in molecular clouds and at the early stages of their lives remain inside them during which time their radiation is absorbed by the dust and reprocessed to the infrared. During this phase of their life the model uses the code of Efstathiou et al. (2000) to compute the radiation emitted by stars and dust. The cloud is assumed to disperse years after star formation. Before this, however, due to non-spherical evolution of the cloud, a fraction of the starlight may have been able to escape without dust absorption. This occurs a time after star formation.
The radiation field within the galaxy is modelled to be due to a large number of randomly oriented molecular clouds whose average emission, for stars in the age range to years, is approximately
were is the emission from a giant spherical molecular cloud (Efstathiou et al., 2000) and is the emission from the stellar population (Bruzual and Charlot, 1993). The emission of stars younger than is simply and those older than years . The fraction of general starlight that escapes the galaxy unattenuated is also parameterised in a ’leak’ variable.
The dust temperature is determined by the intensity of the stellar radiation field and is characterised in the model by the ratio of the bolometric intensity of the radiation field to that in the stellar radiation field in the solar neighbourhood (Mathis et al., 1983) , . The star formation rate, , is assumed to have an exponential form with a time scale, , and a Salpeter IMF from M⊙.
In the case where a starburst is included the star formation rate is modified to
where is the ratio of the star formation rate at the peak of the starburst to that at time 0, is the age of the galaxy at the start of the starburst and is the exponential timescale of the starburst.
| starburst | non-starburst | |
| 8 Gyrs | 1 Myr | |
| galaxy age | - | |
| galaxy age | (universe age at z - 0.5 Gyrs) | |
| 40 Myrs | - | |
| leak | 0.0 | 0.1 |
| f | 1.0 | 1.0 |
| 20 Myrs | 3 Myrs | |
| 0–3 | 0–10 | |
| 50–200 | - | |
| 5 | 0.5-20.0 | |
| 1–100 | - | |
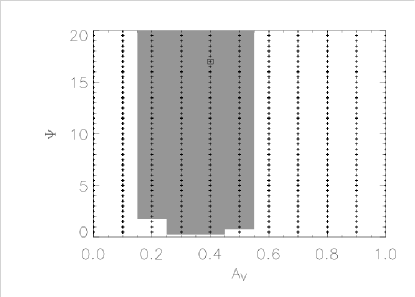
The interstellar dust model of Siebenmorgen and Kruegel (1992) is used, which models the effects of both small grains and PAHs. The opacity of the dust is characterised by , which controls the amount of UV to near-IR light absorbed by dust and re-emitted in the IR and sub–mm and therefore the ratio of the luminosity in these two bands. The model also has the ability to increase the dust extinction of the starburst component of the galaxy separately via the parameter , values of are suppported. In the starburst case a grid of models was produced over , and and for non-starburst galaxies a grid of models was produced over and . The values of the parameters used are given in Table 2.
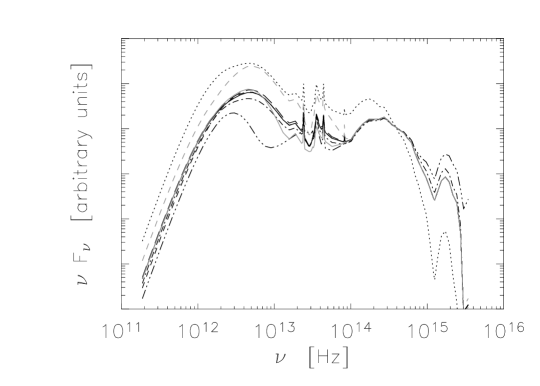
The effects of each of the model parameters on the resulting SED is shown in Figure 4. The solid black line shows an SED produced using the fixed parameters (, , Myrs, Myrs) and , , and for comparison. A model with increased dust extinction of is shown by the black dotted line: this increases the emission at longer wavelengths and decreases that in the optical, as would be expected. The dash-dot-dot-dot line shows a model with which dramatically changes the shape of the far–infrared peak due to the reduction in the amount of dust reprocessing of radiation from newly formed stars. However, any significant amount of time spent within a molecular cloud produces a far–infrared peak of shape similar to that of the other models shown. The peak of the SED is also increased significantly with an increase in the strength of the starburst, a model with is shown by the grey dashed line. The other parameters do not affect the resulting SED vastly, hence, there are degeneracies and a spread of parameter values may result in a very similar SED. This is evidenced by models with (dashed line), (dash-dot), Myrs (long dashes) and (solid grey line) all having very similar shaped SEDs. The parameter values chosen were in the mid-range of physically viable values as found by Efstathiou et al. (2000). The range covers values known to fit normal starbursts (Efstathiou et al., 2000) to heavily obscured starbursts such as Arp 220 , this range was also used by Farrah et al. (2003) to fit a number of ULIRGs.
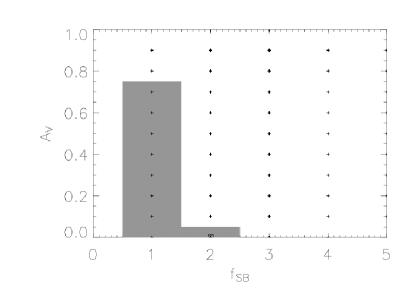
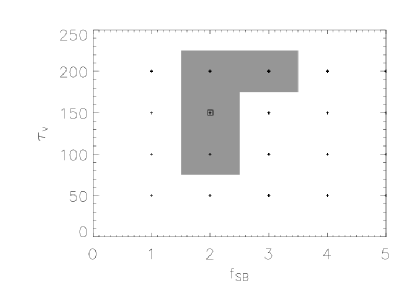
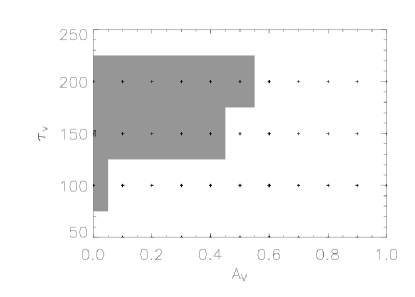
After fitting the models to the multiwavelength data, the parameter values for models within the confidence limit of the best-fitting model were examined. The limit for starburst model fitted SEDs typically encompasses , and . There is also a correlation between and such that models with higher values require low values to fit the data. This is due to an increase in each of the parameters increasing the height of the far–infrared peak (as shown in Figure 4), therefore when both the parameters have high values the height of the peak is over–estimated. We also note that it is difficult to constrain since we do not have data in the region of the spectrum which it most affects. For non-starburst fitted SEDs the confidence region includes and . We also note that since the effect of on the shape of the model SEDs is not marked, it is difficult to constrain this parameter and the confidence region encompasses the whole allowed parameter range. However, since it has little effect on the shape of the model SEDs this will not affect the property estimates calculated from the models. Examples of these confidence regions for both the starburst (FN2 008) and non-starburst (FN2 001) galaxies are shown in Figures 5 to 8.


N2 ISO 175 sources fitted model SEDs. Starburst models (solid line) and cirrus models (dashed line) are shown.

N2 ISO 175 sources fitted model SEDs. Starburst models (solid line) and cirrus models (dashed line) are shown.
5 Spectral Energy Distributions
We have compared the observed spectral energy distributions (SEDs) with predictions from the radiative transfer models of Efstathiou and Rowan-Robinson (2003) and Efstathiou et al. (2000) described in Section 4.
Spectroscopic redshifts were used in the fitting of the model SEDs, where available from the ELAIS catalogue (Rowan-Robinson et al., 2004) or elsewhere. In other cases photometric redshifts were drawn from the ELAIS catalogue, and calculated bespoke by ImpZ (Babbedge et al., 2004) for the remainder. We note that since photometric redshifts are typically accurate to about 10 per cent in , for the spectroscopic redshifts we have available this implies an accuracy of around 0.11 to 0.14. Therefore, given that the solutions are based on a maximum of four optical bands, the agreement between our photometric and spectroscopic redshifts is reasonable, the largest margin of error being about 20 per cent in . It is also important to note that there are no catastrophic outliers which can occur due to degeneracies in the solution space of photometric codes. These small redshift errors do not affect the fitted SEDs significantly and the resulting errors on derived properties are much smaller than those incurred by the error on the fitted SED value which are given for all derived quantities.
The N2 175 ISO source SEDs are shown in Figures 9 and 12. They appear to fall into two population categories, the first being star bursting galaxies with their starburst region at a high optical depth (fitted model parameters shown in Table 3 and SEDs plotted in Figure 9) and the second dust obscured galaxies with quiescent star formation (fitted model parameters shown in Table 4 and SEDs plotted in Figure 12).
| FIRBACK | |||
|---|---|---|---|
| FN2 002 | 0.4 | 2.0 | 150 |
| FN2 003 | 0.3 | 1.0 | 200 |
| FN2 004 | 0.0 | 1.0 | 200 |
| FN2 005 | 0.0 | 2.0 | 100 |
| FN2 007 | 0.2 | 2.0 | 200 |
| FN2 008 | 0.0 | 2.0 | 150 |
| FN2 010 | 0.3 | 3.0 | 200 |
| FN2 011 | 0.5 | 3.0 | 200 |
| FN2 012 | 0.0 | 3.0 | 100 |
| FN2 016 | 0.3 | 2.0 | 200 |
| FN2 017 | 0.4 | 1.0 | 200 |
| FN2 018 | 0.0 | 2.0 | 200 |
| FN2 019 | 0.0 | 1.0 | 200 |
| FN2 021 | 0.0 | 1.0 | 150 |
| FN2 022 | 0.1 | 1.0 | 150 |
| FN2 025 | 0.8 | 3.0 | 150 |
| CFN2 029 | 1.1 | 10.0 | 200 |
| CFN2 030 | 0.9 | 2.0 | 200 |
| CFN2 034 | 1.0 | 1.0 | 50 |
| CFN2 038 | 0.0 | 1.0 | 150 |
| CFN2 039 | 0.0 | 1.0 | 100 |
| CFN2 044 | 0.0 | 4.0 | 150 |
| CFN2 047 | 0.0 | 1.0 | 50 |
| CFN2 049 | 0.1 | 5.0 | 50 |
| FIRBACK | ||
|---|---|---|
| FN2 000 | 10.0 | 20.0 |
| FN2 001 | 0.4 | 17.0 |
| FN2 015 | 1.1 | 20.0 |
| FN2 020 | 3.7 | 0.5 |
| FN2 023 | 0.2 | 0.5 |
| CFN2 036 | 1.0 | 0.5 |

6 Star Formation Rates and Far–infrared Luminosities
Star formation rates for the sources were calculated using both an optical U-band estimate (Cram et al., 1998) and a FIR estimate (Kennicutt, 1998), given in equations 2 and 3.
| (2) |
| (3) |
Where LU is the U-band luminosity, estimated through interpolation of the SED models and is the integrated infrared luminosity over 8–1000 . These both assume a Salpeter IMF. The chosen IMF affects the estimated star formation rates since we integrate over only a portion of the luminosity of the galaxy’s constituent stars. The proportion of stars emitting with luminosities in the range in question will depend on the initial mass function, since it describes the initial distribution of stellar luminosities over the range, as discussed by Mann et al. (2002). The star formation rates for individual sources can be seen in Table 5. The distribution of FIR star formation rates and a comparison between those estimated using both the FIR and U–band luminosities can be seen in Figure 13. There is a large spread in star formation rates with a number of galaxies with SEDs suggestive of a modest starburst. This implies that these galaxies are of low mass since their existing stellar population is dominated by the small starburst at infrared wavelengths. Using star formation rates estimated for SED models falling in the range (see Section 4) the U–band and FIR SFRs are estimated to be accurate to 25 per cent and 50 per cent respectively. It can be seen in the lower pannel of Figure 13 that the FIR star formation rate estimates are significantly higher, typically by a factor of 4, than those using the U–band estimate. This is to be expected for such highly obscured objects.
The integrated far–infrared luminosities over the wavelength range 8-1000 were estimated. Results can be seen in Table 5 and a distribution in Figure 14. These are estimated to be accurate to approximately 25 per cent.
| FIRBACK | U–band SFR | FIR SFR | ||
|---|---|---|---|---|
| L⊙ | ||||
| FN2 002 | 36.9 | 93.1 | 0.17 | |
| FN2 003 | 3.8 | 3.6 | 0.03 | |
| FN2 004 | 9.4 | 5.4 | 0.03 | |
| FN2 005 | 131.4 | 169.1 | 0.26 | |
| FN2 007 | 22.3 | 39.5 | 0.12 | |
| FN2 008 | 24.4 | 27.3 | 0.14 | |
| FN2 010 | 21.7 | 88.9 | 0.17 | |
| FN2 011 | 104.8 | 391.9 | 0.51 | |
| FN2 012 | 6.3 | 13.1 | 0.14 | |
| FN2 016 | 12.6 | 25.6 | 0.13 | |
| FN2 017 | 32.5 | 28.1 | 0.18 | |
| FN2 018 | 8.4 | 12.2 | 0.15 | |
| FN2 019 | 1.7 | 1.0 | 0.03 | |
| FN2 021 | 7.9 | 4.8 | 0.10 | |
| FN2 022 | 32.6 | 22.3 | 0.17 | |
| FN2 025 | 5.8 | 39.7 | 0.20 | |
| CFN2 029 | 0.1 | 7.2 | 0.15 | |
| CFN2 030 | 3.2 | 16.8 | 0.15 | |
| CFN2 034 | 138.2 | 296.6 | 0.55 | |
| CFN2 038 | 25.6 | 11.6 | 0.14 | |
| CFN2 039 | 7.7 | 4.1 | 0.07 | |
| CFN2 044 | 0.4 | 1.8 | 0.05 | |
| CFN2 047 | 63.2 | 27.2 | 0.25 | |
| CFN2 049 | 49.1 | 252.8 | 0.51 | |
| FN2 000 | 2.8 | 7.9 | 0.03 | |
| FN2 001 | 9.3 | 1.7 | 0.03 | |
| FN2 015 | 29.1 | 18.8 | 0.17 | |
| FN2 020 | 3.0 | 7.5 | 0.15 | |
| FN2 023 | 1.1 | 0.1 | 0.02 | |
| CFN2 036 | 4.3 | 2.5 | 0.10 |
7 Dust Temperatures and Masses
The dust in the galaxy radiative transfer models is at a range of temperatures, however, we computed an emission-weighted estimate via the fitting of a grey body to the far–infrared portion of the SED (from the peak of the SED to 1000 ) as follows:.
| (4) |
In equation 4 T is the dust temperature which controls the position of the maximum of the long wavelength SED, is the frequency dependence of the dust grain emissivity and controls the gradient of the long wavelength slope of the grey body curve. Fitting over this wavelength range allows us to constrain both the temperature and , without reaching the far–infrared where the dust may go optically thick and no longer be well described by a greybody model. The derived values for the sources can be seen in Table 6. Using the method described above (Section 6) for the starburst models these are estimated to be accurate to T3 K and , in the non-starburst case these estimates are accurate to T14 K and .
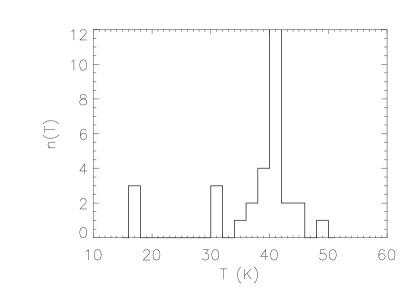
The distribution of the dust temperatures for the N2 175 ISO source galaxies is shown in Figure 15. The starburst galaxy dust temperatures are slightly higher than those found by Sajina et al. (2003) ( K) for a sample of N1 ISO 175 sources but have similar emissivity coefficients: Sajina et al. (2003) found .
Dust masses were estimated using the submillimetre prescription (Hildebrand, 1983) at a rest wavelength of 450 :
| (5) | |||||
| (6) |
where and are the observed and rest frame frequencies respectively, is the observed flux at , estimated through interpolation of the SED models, and is the Planck function in the rest frame. and are the dust temperature and dust grain emissivity estimated via the greybody fitting. is known as the mass absorption coefficient and has units of . This approach assumes that the galaxy is optically thin at submillimetre wavelengths. Resulting dust masses, calculated at a wavelength of 450 (accurate to approximately 25 per cent), are shown in Table 6. We note that the dust masses follow the trend of the far–infrared luminosities and star formation rates, those with high SFRs and having larger dust masses.
| FIRBACK | T (K) | ||
|---|---|---|---|
| FN2 002 | 40 | 1.4 | |
| FN2 003 | 36 | 1.5 | |
| FN2 004 | 41 | 1.9 | |
| FN2 005 | 40 | 1.9 | |
| FN2 007 | 42 | 1.5 | |
| FN2 008 | 39 | 1.9 | |
| FN2 010 | 45 | 1.4 | |
| FN2 011 | 41 | 1.4 | |
| FN2 012 | 39 | 1.9 | |
| FN2 016 | 42 | 1.4 | |
| FN2 017 | 36 | 1.4 | |
| FN2 018 | 39 | 2.0 | |
| FN2 019 | 41 | 1.9 | |
| FN2 021 | 41 | 1.9 | |
| FN2 022 | 41 | 1.6 | |
| FN2 025 | 40 | 1.3 | |
| CFN2 029 | 49 | 1.2 | |
| CFN2 030 | 38 | 1.3 | |
| CFN2 034 | 35 | 1.1 | |
| CFN2 038 | 40 | 1.9 | |
| CFN2 039 | 40 | 1.9 | |
| CFN2 044 | 41 | 1.9 | |
| CFN2 047 | 41 | 1.7 | |
| CFN2 049 | 44 | 1.5 | |
| FN2 000 | 31 | 1.9 | |
| FN2 001 | 30 | 1.9 | |
| FN2 015 | 31 | 1.9 | |
| FN2 020 | 17 | 1.8 | |
| FN2 023 | 16 | 2.0 | |
| CFN2 036 | 17 | 1.8 |


8 Evolutionary Models
The detection of the far–infrared background in 1996 led to a re–evaluation of galaxy evolution models. One of the earliest new models to emerge was that of Burigana et al. (1997) which used the FIRB to place constraints on models for the cosmic star formation history and therefore the production of the background signal. This paper concluded that stellar nucleosynthesis is able to account for a FIRB intensity not far from the upper limit set by the COBE detection. It also suggested substantially higher star formation rates at higher redshifts than suggested by optical data.
It is now fairly well established that infrared–selected galaxies undergo extremely high rates of evolution compared to measurements at other wavelengths over the approximate redshift range . Chary and Elbaz (2001) models imply that about 80 per cent of the cosmic infrared background was produced between compared to only 30 per cent of the 850 background. Also the dust enshrouded star formation rate peaks at at a value of and at least 70 per cent of this star formation takes place in infrared luminous galaxies with . In fact per cent of 15 sources examined by Elbaz et al. (2002) were found to be in this category of luminous infrared galaxies and have star formation rates of . The comoving density of infrared light due to these galaxies was over 40 times larger at than it is today.
Models of the cosmic infrared background produced by Lagache et al. (2003), that are able to fit number counts and unresolved anisotropies imply that the luminosity function must change dramatically with redshift. These also show rapid evolution of high luminosity sources up to z=1. It has been suggested that this strong evolution is due to bimodal star formation, one long lived quiescent, passive phase and one enhanced starburst phase triggered by interactions and mergers (e.g. Lagache et al. 2003, Franceschini et al. 2001). Franceschini et al. (2001) also suggest that the interpretation of evolution with redshift could be biased due to an increase in the probability of detecting a galaxy during an active phase caused by both an increase of the rate of interactions, in part due to the geometry of the expanding universe, and an increase of the infrared luminosity due to more abundant fuel available in the past.
However, Chapman et al. (2002) point out that at the coldest and most dusty galaxies will have the greatest flux densities for an equivalent infrared luminosity. At the FIRBACK 175 detection will lie bluewards of the peak in the restframe black body spectrum and dust temperatures of K will no longer have significant effects on the observed flux. Therefore at higher redshifts, the flux limited FIRBACK survey will be biased towards cooler galaxies.
Models such as Franceschini et al. (2001) and Chary and Elbaz (2001) do not explicitly incorporate such cold luminous galaxies which are preferentially selected in our survey for . Chapman et al. (2002) examined two of the 175 selected ISO sources and indentified them as unusually cold ULIRGs with dust temperatures of K which is significantly lower than the usual ULIRG dust temperature of K. Cold, dusty yet luminous objects suggest large masses of dust heated at a moderate intensity. The existence of such sources may seriously affect the interpretation of SCUBA sources if they are numerous at high–z. Since many models rapidly evolve a hot ULIRG population to the local luminosity function they may predict a false redshift distribution if these cold sources are not considered.
9 Discussion and Conclusions
We have found bright galaxy optical identifications for 31 out of the 55 N2 ISO 175 sources and stellar identifications for 2 sources. 17 of those with galaxy optical IDs were associated with sources from the band-mergerd ELAIS catalogue. We then compard the spectral energy distributions of the sources with predictions from the radiative transfer models of Efstathiou and Rowan-Robinson (2003) and Efstathiou et al. (2000).
22 of the 175 sources have not been confidently associated with optical counterparts and therefore their nature is still unknown. However, only 4 of these sources are in the main FIRBACK catalogue, the remaining 18 are listed in the complementary catalogue which contains detections at lower signal to noise and therefore they may just be spurious detections. However, these could also be due to sources having multiple IDs or them being associated with heavily extincted objects which were not in the optical catalogue.
24 galaxies have been classed as star bursting. They have a range of far–infrared luminosities from to corresponding to a range of star formation rates from to . Although those at the lower end of this range are not forming stars at a dramatic rate their small starburst component is dominating over the existing population at far–infrared wavelengths. This implies that the 175 FIRBACK sample contains a significant number of low mass galaxies. The majority of these galaxies are spirals and a number are S0 galaxies.
Sources FN2 005, 011, CFN2 034 and CFN2 049 have and high star formation rates, we therefore suggest that these are in the low redshift tail of the rapidly evolving ULIRG population. This is in agreement with the findings of Sajina et al. (2003) who found one sixth of their 175 sample to fall into this category. We also suggest that those galaxies with moderate star formation rates and far–infrared luminosities of at moderate z () are LIRGs (FN2 002, 007, 008, 010, 016, 017, 022, 025 and CFN2 047). Those with are more normal galaxies perhaps with lower masses (FN2 003, 004, 012, 018, 019, 021, CFN2 029, 030, 038, 039, 044).
The estimated dust temperatures of the starburst galaxies are 30-49 K which is relatively low compared to that of standard ULIRGs which have K. The most luminous of these galaxies also have large dust masses adding weight to the suggestion that cold, dusty, luminous objects have large masses of dust heated at a moderate intensity (Chapman et al., 2002).
A further 6 sources have non-starburst SEDs. These sources have far–infrared luminosities of and star formation rates of . We suggest that these are quiescently star forming galaxies (FN2 000, 001, 015, 020, 023, 036). These galaxies have low dust temperatures of K and dust masses of . 3 of these galaxies are spirals, 1 is an intereacting galaxy pair, 1 is either an irregular or a spiral with tidal tail and the morphology of the remaining source was unable to be deduced.
Lagache et al. (2003) predicted 62 per cent of 175 sources would have and the remainder . We find only one 175 source with mJy with and therefore have per cent with . However, our mix of higher redshift ULIRGs and lower redshift starburst galaxies is in good qualitative agreement with the predictions of the Lagache et al. (2003) starburst templates as adopted by Sajina et al. (2003). Lagache et al. (2003) also state that to gain agreement between their models and observations they require a cold local population which is what has been found.
There has also been recent investigation into the submillimetre properties of the local universe through the SCUBA Local Universe Galaxy Survey (Dunne and Eales, 2001; Dunne et al., 2000). This survey found a population of galaxies with and dust masses of . The population was fitted with a two-component dust model to discover cold dust temperatures of K and hot dust temperatures of K. It is clear that the local 175 FIRBACK population has very similar properties to these galaxies. The sources of the far–infrared background are therefore offering a stepping stone between high redshift SCUBA galaxies and the local universe.
10 Acknowledgements
E. L. Taylor acknowledges support from a PPARC studentship. Ph. Héraudeau acknowledges support from the EU TMR Network “SISCO” (HPRN-CT-2002-00316). S. Mei thanks Marc Postman for insights on the galaxy morphological classification. We thank an anonymous referee for a thorough reading of our paper which significantly improved the presentation of its results.
References
- Babbedge et al. (2004) Babbedge T. S. R. et al., 2004, MNRAS, 353, 654
- Blain et al. (1999) Blain, A. W., Smail, I., Ivison, R. J., Kneib, J.-P., 1999, MNRAS, 302, 632
- Bruzual and Charlot (1993) Bruzual A., G. and Charlot, S., 1993, ApJ, 405, 538
- Burigana et al. (1997) Burigana, C., Danese, L., de Zotti, G., Franceschini, A., Mazzei, P., Toffolatti, L., 1997, MNRAS, 287, L17
- Chapman et al. (2002) Chapman, S. C., Smail, I., Ivison, R. J., Helou, G., Dale, D. A., and Lagache, G., 2002, ApJ, 573, 66
- Chary and Elbaz (2001) Chary, R. and Elbaz, D., 2001, ApJ, 556, 562
- Ciliegi et al. (1999) Ciliegi, P. et al., 1999, MNRAS, 302, 222
- Cram et al. (1998) Cram, L., Hopkins, A., Mobasher, B., and Rowan-Robinson, M., 1998, ApJ, 507, 155
- Dennefeld et al. (2005) Dennefeld, et al., 2005, A&A, submitted
- Dole et al. (1999) Dole, H. et al., 1999, usis.conf.1031D
- Dole et al. (2001) Dole, H. et al., 2001, A&A, 372, 364
- Dunne et al. (2000) Dunne, L., Eales, S., Edmunds, M., Ivison, R., Alexander, P., and Clements, D. L., 2000, MNRAS, 315, 115
- Dunne and Eales (2001) Dunne, L. and Eales, S. A., 2001, MNRAS, 327, 697
- Efstathiou and Rowan-Robinson (2003) Efstathiou, A. and Rowan-Robinson, M., 2003, MNRAS, 343, 322
- Efstathiou et al. (2000) Efstathiou, A., Rowan-Robinson, M., and Siebenmorgen, R., 2000, MNRAS, 313, 734
- Elbaz et al. (2002) Elbaz, D., Cesarsky, C. J., Chanial, P., Aussel, H., Franceschini, A., Fadda, D., and Chary, R. R., 2002, A&A, 384, 848
- Farrah et al. (2003) Farrah, D., Afonso, J., Efstathiou, A., Rowan-Robinson, M., Fox, M., Clements, D., 2003, MNRAS, 343, 585
- Franceschini et al. (2001) Franceschini, A., Aussel, H., Cesarsky, C. J., Elbaz, D., and Fadda, D., 2001, A&A, 378, 1
- González–Solares et al. (2003) González–Solares E. et. al., 2003, MNRAS, submitted astro-ph/0402406
- Greve et al. (2004) Greve, T. R., Ivison, R. J., Bertoldi, F., Stevens, J. A., Dunlop, J. S., Lutz, D., Carilli, C. L., 2004, MNRAS, 354, 779
- Hacking and Soifer (1991) Hacking, P. B. and Soifer, B. T., 1991, ApJ, 367, 49
- Héraudeau et al. (2004) Héraudeau, Ph. et al., 2004, MNRAS, 354, 924
- Hildebrand (1983) Hildebrand, R. H., 2004, QJRAS, 24, 267
- Kennicutt (1998) Kennicutt, R. C., 1998, ARA&A, 36, 189
- Kessler et al. (1996) Kessler, M. F. et al., 1996, A&A, 315, L27
- Lagache et al. (2003) Lagache, G., Dole, H., and Puget, J.-L., 2003, MNRAS, 338, 555
- Lawrence et al. (1999) Lawrence, A. et al., 1999, MNRAS, 308, 897
- Lemke et al. (1996) Lemke, D. et al., 1996, A&A, 315, 64
- Lonsdale et al. (1990) Lonsdale, C. J., Hacking, P. B., Conrow, T. P., Rowan-Robinson, M., 1990, ApJ, 358, 60
- Madau et al. (1998) Madau, P., Pozzetti, L., and Dickinson, M., 1998, ApJ, 498, 106
- Mann et al. (1997) Mann, R. G. et al., 1997, MNRAS, 289, 482
- Mann et al. (2002) Mann, R. G. et al., 2002, MNRAS, 332, 549
- Mathis et al. (1983) Mathis, J. S., Mezger, P. G., and Panagia, N., 1983, A&A, 128, 212
- McMahon et al. (2001) McMahon, R. G., Walton, N. A., Irwin, M. J., Lewis, J. R., Bunclark, P. S., Jones, D. H., 2001, NewAR, 45, 97M
- Oliver et al. (1992) Oliver, S. J. and Rowan-Robinson, M. and Saunders, W., 1992, MNRAS, 256, 15
- Partridge and Peebles (1967) Partridge, R. B., Peebles, P. J. E., 1967, ApJ, 148, 377
- Patris et al. (2003) Patris, J., Dennefeld, M., Lagache, G., Dole, H., 2003, A&A, 412, 349
- Postman et al. (2005) Postman, M. et al., 2005, ApJ, submitted
- Puget et al. (1996) Puget, J.-L., Abergel, A., Bernard, J.-P., Boulanger, F., Burton, W. B., Desert, F.-X., and Hartmann, D., 1996, A&A, 308, L5+
- Rowan-Robinson et al. (2004) Rowan-Robinson, M. et al., 2004, MNRAS, 351, 1290
- Sajina et al. (2003) Sajina, A., Borys, C., Chapman, S., Dole, H., Halpern, M., Lagache, G., Puget, J.-L., and Scott, D., 2003, MNRAS, 343, 1365
- Scott et al. (2002) Scott, S. E. et al., 2002, MNRAS, 331, 817
- Siebenmorgen and Kruegel (1992) Siebenmorgen, R. and Kruegel, E., 1992, A&A, 259, 614
- Silva et al. (1998) Silva, L., Granato, G. L., Bressan, A., Danese, L., 1998, ApJ, 509, 103
- Soifer et al. (1987) Soifer, B. T., Neugebauer, G., Houck, J. R., 1987, ARA&A, 25, 187
- Sunyaev et al. (1978) Sunyaev, R. A., Tinsley, B. M., Meier, D. L., 1978, CompAp, 7, 183
- Vaccari et al. (2004) Vaccari, M. et al., 2004, MNRAS, submitted astro-ph/0404315
11 Appendix
Notes on the multiwavelength associations for individual sources. Images of each of the sources are shown in Figure 16.
-
FN2 - 000: Identification with a bright optical galaxy (, r’ magnitude = 18.5, , irregular or edge–on spiral with tidal tail). This is also an ELAIS source (
ELAISC15_J163734.4+405208) optical ID with detected emission at 15, 6.7, 90 and radio detected emission at 20 cm. There are two other ELAIS sources (ELAISC15_J163729.3+405248,ELAISC15_J163731.3+405156) within the FIRBACK error ellipse with optical IDs with associated values of and . -
FN2 - 001: Identification with a bright optical galaxy (, r’ magnitude = 18.3, , edge–on Sb/c). This is also an ELAIS source (
ELAISC15_J163507.7+405929) optical ID with detected emission at 15, 6.7, 90 and radio detected emission at 20 cm. This also has an IRAS detection at . -
FN2 - 002: Identification with an optical galaxy (, r’ magnitude = 19.3). An ELAIS source ID (
ELAISC15_J163608.1+410507) has an optical ID with the same galaxy, however, they are different entries in the INT catalogue caused by the splitting up of bright objects by the image analyser. The ELAIS ID has , , it is an irregulare galaxy with a tidal tail and detected has emission at 15, 6.7 and 90 . This also has an IRAS detection at 60 . There are two other ELAIS sources (ELAISC15_J163608.4+410529,ELAISC15_J163611.6+410452) within the FIRBACK error ellipse with optical IDs with associated values of and . -
FN2 - 003: Identification with a bright optical galaxy (, r’ magnitude = 17.5, , Sa). This is also an ELAIS source (
ELAISC15_J163525.1+405542) optical ID with detected emission at 15, 6.7, 90 and radio detected emission at 20 cm. This also has an IRAS detection at 60 . -
FN2 - 004: This ID is a small optical galaxy (, r magnitude = 20.2). However, there is also present another large bright galaxy (r magnitude = 16.4) which is mistakenly classified as a star so is forcably not associated and assigned a of 1.0. Previous associations allowing ISO 175 sources to be associated with stars chose this ID which matches with the optical ID of an ELAIS source (
ELAISC15_J163401.8+412052) which has and detected emission at 15, 6.7, 90 and radio emission at 20 cm and has the morphology of a SBa. This also has an IRAS detection at 60 . -
FN2 - 005: Identification with bright optical galaxy (, r magnitude = 18.7, , Sa). This is also an ELAIS source (
ELAISC15_J163242.4+410847) optical ID with detected emission at 15, 6.7, 90 and radio emission at 20 cm. This also has an IRAS detection at 60 . There is another ELAIS source (ELAISC15_J163244.6+410911) within the FIRBACK error ellipse with an optical ID with an associated of . -
FN2 - 006: Identification with what appears on the image to be a pair of interacting galaxies (, r’ magnitude = 18.2, no redshift). An ELAIS source (
ELAISC15_J163506.1+411038) appears to be on the same object, however, is does not have an optical ID. There is another ELAIS source (ELAISC15_J163503.5+411137) within the FIRBACK error ellipse. -
FN2 - 007: Identification with bright compact source with two nuclei (, r magnitude = 18.0, ). This is also an ELAIS source (
ELAISC15_J163546.9+403903) optical ID with detected emission at 15, 6.7, 90 and radio emission at 20 cm. This also has an IRAS detection at 60 . There is another ELAIS source (ELAISC15_J163545.5+403825) within the FIRBACK error ellipse with an optical ID with an associated of . -
FN2 - 008: Identification with an optical galaxy (, r’ magnitude = 18.4). However, the 175 flux has been assigned in the ELAIS catalogue to a source (
ELAISC15_J163548.0+412829) with a different optical ID. This ID has for association with the FIRBACK source and is therefore a possible identification. The ELAIS source has and detected emission at 15, 6.7, 90 and radio emission at 20 cm, it is an Sb galaxy. This also has an IRAS detection at 60 . -
FN2 - 009: This source does not have a confident optical identification. It is best associated with a galaxy with , this does not agree with the optical ID for the ELAIS source (
ELAISC15_J163359.2+405303, , r’ magnitude=18.8) to which the 175 flux has been assigned, this source also has detected emission at 15, 6.7, 90 and radio emission at 20 cm. This source is confidently identified as a star when stellar associations are allowed with (the threshold for these associations is ), however, this still does not agree with the ELAIS optical ID. -
FN2 - 010: Identification with a pair of interacting galaxies, an irregular with a tidal tail and an Sa (, r’ magnitude = 18.8). An ELAIS source (
ELAISR163536+411726) ID has an optical ID with the same galaxy, however, they are different entries in the INT catalogue caused by the splitting up of bright objects by the image analyser. The ELAIS source has and detected emission at 90 and radio emission at 20 cm. This also has an IRAS detection at 60 . -
FN2 - 011: Identification with an optical galaxy (, r’ magnitude = 19.8, , Sa?). However, the 175 flux has been assigned in the ELAIS catalogue to a source (
ELAISR163809+405839T) with a different galaxy ID (r magnitude = 18.6) and detected emission only in the far–infrared and radio. This has a value of 0.547 for association with the FIRBACK source, it is therefore not an acceptable association. -
FN2 - 012: Identification with an optical galaxy (, r’ magnitude = 18.5). However, the 175 flux has been assigned in the ELAIS catalogue to a source (
ELAISC15_J163412.0+405652) with a different galaxy ID (r magnitude = 20.0). This ID has for association with the FIRBACK source and is therefore a possible identification. The ELAIS source has and detected emission at 15, 6.7, 90 and radio emission at 20 cm, it is possibly an Sa. There are two other ELAIS sources (ELAISC15_J163417.4+405710,ELAISC15_J163417.9+405653) within the FIRBACK error ellipse with optical IDs with associated values of and . -
FN2 - 013: This source does not have a confident optical identification. It is best associated with an optical galaxy (, r’ magnitude = 20.4). This is also an ELAIS source (
ELAISC15_J163406.5+405106) optical ID with detected emission at 15 . -
FN2 - 014: This source appears in the ELAIS 90 and 175 unassociated catalogue (
ELAIS-FBK175_N2_014). It does not have a confident optical identification. -
FN2 - 015: Identification with a pair of interacting galaxies, an Sa/b and an Sa, (, r magnitude = 18.6, ). This is also an ELAIS source (
ELAISC15_J163607.7+405546) optical ID with detected emission at 15, 6.7, 90 and radio emission at 20 cm. -
FN2 - 016: Identification with an edge–on optical galaxy whose morphological type is unclear (, r’ magnitude = 20.0). An ELAIS source (
ELAISC15_J163423.9+405410) ID has an optical ID with the same galaxy, however, they are different entries in the INT catalogue caused by the splitting up of bright objects by the image analyser. This source has and detected emission at 15, 6.7 and radio emission at 20 cm. This also has IRAS detections at 60 and 100 . There are two other ELAIS sources (ELAISC7_J163421+405413,ELAISC7_J163423+405506) within the FIRBACK error ellipse one with an optical ID with , the other has no optical ID. -
FN2 - 017: Identification with a pair of interacting galaxies, an Sa and an edge–on spiral, (, r’ magnitude = 18.5, ). The 175 flux is assigned to an ELAIS source (
ELAISR163442+410759) with a galaxy ID with associated , it is very faint and far from the source. There is, however, another ELAIS source (ELAISR163445+410817) present, with detected emission only in the radio, in the error ellipse without an optical ID which is only about 5arcsec from our FIRBACK optical ID. -
FN2 - 018: Identification with an optical galaxy (, r’ magnitude = 19.5, , SO/a). However, the 175 flux has been assigned in the ELAIS catalogue to a source (
ELAISC15_J163334.1+410139) with a different galaxy ID with (r magnitude = 20.5), it is therefore not a possible ID. This also has an IRAS detection at 60 . There is another ELAIS source (ELAISR163333+410112) within the FIRBACK error ellipse whose galaxy ID has a -
FN2 - 019: Identification with an optical galaxy (, r’ magnitude = 18.1, , Sb). The ELAIS source (
ELAISR163716+404825) to which the 175 flux has been assigned does not have an optical ID, it has detected emission at and 20 cm. This also has an IRAS detection at 60 . -
FN2 - 020: Identification with an optical galaxy (, r’ magnitude = 20.2, ). The ELAIS source (
ELAISC15_J163242.7+410627) to which the 175 flux has been assigned is fainter (r magnitude = 22.1) and further from the source than our ID and therefore has a higher value of 0.990. -
FN2 - 021: Identification with an optical galaxy (, r’ magnitude = 17.6, ). However, the flux of this FIRBACK source is below the ELAIS catalogue limit of 223 mJy and therefore as it has no associations at other ELAIS wavelengths it is omitted from the catalogue.
-
FN2 - 022: Identification with an optical galaxy (, r’ magnitude = 19.1). The ELAIS source (
ELAISC15_J163708.1+412856) to which the 175 flux has been assigned has an optical identification with a bright optical galaxy with r’ magnitude = 18.8, it has and is therefore a possible identification for the FIRBACK source. This ELAIS source has , is an Sa and detected emission at 15, 6.7 and radio emission at 20 cm. There is another ELAIS source (ELAISC7_J163709+412832) within the FIRBACK error elipse, however, its optical ID is stellar and therefore it has . -
FN2 - 023: Identification with an optical galaxy (, r’ magnitude = 19.0, , Sb/c). However, the flux of this FIRBACK source is below the ELAIS catalogue limit of 223 mJy and therefore as it has no associations at other ELAIS wavelengths it is omitted from the catalogue.
-
FN2 - 024: This source does not have a confident optical association. The flux of this FIRBACK source is also below the ELAIS catalogue limit of 223 mJy and therefore as it has no associations at other ELAIS wavelengths it is omitted from the catalogue.
-
FN2 - 025: Identification with an optical galaxy (, r’ magnitude = 20.2, , Sa).The ELAIS source (
ELAISC7_J163628+404757) to which the 175 flux has been assigned has optical ID classed as a galaxy, however, it looks stellar and has a of 0.974 so is not a possible ID. There is another ELAIS source (ELAISC7_J163633+404749) within the FIRBACK error elipse, however, its optical ID is stellar and therefore it has . This also has IRAS detections at 60 and 100 . -
FN2 - 026: This source does not have a confident optical ID. It is associated with a galaxy with r’ magnitude 22.4 with a . There is an ELAIS source (
ELAISC15_J163615.7+404759) within the FIRBACK error ellipse, however, it has a stellar optical ID and therefore has . -
CFN2 - 027: This source does not have a confident optical ID. It is associated with a galaxy with r’ magnitude 20.7 with a . This does not agree with the ELAIS source (
ELAISR163703+412425) optical ID which is a galaxy with . -
CFN2 - 028: This source does not have a confident optical association. The flux of this FIRBACK source is also below the ELAIS catalogue limit of 223 mJy and therefore as it has no associations at other ELAIS wavelengths it is omitted from the catalogue.
-
CFN2 - 029: Identification with an optical galaxy (, r’ magnitude = 19.6, ). The 175 flux has been assigned to a fainter galaxy (
ELAISR163418+410729, r’ magnitude = 22.2) which is further from the FIRBACK position than our ID, it therefore has a high of 1.0. This also has an IRAS detection at 60 . There are three other ELAIS sources (ELAISR163419+410641,ELAISC15_J163421.4+410622,ELAISR163422+410648) within the FIRBACK error ellipse, however, none of them have optical IDs. -
CFN2 - 030: Identification with an optical galaxy (, r’ magnitude = 20.3, , S0/a). However, the flux of this FIRBACK source is below the ELAIS catalogue limit of 223 mJy and therefore as it has no associations at other ELAIS wavelengths it is omitted from the catalogue. However, it has IRAS detections at 60 and 100 .
-
CFN2 - 031: This source does not have a confident optical association. The flux of this FIRBACK source is also below the ELAIS catalogue limit of 223 mJy and therefore as it has no associations at other ELAIS wavelengths it is omitted from the catalogue.
-
CFN2 - 032: This source does not have a confident optical association. The flux of this FIRBACK source is also below the ELAIS catalogue limit of 223 mJy and therefore as it has no associations at other ELAIS wavelengths it is omitted from the catalogue.
-
CFN2 - 033: This source does not have a confident optical ID. It is associated with a galaxy with r’ magnitude 21.8 with a .
-
CFN2 - 034: Identification with an optical galaxy (, r’ magnitude = 19.4, , S0/a). However, the flux of this FIRBACK source is below the ELAIS catalogue limit of 223 mJy and therefore as it has no associations at other ELAIS wavelengths it is omitted from the catalogue.
-
CFN2 - 035: This source does not have a confident optical association. The flux of this FIRBACK source is also below the ELAIS catalogue limit of 223 mJy and therefore as it has no associations at other ELAIS wavelengths it is omitted from the catalogue.
-
CFN2 - 036: Identification with an optical galaxy (, r’ magnitude = 19.4, , Sa). However, the flux of this FIRBACK source is below the ELAIS catalogue limit of 223 mJy and therefore as it has no associations at other ELAIS wavelengths it is omitted from the catalogue. However, it has IRAS detections at 60 and 100 .
-
CFN2 - 037: This source does not have a confident optical ID. It is associated with a galaxy with r’ magnitude 22.1 with a . When associations are allowed with all objects this source is identified as a star with . However, this still does not agree with the stellar optical ID of the ELAIS source (
ELAISR163812+405452) assigned the 175 flux. -
CFN2 - 038: Identification with an optical galaxy (, r’ magnitude = 19.3, , Sb/c). This is also the optical ID for an ELAIS source (
ELAISC15_J163431.5+412246) with detected emission at 15 and has an IRAS detection at 100 . -
CFN2 - 039: Identification with an optical galaxy (, r’ magnitude = 17.2, , Sb). This is also the optical ID for an ELAIS source (
ELAISC15_J163613.6+404230) with detected emission at 15, 6.7, 90 and radio emission at 20 cm. This also has an IRAS detection at 60 . -
CFN2 - 040: This source does not have a confident optical ID. It is best associated with a galaxy with r’ magnitude 20.5 and . The ELAIS source (
ELAISC15_J163641.1+413131) to which the 175 flux has been assigned has a galaxy optical identification with . There is another ELAIS source (ELAISC15_J163648.1+413134) within the FIRBACK error ellipse with a galaxy optical ID with . -
CFN2 - 041: This source does not have a confident optical ID, however, its best association agrees with the optical identification of the ELAIS source (
ELAISC15_J163433.6+405953) to which the 175 flux has been assigned. This galaxy has r’ magnitude = 19.2 and , the ELAIS source has detected emission at 15 and 20 cm. There are two other ELAIS sources (ELAISR163427+405936T,ELAISC15_J163430.1+410055) within the FIRBACK error ellipse, one has a galaxy optical ID with and the other does not have an optical identification. -
CFN2 - 042: This source does not have a confident galaxy optical association. The flux of this FIRBACK source is also below the ELAIS catalogue limit of 223 mJy and therefore as it has no associations at other ELAIS wavelengths it is omitted from the catalogue.
-
CFN2 - 043: This source does not have a confident optical identification when associations are only allowed with galaxies (). However, when all objects are possible associations it is matched with a star () which is also the ELAIS source (
ELAISC7_J163546+404929) ID to which the 175 flux has been assigned. This ELAIS source has detected emission at 6.7 . -
CFN2 - 044: Identification with an optical galaxy (, r’ magnitude = 20.0, , S0/a). The ELAIS source (
ELAISC15_J163730.4+404542) to which the 175 flux has been assigned has a galaxy ID with a value of 0.995. This also has an IRAS detection at 60 . There is another ELAIS source (ELAISR163728+404533) within the FIRBACK error ellipse, however, this source does not have an optical ID. -
CFN2 - 045: This source does not have a confident galaxy optical association. The flux of this FIRBACK source is also below the ELAIS catalogue limit of 223 mJy and therefore as it has no associations at other ELAIS wavelengths it is omitted from the catalogue.
-
CFN2 - 046: This source does not have a confident optical association. The flux of this FIRBACK source is also below the ELAIS catalogue limit of 223 mJy and therefore as it has no associations at other ELAIS wavelengths it is omitted from the catalogue.
-
CFN2 - 047: Identification with an optical galaxy (, r’ magnitude = 19.0). The 175 flux has been assigned to an ELAIS source (
ELAISC15_J163449.5+412048) with a galaxy optical ID with which is therefore a possible association. This source has , is an S0/a and detections at 15, 6.7 and 20 cm. There is another ELAIS source (ELAISC15_J163451.9+411944) within the FIRBACK error ellipse with a galaxy optical ID with . -
CFN2 - 048: This source does not have a confident optical identification, is is best associated with a galaxy with . The ELAIS source (
ELAISC15_J163739.2+405643) to which the 175 flux has been assigned does not have an optical identification. -
CFN2 - 049: Identification with an optical galaxy (, r’ magnitude = 20.3, ). An ELAIS source (
ELAISC15_J163741.3+411913) ID has an optical ID with the same galaxy, however, they are different entries in the INT catalogue caused by the splitting up of bright objects by the image analyser. The ELAIS source has detected emission at 15 and 90 and is possible an Sa. This also has an IRAS detection at 60 . There is another ELAIS source (ELAISC15_J163738.9+411840) within the FIRBACK error ellipse with a galaxy optical ID with . -
CFN2 - 050: This source falls between two WFS chips.
-
CFN2 - 051: This source does not have a confident optical identification, it is best associated with a galaxy with . The ELAIS source (
ELAISC15_J163616.2+411426) to which the 175 flux has been assigned has a stellar optical ID and therefore is not a possible ID for the FIRBACK source. -
CFN2 - 052: This source does not have a confident optical identification, it is best associated with a galaxy with . The ELAIS source (
ELAISC15_J163403.0+410350) to which the 175 flux has been assigned has a galaxy optical ID with . There are two other ELAIS sources (ELAISC7_J163407+410219,ELAISR163410+410326) within the FIRBACK error ellipse one with a stellar ID and one with a galaxy ID, however, both have . -
CFN2 - 053: This source does not have a confident optical identification, it is best associated with a galaxy with . The ELAIS source (
ELAISR163621+412244) to which the 175 flux has been assigned has a galaxy optical ID with . -
CFN2 - 054: This source does not have a confident optical identification. When associated with all optical objects it is confidently associated with a star with , the ELAIS source (
ELAISC7_J163658+411417) assigned the 175 flux also has a stellar ID with which is below the limit of 0.4 and therefore a possible association.